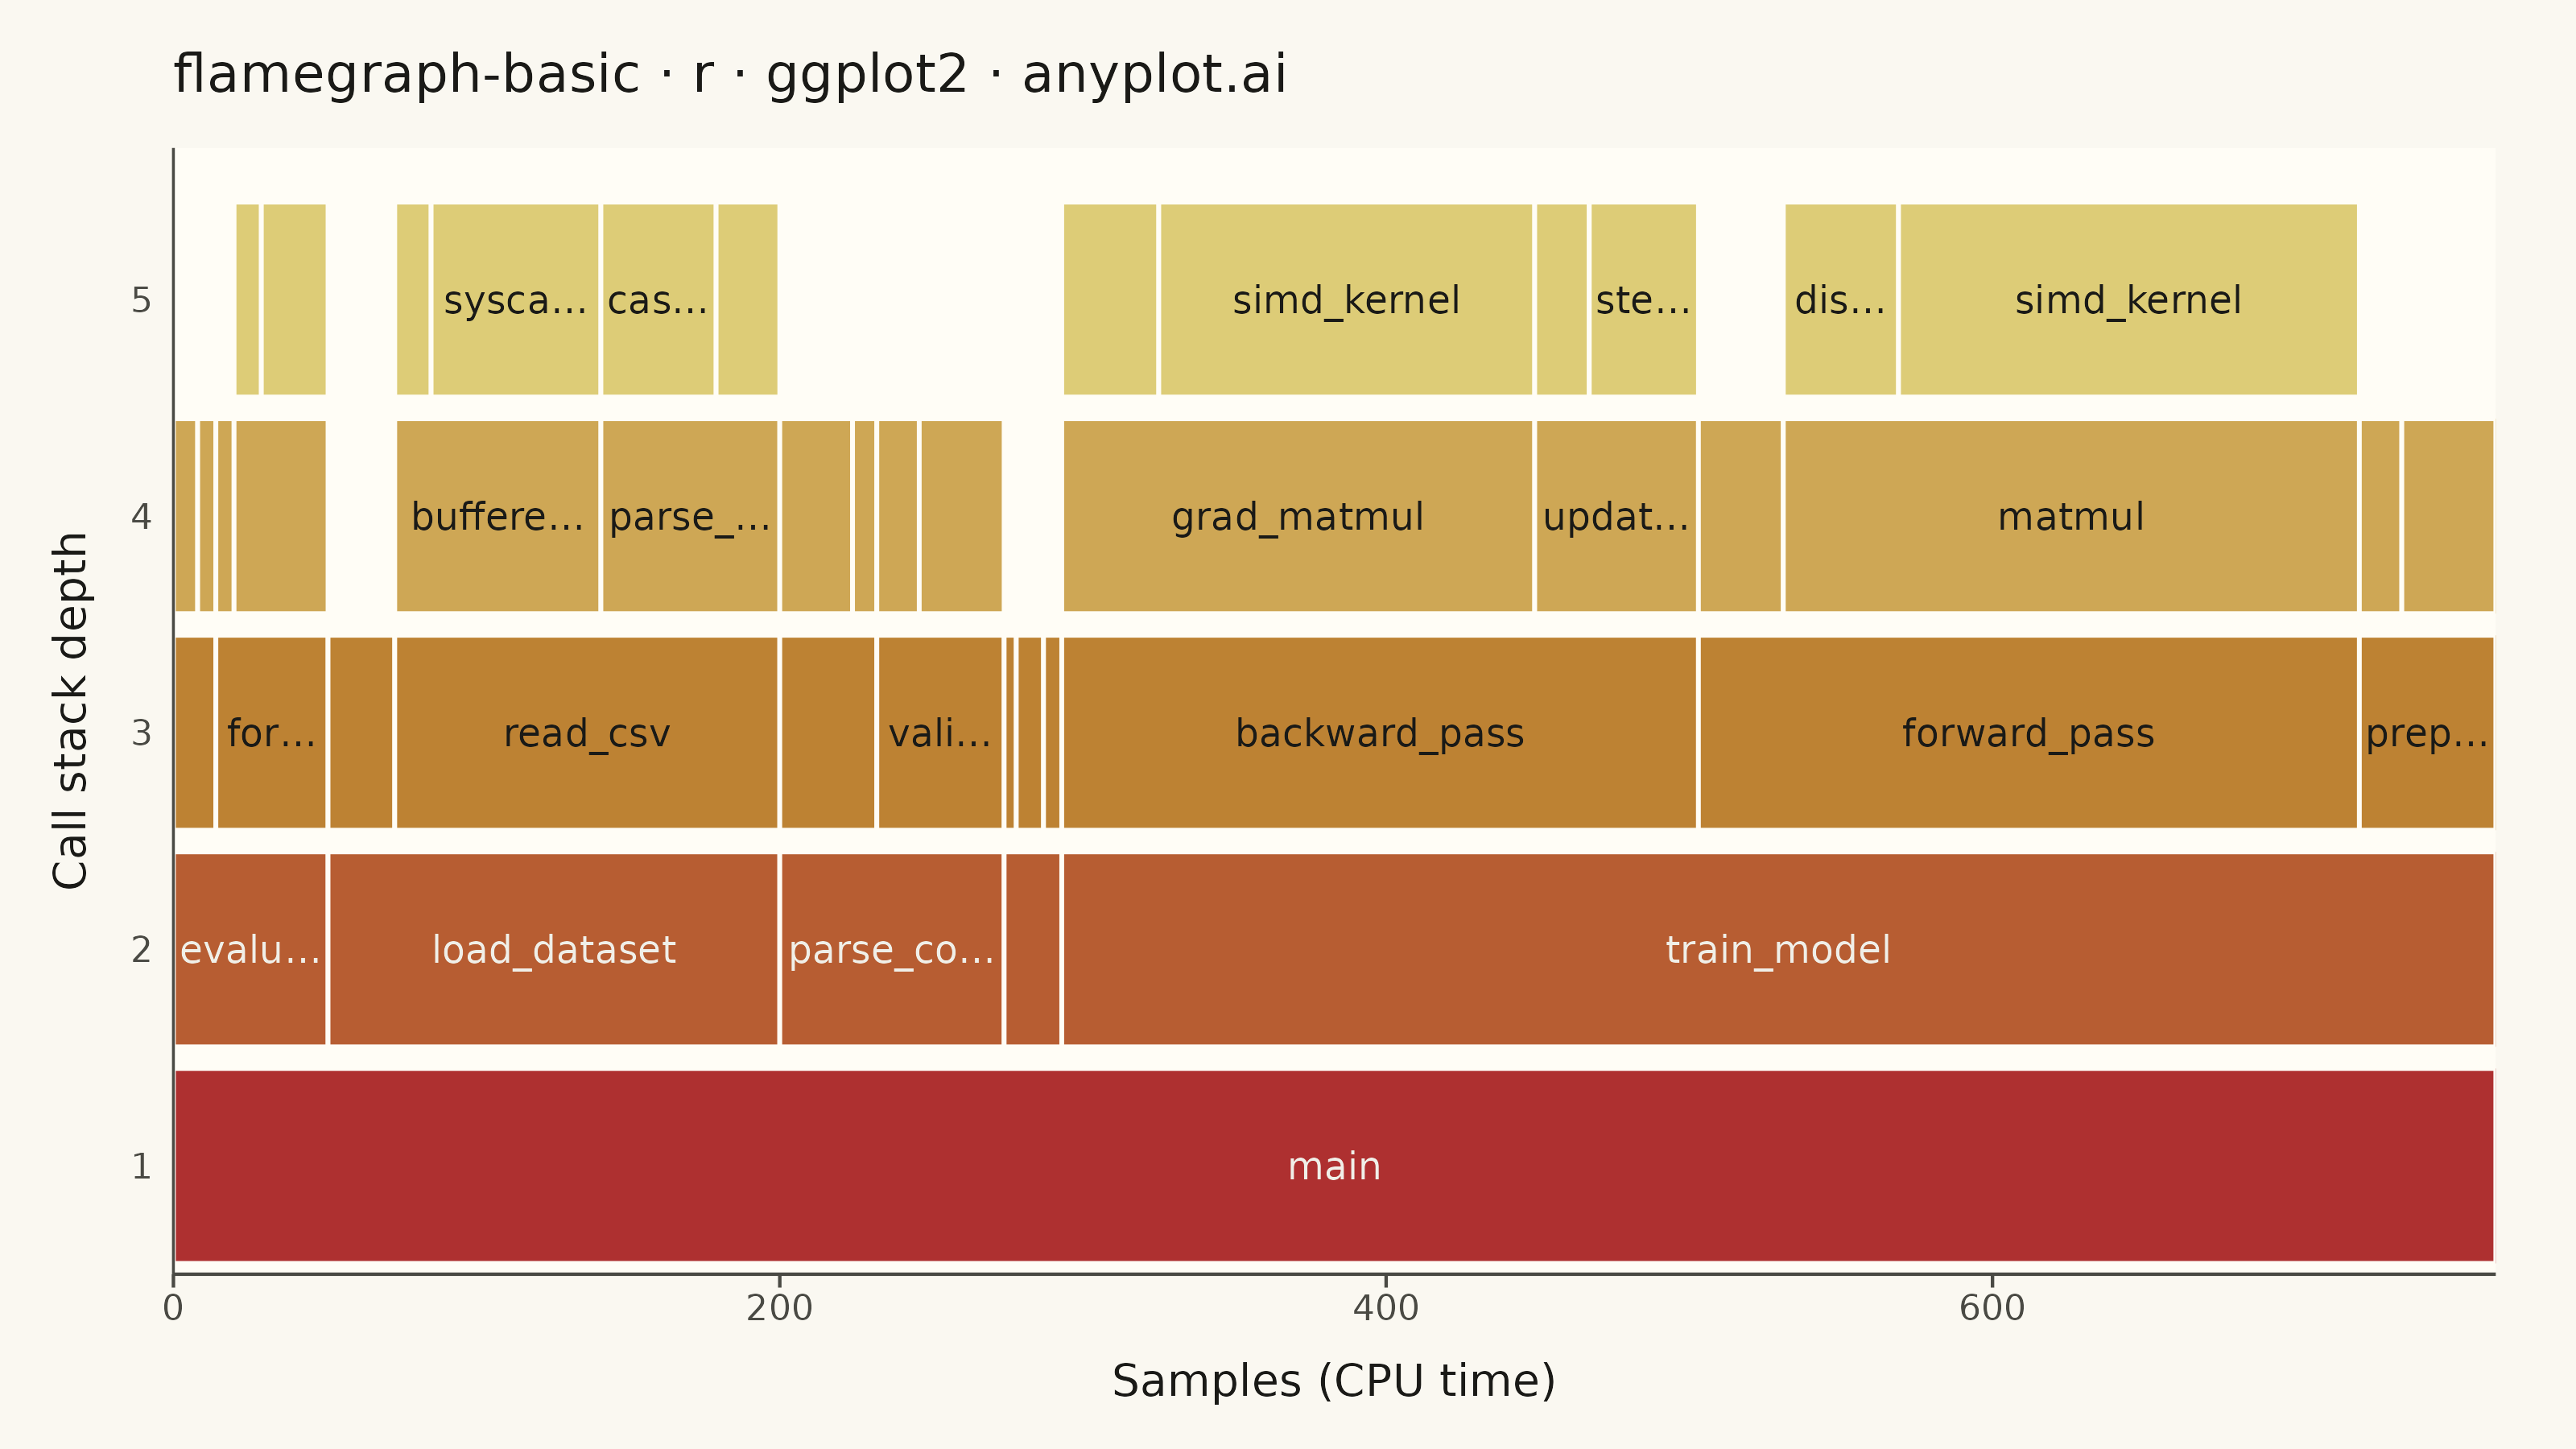
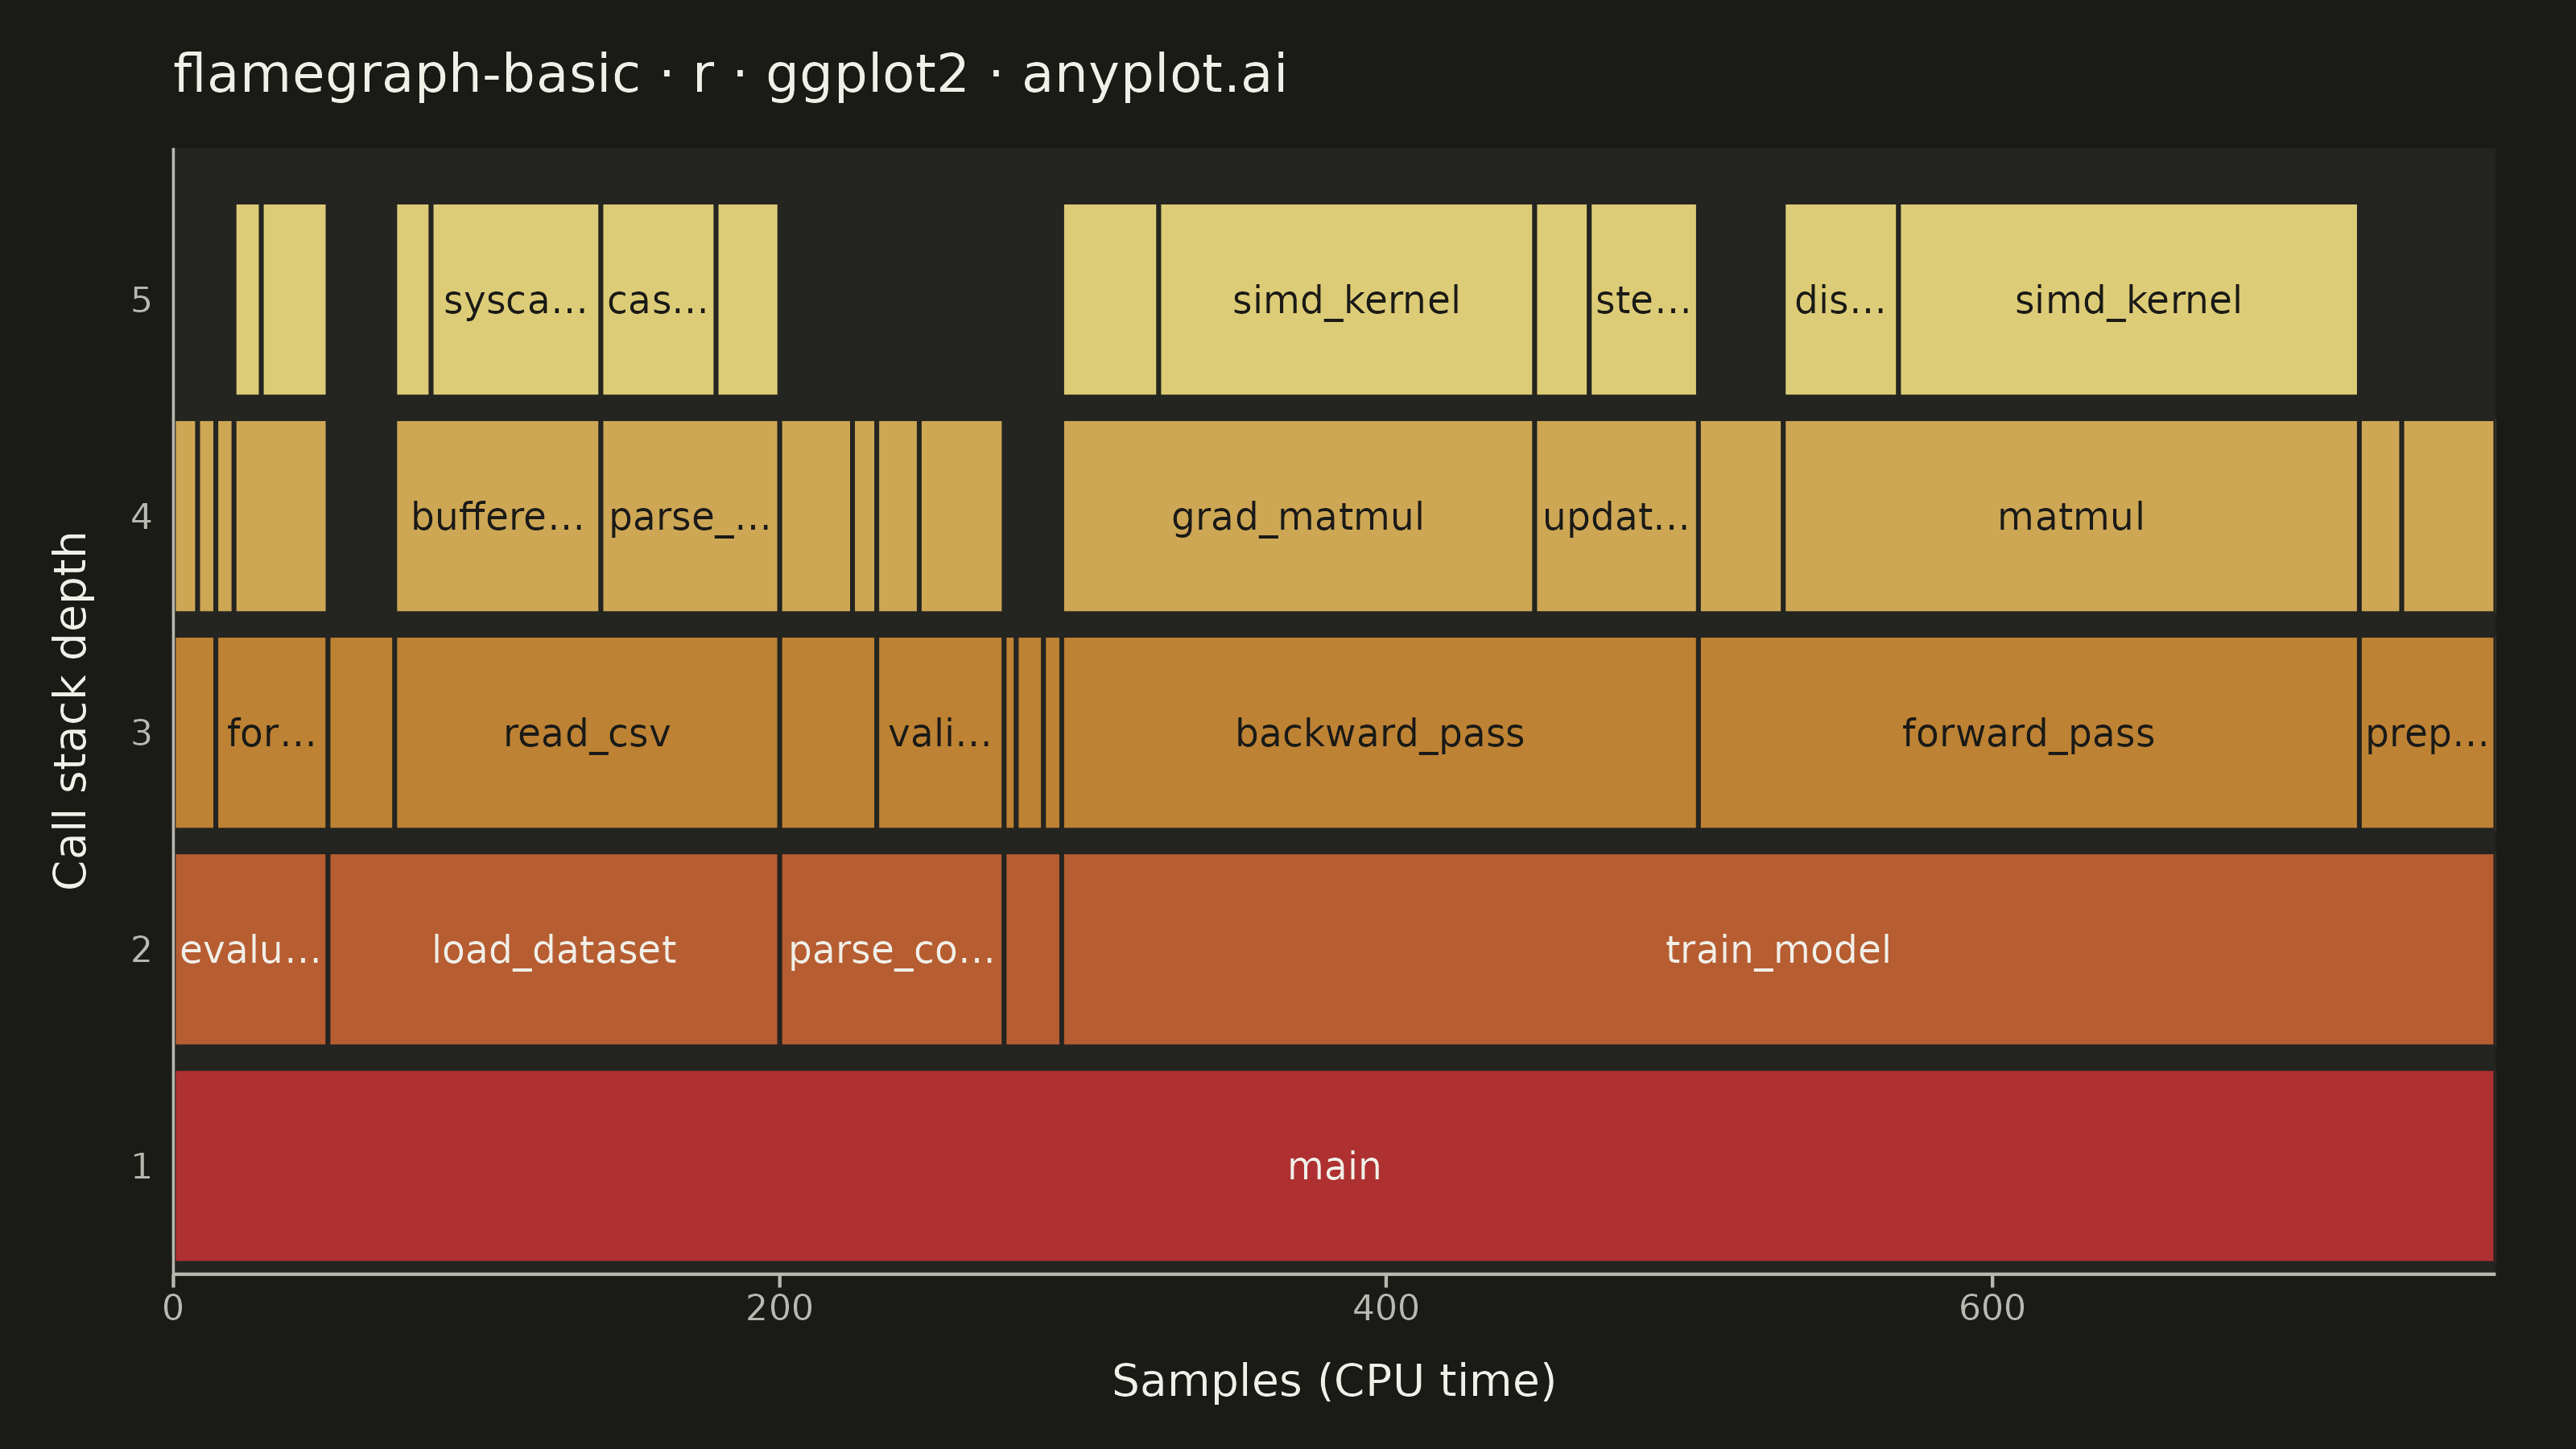
The same plot in 14 other libraries — Python: Altair, Bokeh, lets-plot, Matplotlib, Plotly, plotnine, Pygal, Seaborn; Julia: Makie.jl; JavaScript: Chart.js, D3.js, Apache ECharts, Highcharts, MUI X Charts. Compare all 15 side by side: Flame Graph for Performance Profiling in Python, R, Julia and JavaScript.
A flame graph visualizes hierarchical call stack data from performance profiling, where each horizontal bar represents a function in the call stack and its width is proportional to the time (or samples) spent in that function. Stacks are layered bottom-to-top showing caller-to-callee relationships. Invented by Brendan Gregg, flame graphs are the standard visualization for identifying CPU bottlenecks and hot code paths across all major programming languages and profiling tools.
#' anyplot.ai
#' flamegraph-basic: Flame Graph for Performance Profiling
#' Library: ggplot2 3.5.1 | R 4.4.1
#' Quality: 86/100 | Created: 2026-06-08

library(ggplot2)
library(dplyr)
library(tidyr)
library(ragg)

set.seed(42)

# Theme tokens — Imprint, theme-adaptive chrome
THEME       <- Sys.getenv("ANYPLOT_THEME", "light")
PAGE_BG     <- if (THEME == "light") "#FAF8F1" else "#1A1A17"
ELEVATED_BG <- if (THEME == "light") "#FFFDF6" else "#242420"
INK         <- if (THEME == "light") "#1A1A17" else "#F0EFE8"
INK_SOFT    <- if (THEME == "light") "#4A4A44" else "#B8B7B0"
INK_MUTED   <- if (THEME == "light") "#6B6A63" else "#A8A79F"

# Imprint warm anchors — semantic exception for the conventional
# flame-graph aesthetic (matte red → ochre → amber).
FLAME_BASE  <- "#AE3030"  # matte red (Imprint pos 5) — base of flame
FLAME_MID   <- "#BD8233"  # ochre (Imprint pos 4)
FLAME_TIP   <- "#DDCC77"  # amber (Imprint anchor) — tip of flame
# Dual label inks — picked per bar via fill luminance so deep-flame rows
# (matte-red base) read in light ink while warm tip rows keep dark ink.
LABEL_DARK  <- "#1A1A17"
LABEL_LIGHT <- "#F0EFE8"

# Data — simulated CPU profile of a model-training script.
# Each row is a leaf call stack and its sample count; parent widths
# are derived by summing all descendant leaves through the prefix.
stacks <- tibble::tribble(
  ~stack, ~value,
  "main;parse_config;tokenize;regex_match",                         24,
  "main;parse_config;tokenize;trim_ws",                              8,
  "main;parse_config;validate_schema;type_check",                   28,
  "main;parse_config;validate_schema;range_check",                  14,
  "main;load_dataset;read_csv;buffered_read;syscall_read",          56,
  "main;load_dataset;read_csv;buffered_read;prefetch",              12,
  "main;load_dataset;read_csv;parse_row;cast_types",                38,
  "main;load_dataset;read_csv;parse_row;split_columns",             21,
  "main;load_dataset;decode_utf8",                                  22,
  "main;train_model;preprocess;normalize",                          31,
  "main;train_model;preprocess;impute_missing",                     14,
  "main;train_model;forward_pass;matmul;simd_kernel",              152,
  "main;train_model;forward_pass;matmul;dispatch_blas",             38,
  "main;train_model;forward_pass;activation_relu",                  28,
  "main;train_model;backward_pass;grad_matmul;simd_kernel",        124,
  "main;train_model;backward_pass;grad_matmul;dispatch_blas",       32,
  "main;train_model;backward_pass;update_weights;step_sgd",         36,
  "main;train_model;backward_pass;update_weights;apply_momentum",   18,
  "main;evaluate;forward_pass;matmul;simd_kernel",                  22,
  "main;evaluate;forward_pass;matmul;dispatch_blas",                 9,
  "main;evaluate;forward_pass;activation_relu",                      6,
  "main;evaluate;compute_metrics;accuracy_top_k",                    8,
  "main;evaluate;compute_metrics;confusion_matrix",                  6,
  "main;render_report;format_summary",                               9,
  "main;render_report;write_output",                                 6,
  "main;render_report;compress_artifacts",                           4
)

# Expand each leaf stack into per-depth prefix frames, then aggregate.
expand_stack <- function(stack_str, val) {
  parts <- strsplit(stack_str, ";", fixed = TRUE)[[1]]
  tibble::tibble(
    depth  = seq_along(parts),
    func   = parts,
    prefix = vapply(seq_along(parts),
                    function(i) paste(parts[seq_len(i)], collapse = ";"),
                    character(1)),
    value  = val
  )
}

frames <- do.call(rbind, Map(expand_stack, stacks$stack, stacks$value)) %>%
  group_by(depth, prefix) %>%
  summarise(value = sum(value), .groups = "drop") %>%
  mutate(
    func   = vapply(strsplit(prefix, ";", fixed = TRUE),
                    function(p) p[length(p)], character(1)),
    parent = vapply(strsplit(prefix, ";", fixed = TRUE),
                    function(p) if (length(p) == 1) NA_character_
                                else paste(p[-length(p)], collapse = ";"),
                    character(1))
  ) %>%
  arrange(depth, prefix) %>%
  as.data.frame()

# Lay out x positions: each child sits within its parent's span,
# siblings ordered alphabetically (standard flame-graph convention).
frames$xmin <- NA_real_
frames$xmax <- NA_real_

for (d in sort(unique(frames$depth))) {
  if (d == 1) {
    cum <- 0
    for (i in which(frames$depth == 1)) {
      frames$xmin[i] <- cum
      frames$xmax[i] <- cum + frames$value[i]
      cum <- cum + frames$value[i]
    }
  } else {
    for (par in unique(frames$parent[frames$depth == d])) {
      par_row <- which(frames$prefix == par)
      cum     <- frames$xmin[par_row]
      kids    <- which(frames$parent == par & frames$depth == d)
      kids    <- kids[order(frames$prefix[kids])]
      for (i in kids) {
        frames$xmin[i] <- cum
        frames$xmax[i] <- cum + frames$value[i]
        cum <- cum + frames$value[i]
      }
    }
  }
}

# Y geometry — one row per depth, narrow gap between rows.
frames$ymin <- frames$depth - 1 + 0.05
frames$ymax <- frames$depth - 0.05

# Conditional labels — truncate function names that don't fit the box,
# drop entirely when the box is too narrow for even three characters.
total_width  <- max(frames$xmax)
frames$frac  <- (frames$xmax - frames$xmin) / total_width
char_budget  <- 95
frames$max_chars <- floor(frames$frac * char_budget)
frames$label <- vapply(seq_len(nrow(frames)), function(i) {
  name  <- frames$func[i]
  max_n <- frames$max_chars[i]
  if (max_n >= nchar(name)) return(name)
  if (max_n >= 4)          return(paste0(substr(name, 1, max_n - 1L), "…"))
  ""
}, character(1))

max_depth <- max(frames$depth)

# Pick a contrasting label ink per bar — WCAG relative luminance on the
# interpolated gradient fill, threshold tuned so depth-1/2 dark-red rows
# get light text (AA) and ochre/amber rows keep dark text.
fill_ramp  <- grDevices::colorRamp(c(FLAME_BASE, FLAME_MID, FLAME_TIP))
depth_norm <- (frames$depth - 1) / (max_depth - 1)
fill_rgb   <- fill_ramp(depth_norm) / 255
fill_lin   <- ifelse(fill_rgb <= 0.03928,
                     fill_rgb / 12.92,
                     ((fill_rgb + 0.055) / 1.055) ^ 2.4)
frames$lum <- 0.2126 * fill_lin[, 1] +
              0.7152 * fill_lin[, 2] +
              0.0722 * fill_lin[, 3]
frames$label_color <- ifelse(frames$lum < 0.25, LABEL_LIGHT, LABEL_DARK)

# Plot
p <- ggplot(frames,
            aes(xmin = xmin, xmax = xmax, ymin = ymin, ymax = ymax, fill = depth)) +
  geom_rect(color = ELEVATED_BG, linewidth = 0.5) +
  geom_text(
    aes(x = (xmin + xmax) / 2, y = (ymin + ymax) / 2,
        label = label, color = label_color),
    size = 3.0, family = "sans"
  ) +
  scale_color_identity() +
  scale_fill_gradientn(
    colors = c(FLAME_BASE, FLAME_MID, FLAME_TIP),
    name   = "depth"
  ) +
  scale_x_continuous(
    expand = expansion(add = c(0, 0)),
    labels = scales::label_comma()
  ) +
  scale_y_continuous(
    expand = expansion(add = c(0.05, 0.25)),
    breaks = seq(0.5, max_depth - 0.5, by = 1),
    labels = as.character(seq_len(max_depth))
  ) +
  labs(
    title = "flamegraph-basic · r · ggplot2 · anyplot.ai",
    x     = "Samples (CPU time)",
    y     = "Call stack depth"
  ) +
  theme_minimal(base_size = 8) +
  theme(
    plot.background   = element_rect(fill = PAGE_BG, color = PAGE_BG),
    panel.background  = element_rect(fill = ELEVATED_BG, color = NA),
    panel.grid.major  = element_blank(),
    panel.grid.minor  = element_blank(),
    axis.title        = element_text(color = INK,      size = 10),
    axis.title.x      = element_text(margin = margin(t = 8)),
    axis.title.y      = element_text(margin = margin(r = 8)),
    axis.text         = element_text(color = INK_SOFT, size = 8),
    axis.ticks.x      = element_line(color = INK_SOFT),
    axis.ticks.length = unit(3, "pt"),
    axis.line.x       = element_line(color = INK_SOFT),
    axis.line.y       = element_line(color = INK_SOFT, linewidth = 0.3),
    plot.title        = element_text(color = INK, size = 12,
                                     margin = margin(b = 10)),
    plot.margin       = margin(t = 12, r = 18, b = 10, l = 12),
    legend.position   = "none"
  )

ggsave(
  filename = sprintf("plot-%s.png", THEME),
  plot     = p,
  device   = ragg::agg_png,
  width    = 8,
  height   = 4.5,
  units    = "in",
  dpi      = 400
)
Runnable source as JSON, for any HTTP client: https://api.anyplot.ai/specs/flamegraph-basic/ggplot2/code. Any spec id and library id listed in llms-full.txt fit the same URL shape; every URL below is complete and callable.
{
  "spec_id": "flamegraph-basic",
  "language": "r",
  "library": "ggplot2",
  "page": "https://anyplot.ai/flamegraph-basic/r/ggplot2",
  "hub": "https://anyplot.ai/flamegraph-basic",
  "code_json": "https://api.anyplot.ai/specs/flamegraph-basic/ggplot2/code",
  "spec_json": "https://api.anyplot.ai/specs/flamegraph-basic",
  "render_light_png": "https://storage.googleapis.com/anyplot-images/plots/flamegraph-basic/r/ggplot2/plot-light.png",
  "render_dark_png": "https://storage.googleapis.com/anyplot-images/plots/flamegraph-basic/r/ggplot2/plot-dark.png",
  "quality_score": 86.0,
  "license": "MIT",
  "guide": "https://anyplot.ai/llms.txt"
}
Part of Flame Graph for Performance Profiling on anyplot.ai.