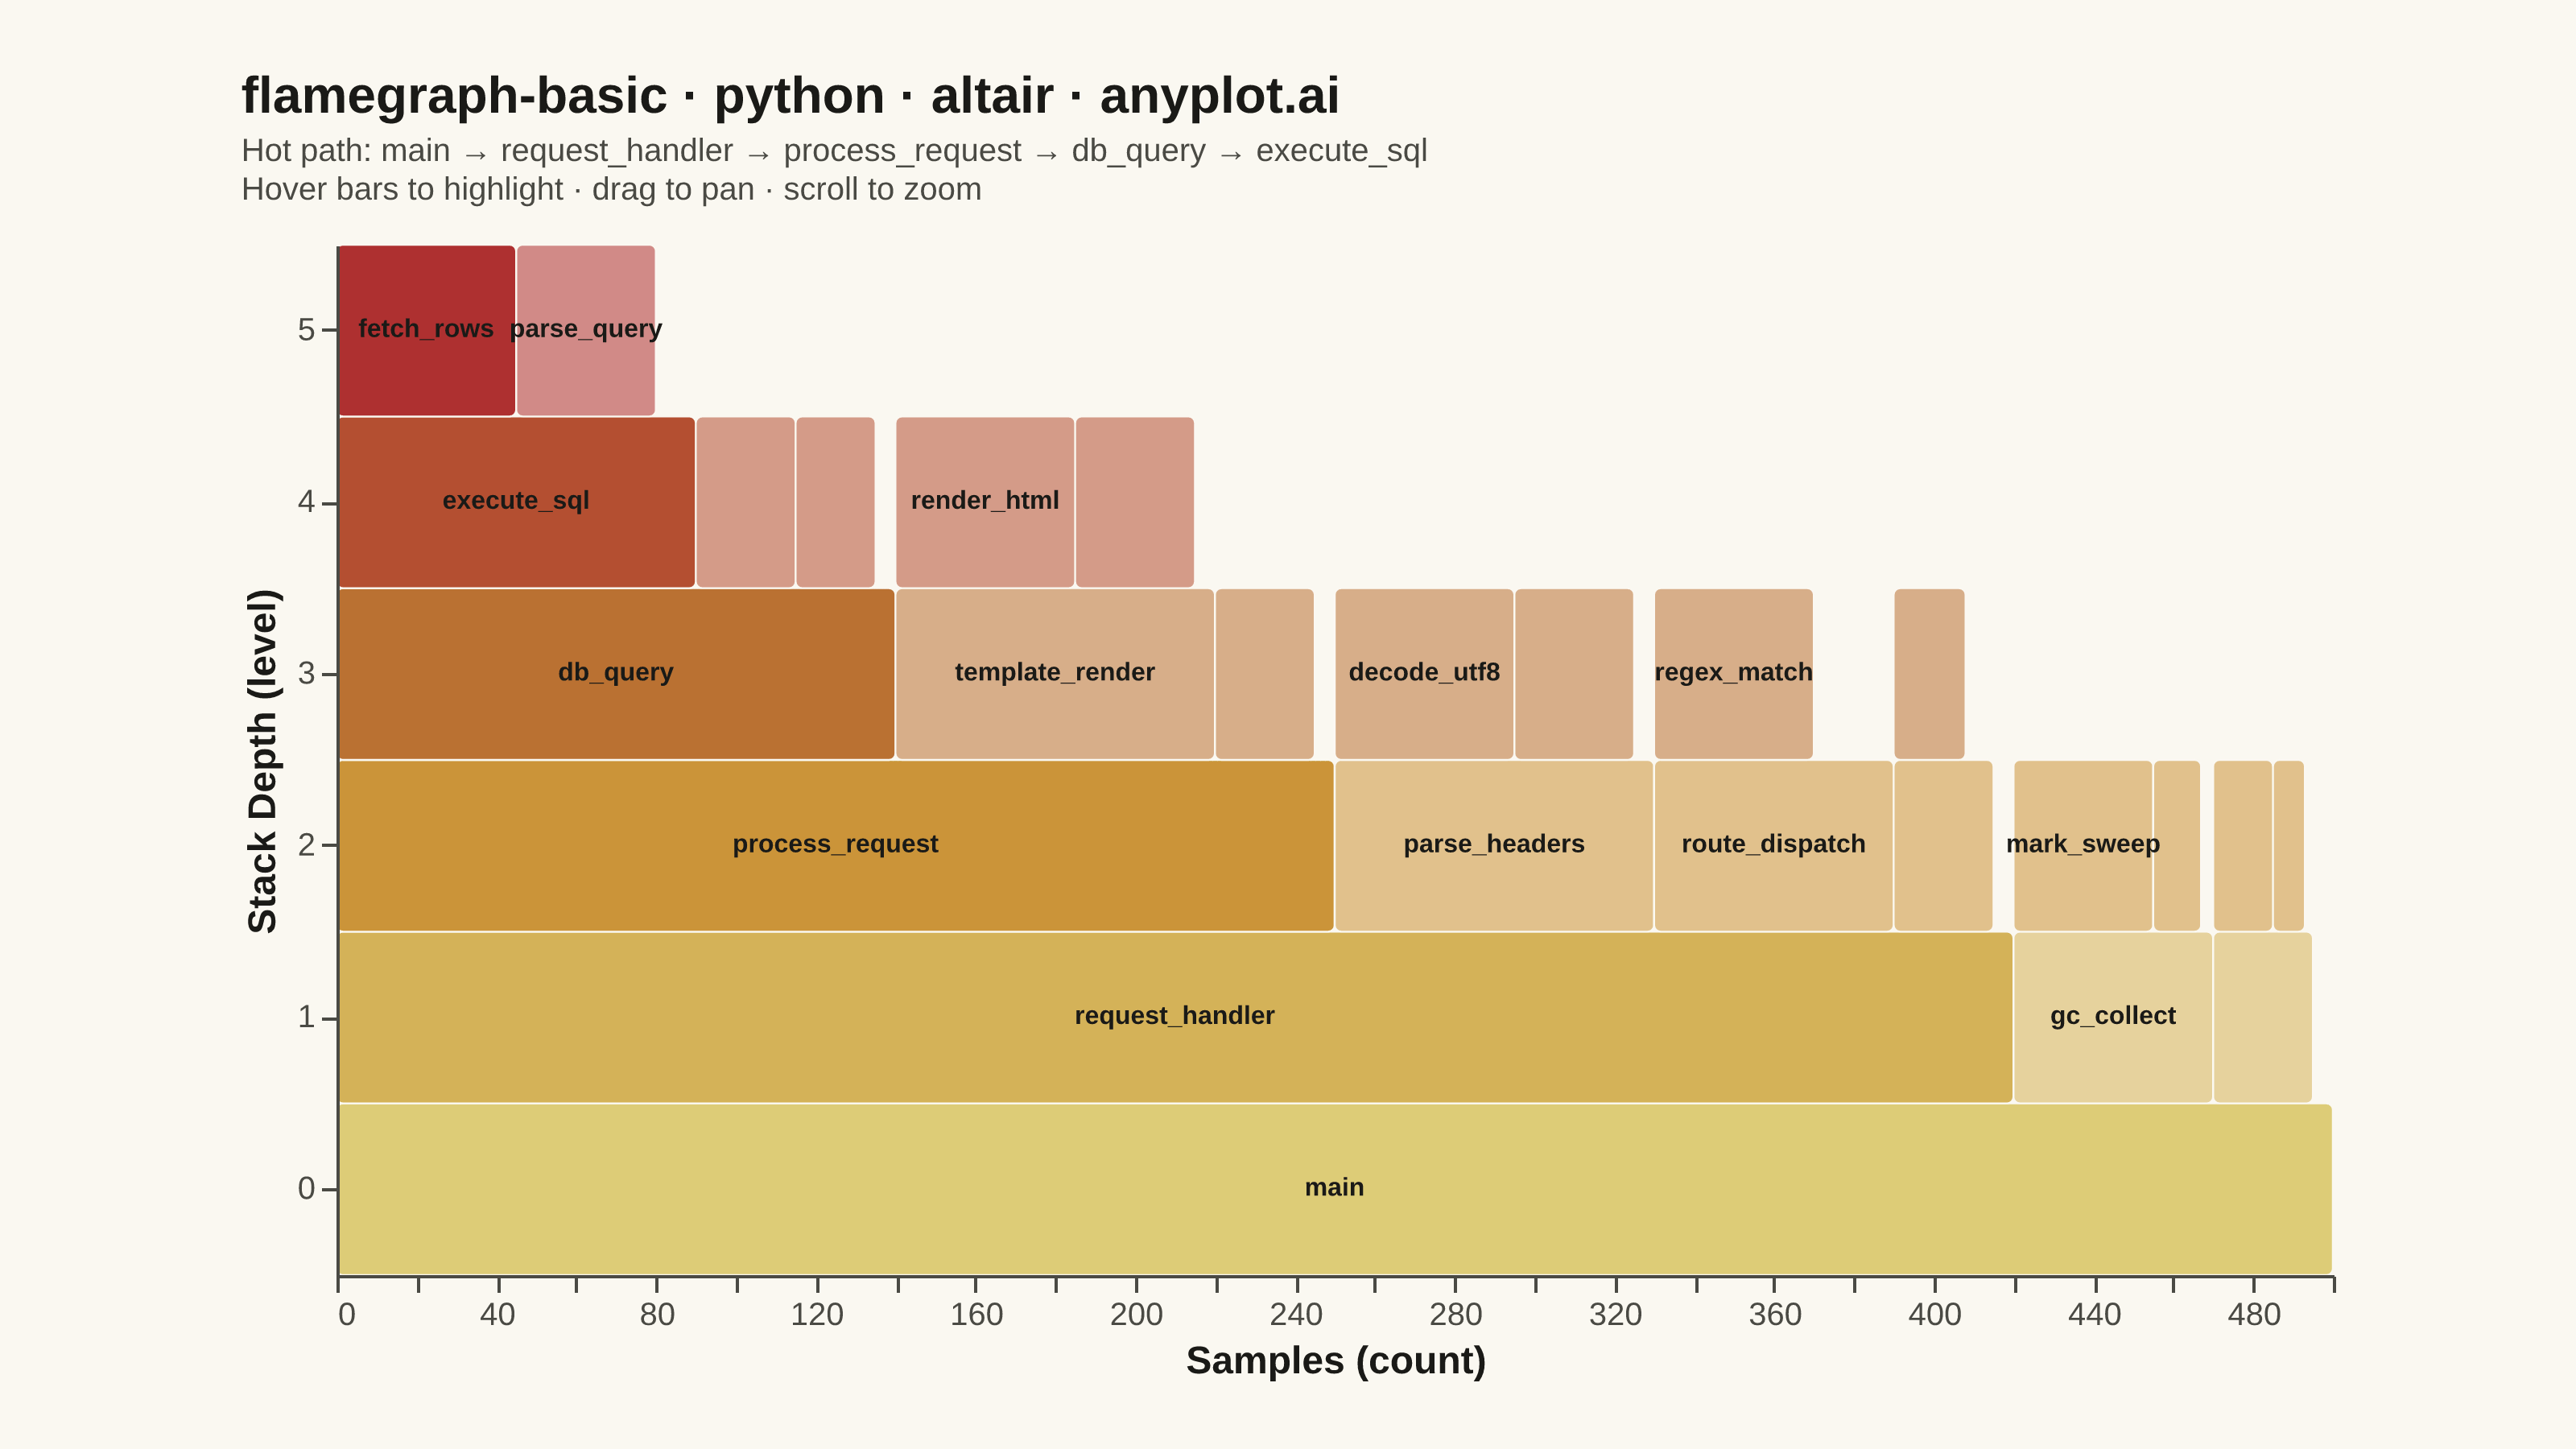
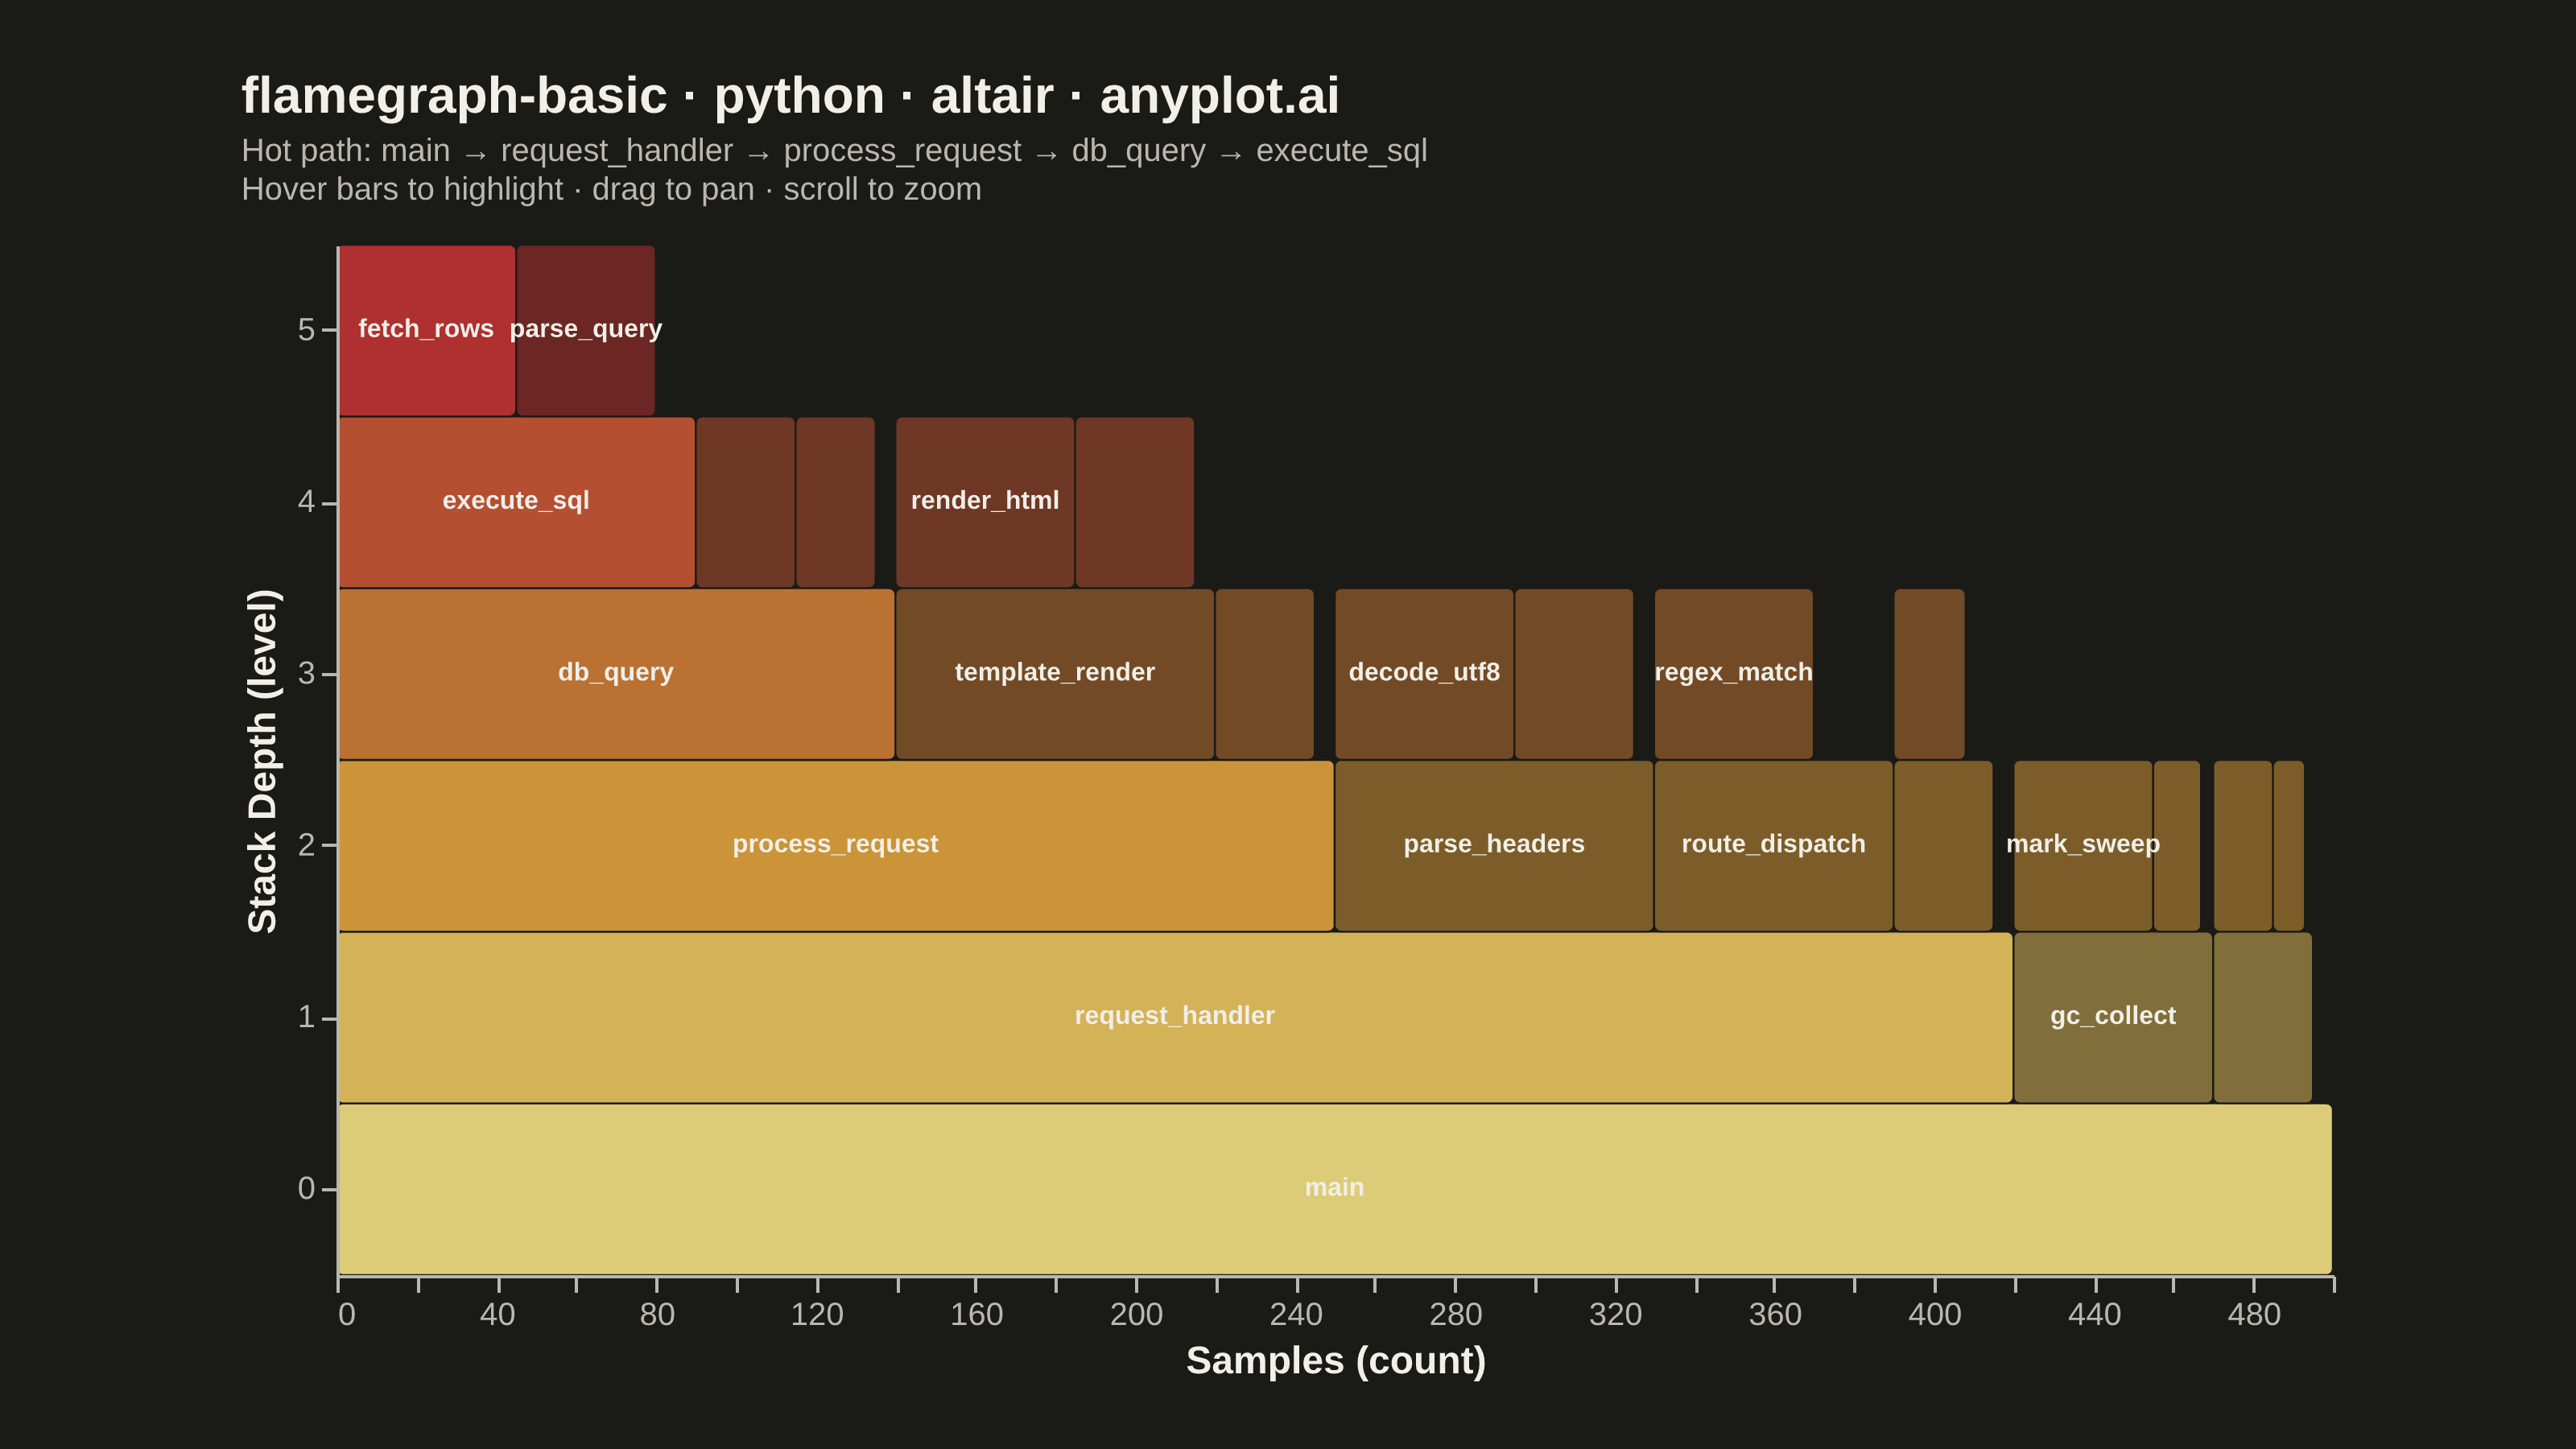
A flame graph visualizes hierarchical call stack data from performance profiling, where each horizontal bar represents a function in the call stack and its width is proportional to the time (or samples) spent in that function. Stacks are layered bottom-to-top showing caller-to-callee relationships. Invented by Brendan Gregg, flame graphs are the standard visualization for identifying CPU bottlenecks and hot code paths across all major programming languages and profiling tools.
""" anyplot.ai
flamegraph-basic: Flame Graph for Performance Profiling
Library: altair 6.2.1 | Python 3.13.13
Quality: 91/100 | Updated: 2026-06-08
"""

import os

import altair as alt
import pandas as pd
from PIL import Image


# Theme tokens (see prompts/default-style-guide.md "Theme-adaptive Chrome")
THEME = os.getenv("ANYPLOT_THEME", "light")
PAGE_BG = "#FAF8F1" if THEME == "light" else "#1A1A17"
ELEVATED_BG = "#FFFDF6" if THEME == "light" else "#242420"
INK = "#1A1A17" if THEME == "light" else "#F0EFE8"
INK_SOFT = "#4A4A44" if THEME == "light" else "#B8B7B0"
INK_MUTED = "#6B6A63" if THEME == "light" else "#A8A79F"

# Imprint warm semantic ramp: amber -> ochre -> matte red. Flame graphs carry a
# strong, widely-shared warm-palette convention; the spec calls it out directly,
# so this is a semantic exception ("Semantic exception" in the style guide).
# All three stops are Imprint members (amber anchor + ochre + matte-red).
WARM_STOPS = ["#DDCC77", "#BD8233", "#AE3030"]

# Data — simulated CPU profiling samples from a Python web request handler.
stacks = {
    "main": 500,
    "main;request_handler": 420,
    "main;request_handler;parse_headers": 80,
    "main;request_handler;parse_headers;decode_utf8": 45,
    "main;request_handler;parse_headers;validate_fields": 30,
    "main;request_handler;route_dispatch": 60,
    "main;request_handler;route_dispatch;regex_match": 40,
    "main;request_handler;process_request": 250,
    "main;request_handler;process_request;db_query": 140,
    "main;request_handler;process_request;db_query;connect_pool": 25,
    "main;request_handler;process_request;db_query;execute_sql": 90,
    "main;request_handler;process_request;db_query;execute_sql;parse_query": 35,
    "main;request_handler;process_request;db_query;execute_sql;fetch_rows": 45,
    "main;request_handler;process_request;db_query;serialize": 20,
    "main;request_handler;process_request;template_render": 80,
    "main;request_handler;process_request;template_render;compile_template": 30,
    "main;request_handler;process_request;template_render;render_html": 45,
    "main;request_handler;process_request;json_encode": 25,
    "main;request_handler;send_response": 25,
    "main;request_handler;send_response;compress_gzip": 18,
    "main;gc_collect": 50,
    "main;gc_collect;mark_sweep": 35,
    "main;gc_collect;compact_heap": 12,
    "main;logger": 25,
    "main;logger;format_message": 15,
    "main;logger;write_file": 8,
}

total_samples = stacks["main"]

# Pack each frame into an x-span: parent defines the range, children fill it
# left-to-right sorted widest-first. Standard icicle/flamegraph layout.
positions = {"main": (0, total_samples)}
records = []
stacks_by_depth = {}
for stack_path, value in stacks.items():
    stacks_by_depth.setdefault(stack_path.count(";"), []).append((stack_path, value))

for depth in sorted(stacks_by_depth):
    if depth == 0:
        for stack_path, value in stacks_by_depth[depth]:
            positions[stack_path] = (0, value)
            records.append(
                {
                    "x": 0,
                    "x2": value,
                    "depth": depth,
                    "function": stack_path.split(";")[-1],
                    "samples": value,
                    "stack": stack_path,
                    "width": value,
                }
            )
        continue
    parent_children = {}
    for stack_path, value in stacks_by_depth[depth]:
        parent = ";".join(stack_path.split(";")[:-1])
        parent_children.setdefault(parent, []).append((stack_path, value))
    for parent, children in parent_children.items():
        if parent not in positions:
            continue
        parent_x, _ = positions[parent]
        children.sort(key=lambda c: c[1], reverse=True)
        current_x = parent_x
        for stack_path, value in children:
            positions[stack_path] = (current_x, current_x + value)
            records.append(
                {
                    "x": current_x,
                    "x2": current_x + value,
                    "depth": depth,
                    "function": stack_path.split(";")[-1],
                    "samples": value,
                    "stack": stack_path,
                    "width": value,
                }
            )
            current_x += value

df = pd.DataFrame(records)
df["pct"] = (df["samples"] / total_samples * 100).round(1)
max_depth = int(df["depth"].max())

# Trace the dominant call path (widest descendant at each depth) for emphasis.
hot_path = {"main"}
current = "main"
for d in range(1, max_depth + 1):
    children = df[(df["depth"] == d) & (df["stack"].str.startswith(current + ";"))]
    if children.empty:
        break
    current = children.loc[children["samples"].idxmax(), "stack"]
    hot_path.add(current)

df["is_hot"] = df["stack"].isin(hot_path)
df["opacity_val"] = df["is_hot"].map({True: 1.0, False: 0.55})

# Plot
TITLE = "flamegraph-basic · python · altair · anyplot.ai"
ratio = 67 / len(TITLE) if len(TITLE) > 67 else 1.0
TITLE_PX = max(11, round(16 * ratio))

alt.data_transformers.disable_max_rows()

hover = alt.selection_point(on="pointerover", fields=["stack"], empty=False, clear="pointerout")

base = alt.Chart(df).transform_calculate(
    mid="(datum.x + datum.x2) / 2", label=f"datum.width / {total_samples} > 0.06 ? datum.function : ''"
)

bars = base.mark_rect(stroke=PAGE_BG, strokeWidth=0.6, cornerRadius=2).encode(
    x=alt.X("x:Q", title="Samples (count)", scale=alt.Scale(domain=[0, total_samples], nice=False)),
    x2="x2:Q",
    y=alt.Y("depth:O", title="Stack Depth (level)", sort="descending"),
    color=alt.Color(
        "depth:Q", scale=alt.Scale(domain=[0, max_depth], range=WARM_STOPS, interpolate="hsl"), legend=None
    ),
    opacity=alt.Opacity("opacity_val:Q", legend=None, scale=alt.Scale(domain=[0.55, 1.0], range=[0.55, 1.0])),
    tooltip=[
        alt.Tooltip("function:N", title="Function"),
        alt.Tooltip("samples:Q", title="Samples"),
        alt.Tooltip("pct:Q", title="% Total", format=".1f"),
        alt.Tooltip("stack:N", title="Stack"),
    ],
)

# Hover overlay: thick ink-coloured outline that lights up only the bar under
# the pointer. Distinctive Altair pattern — declarative selection + condition.
highlight = (
    base.mark_rect(stroke=INK, strokeWidth=2.5, fill="transparent", cornerRadius=2)
    .encode(
        x="x:Q",
        x2="x2:Q",
        y=alt.Y("depth:O", sort="descending"),
        opacity=alt.condition(hover, alt.value(1.0), alt.value(0.0)),
    )
    .add_params(hover)
)

labels = base.mark_text(fontSize=8, color=INK, fontWeight="bold", align="center", baseline="middle").encode(
    x="mid:Q", y=alt.Y("depth:O", sort="descending"), text="label:N"
)

chart = (
    (bars + highlight + labels)
    .interactive()
    .properties(
        width=620,
        height=320,
        background=PAGE_BG,
        padding={"left": 16, "right": 16, "top": 16, "bottom": 16},
        title=alt.Title(
            TITLE,
            subtitle=[
                "Hot path: main → request_handler → process_request → db_query → execute_sql",
                "Hover bars to highlight · drag to pan · scroll to zoom",
            ],
            fontSize=TITLE_PX,
            subtitleFontSize=10,
            color=INK,
            subtitleColor=INK_SOFT,
            anchor="start",
            offset=12,
            subtitlePadding=4,
        ),
    )
    .configure_view(fill=PAGE_BG, stroke=None)
    .configure_axis(
        grid=False,
        domainColor=INK_SOFT,
        tickColor=INK_SOFT,
        labelColor=INK_SOFT,
        titleColor=INK,
        labelFontSize=10,
        titleFontSize=12,
    )
    .configure_legend(
        fillColor=ELEVATED_BG,
        strokeColor=INK_SOFT,
        labelColor=INK_SOFT,
        titleColor=INK,
        labelFontSize=10,
        titleFontSize=10,
    )
)

# Save PNG, then PAD (never crop) to the canonical 3200×1800 canvas.
chart.save(f"plot-{THEME}.png", scale_factor=4.0)

TW, TH = 3200, 1800
_img = Image.open(f"plot-{THEME}.png").convert("RGB")
_w, _h = _img.size
if _w > TW or _h > TH:
    raise SystemExit(
        f"altair vl-convert produced {_w}x{_h}, exceeds target {TW}x{TH}. "
        f"Shrink chart .properties(width=, height=) values and re-render."
    )
if _w < TW or _h < TH:
    _canvas = Image.new("RGB", (TW, TH), PAGE_BG)
    _canvas.paste(_img, ((TW - _w) // 2, (TH - _h) // 2))
    _canvas.save(f"plot-{THEME}.png")

chart.save(f"plot-{THEME}.html")
Runnable source as JSON, for any HTTP client: https://api.anyplot.ai/specs/flamegraph-basic/altair/code. Any spec id and library id listed in llms-full.txt fit the same URL shape; every URL below is complete and callable.
{
  "spec_id": "flamegraph-basic",
  "language": "python",
  "library": "altair",
  "page": "https://anyplot.ai/flamegraph-basic/python/altair",
  "hub": "https://anyplot.ai/flamegraph-basic",
  "code_json": "https://api.anyplot.ai/specs/flamegraph-basic/altair/code",
  "spec_json": "https://api.anyplot.ai/specs/flamegraph-basic",
  "render_light_png": "https://storage.googleapis.com/anyplot-images/plots/flamegraph-basic/python/altair/plot-light.png",
  "render_dark_png": "https://storage.googleapis.com/anyplot-images/plots/flamegraph-basic/python/altair/plot-dark.png",
  "interactive_light_html": "https://storage.googleapis.com/anyplot-images/plots/flamegraph-basic/python/altair/plot-light.html",
  "interactive_dark_html": "https://storage.googleapis.com/anyplot-images/plots/flamegraph-basic/python/altair/plot-dark.html",
  "quality_score": 91.0,
  "license": "MIT",
  "guide": "https://anyplot.ai/llms.txt"
}
Part of Flame Graph for Performance Profiling on anyplot.ai.