The same plot in 14 other libraries — JavaScript: D3.js, Apache ECharts, Highcharts, MUI X Charts; Python: Altair, Bokeh, lets-plot, Matplotlib, Plotly, plotnine, Pygal, Seaborn; R: ggplot2; Julia: Makie.jl. Compare all 15 side by side: Hexagonal Binning Map in Python, R, Julia and JavaScript.
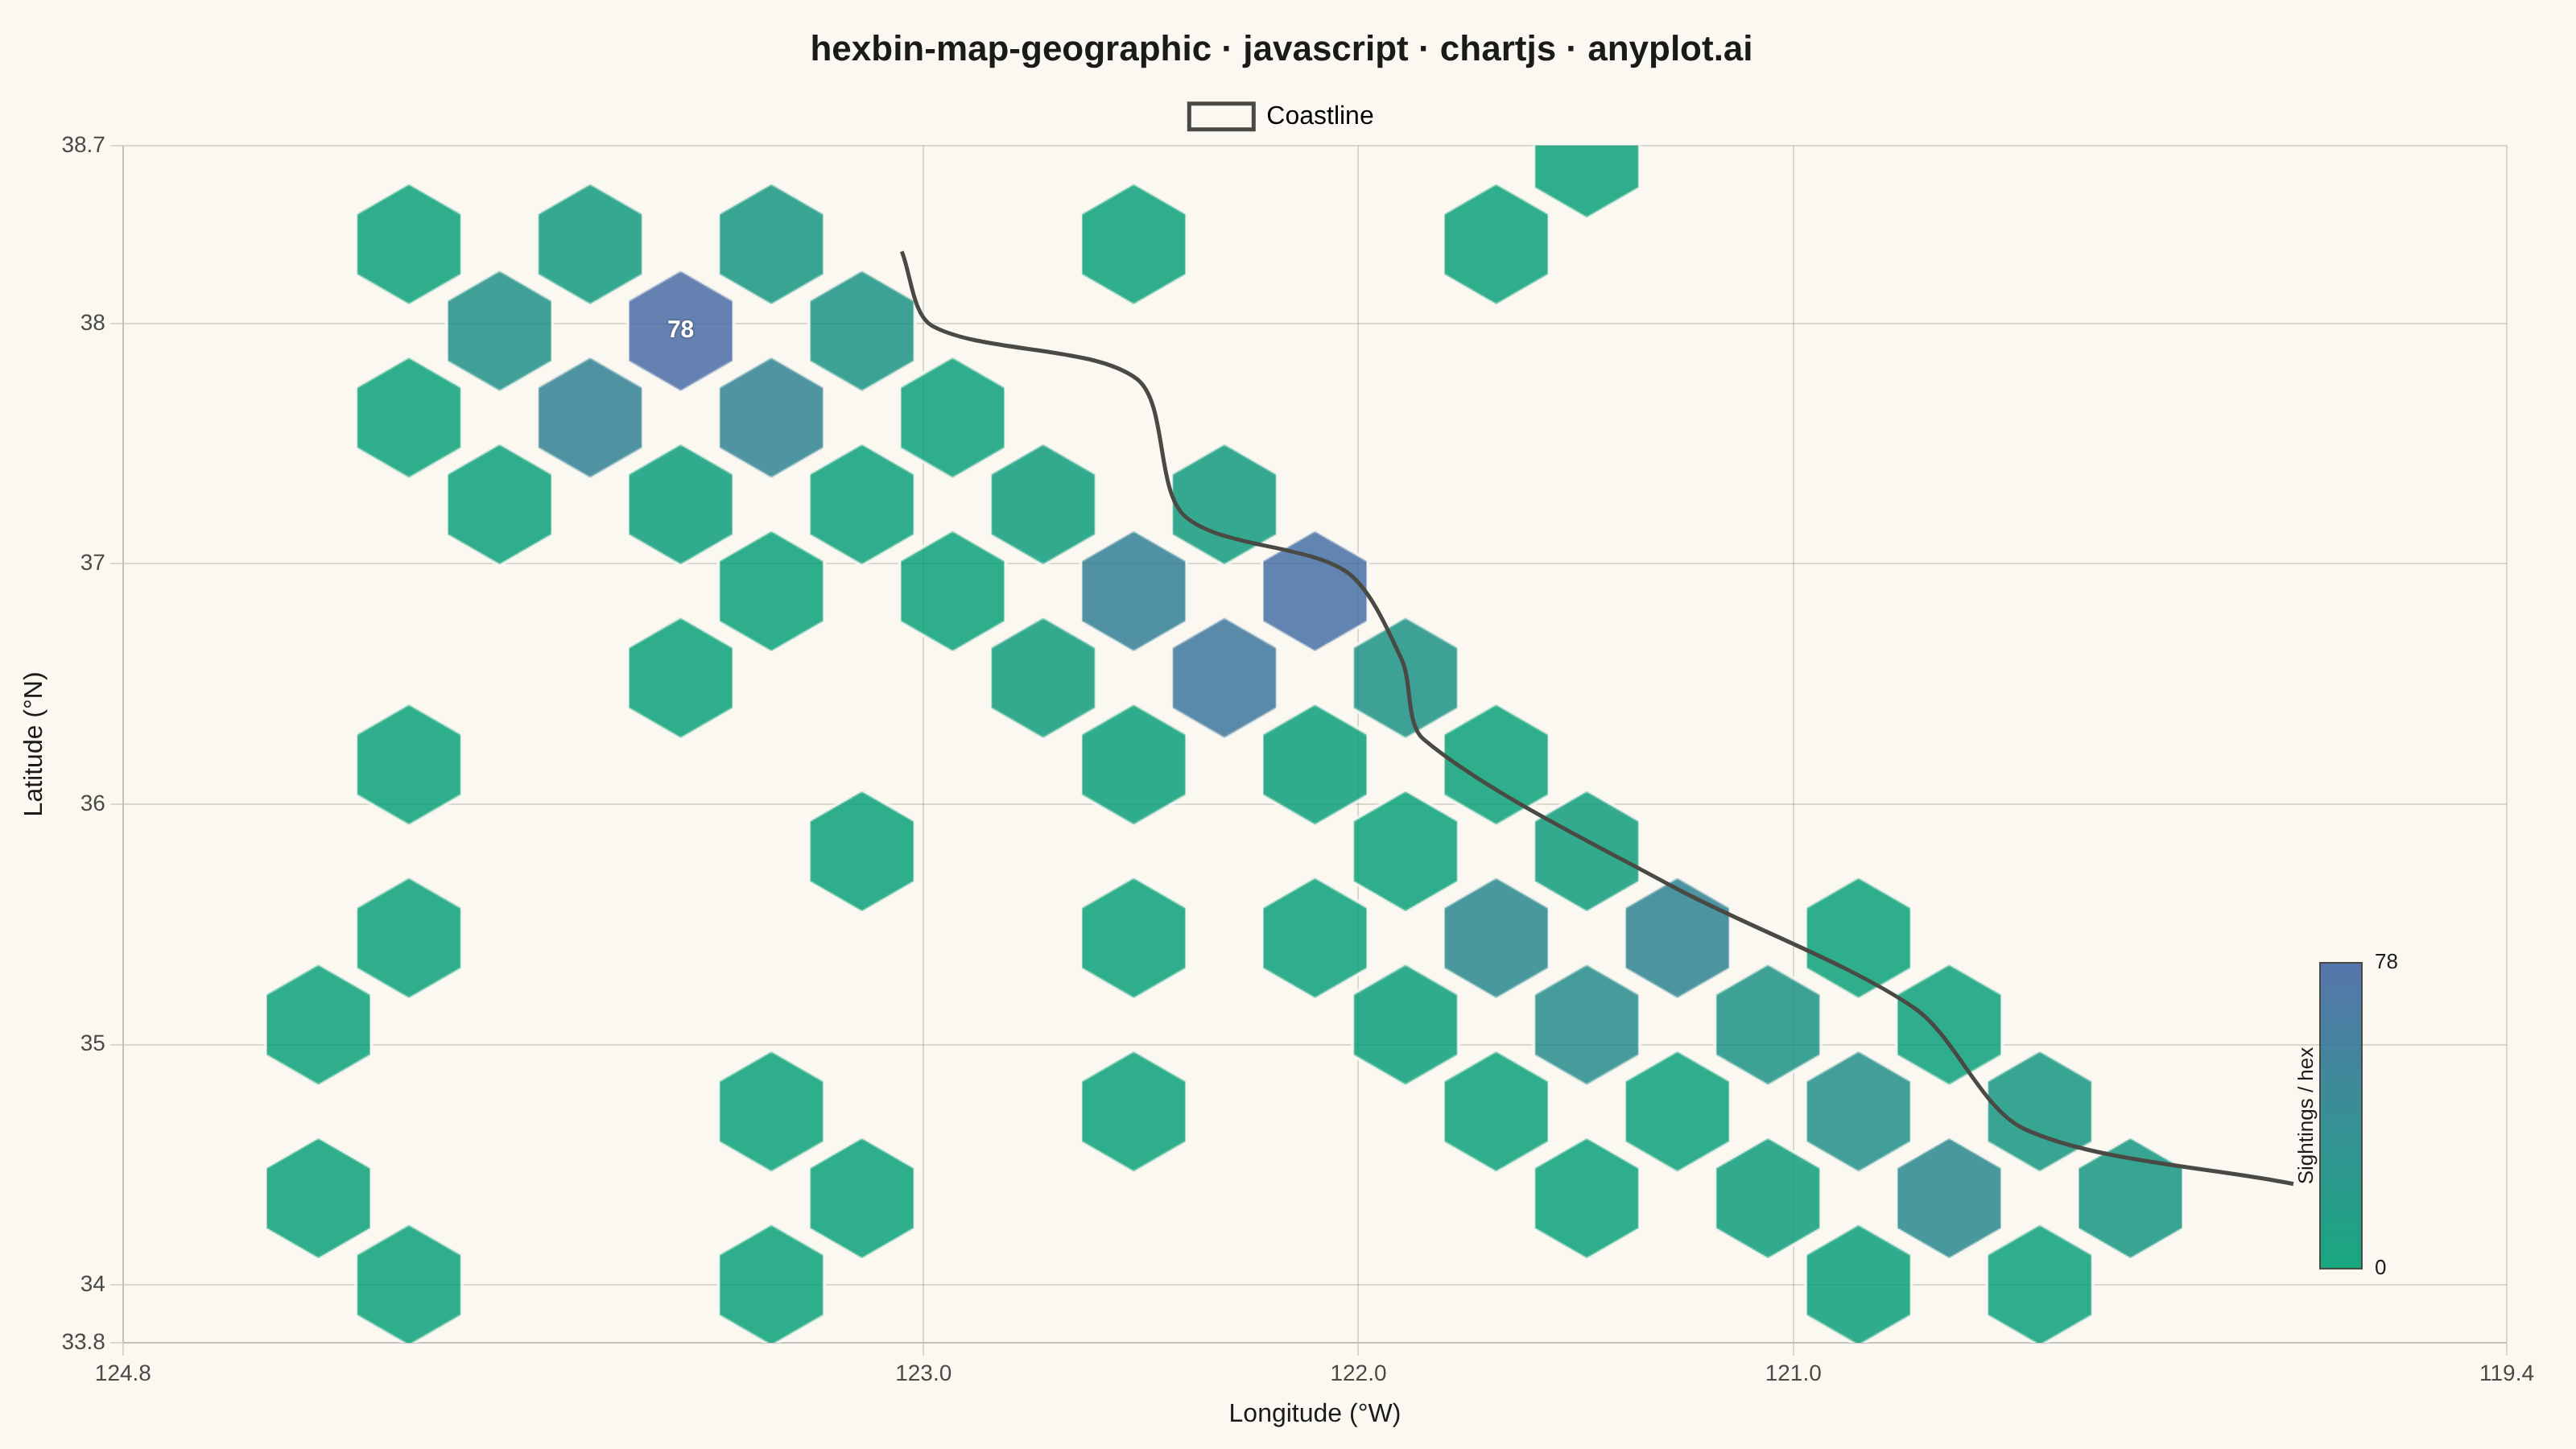
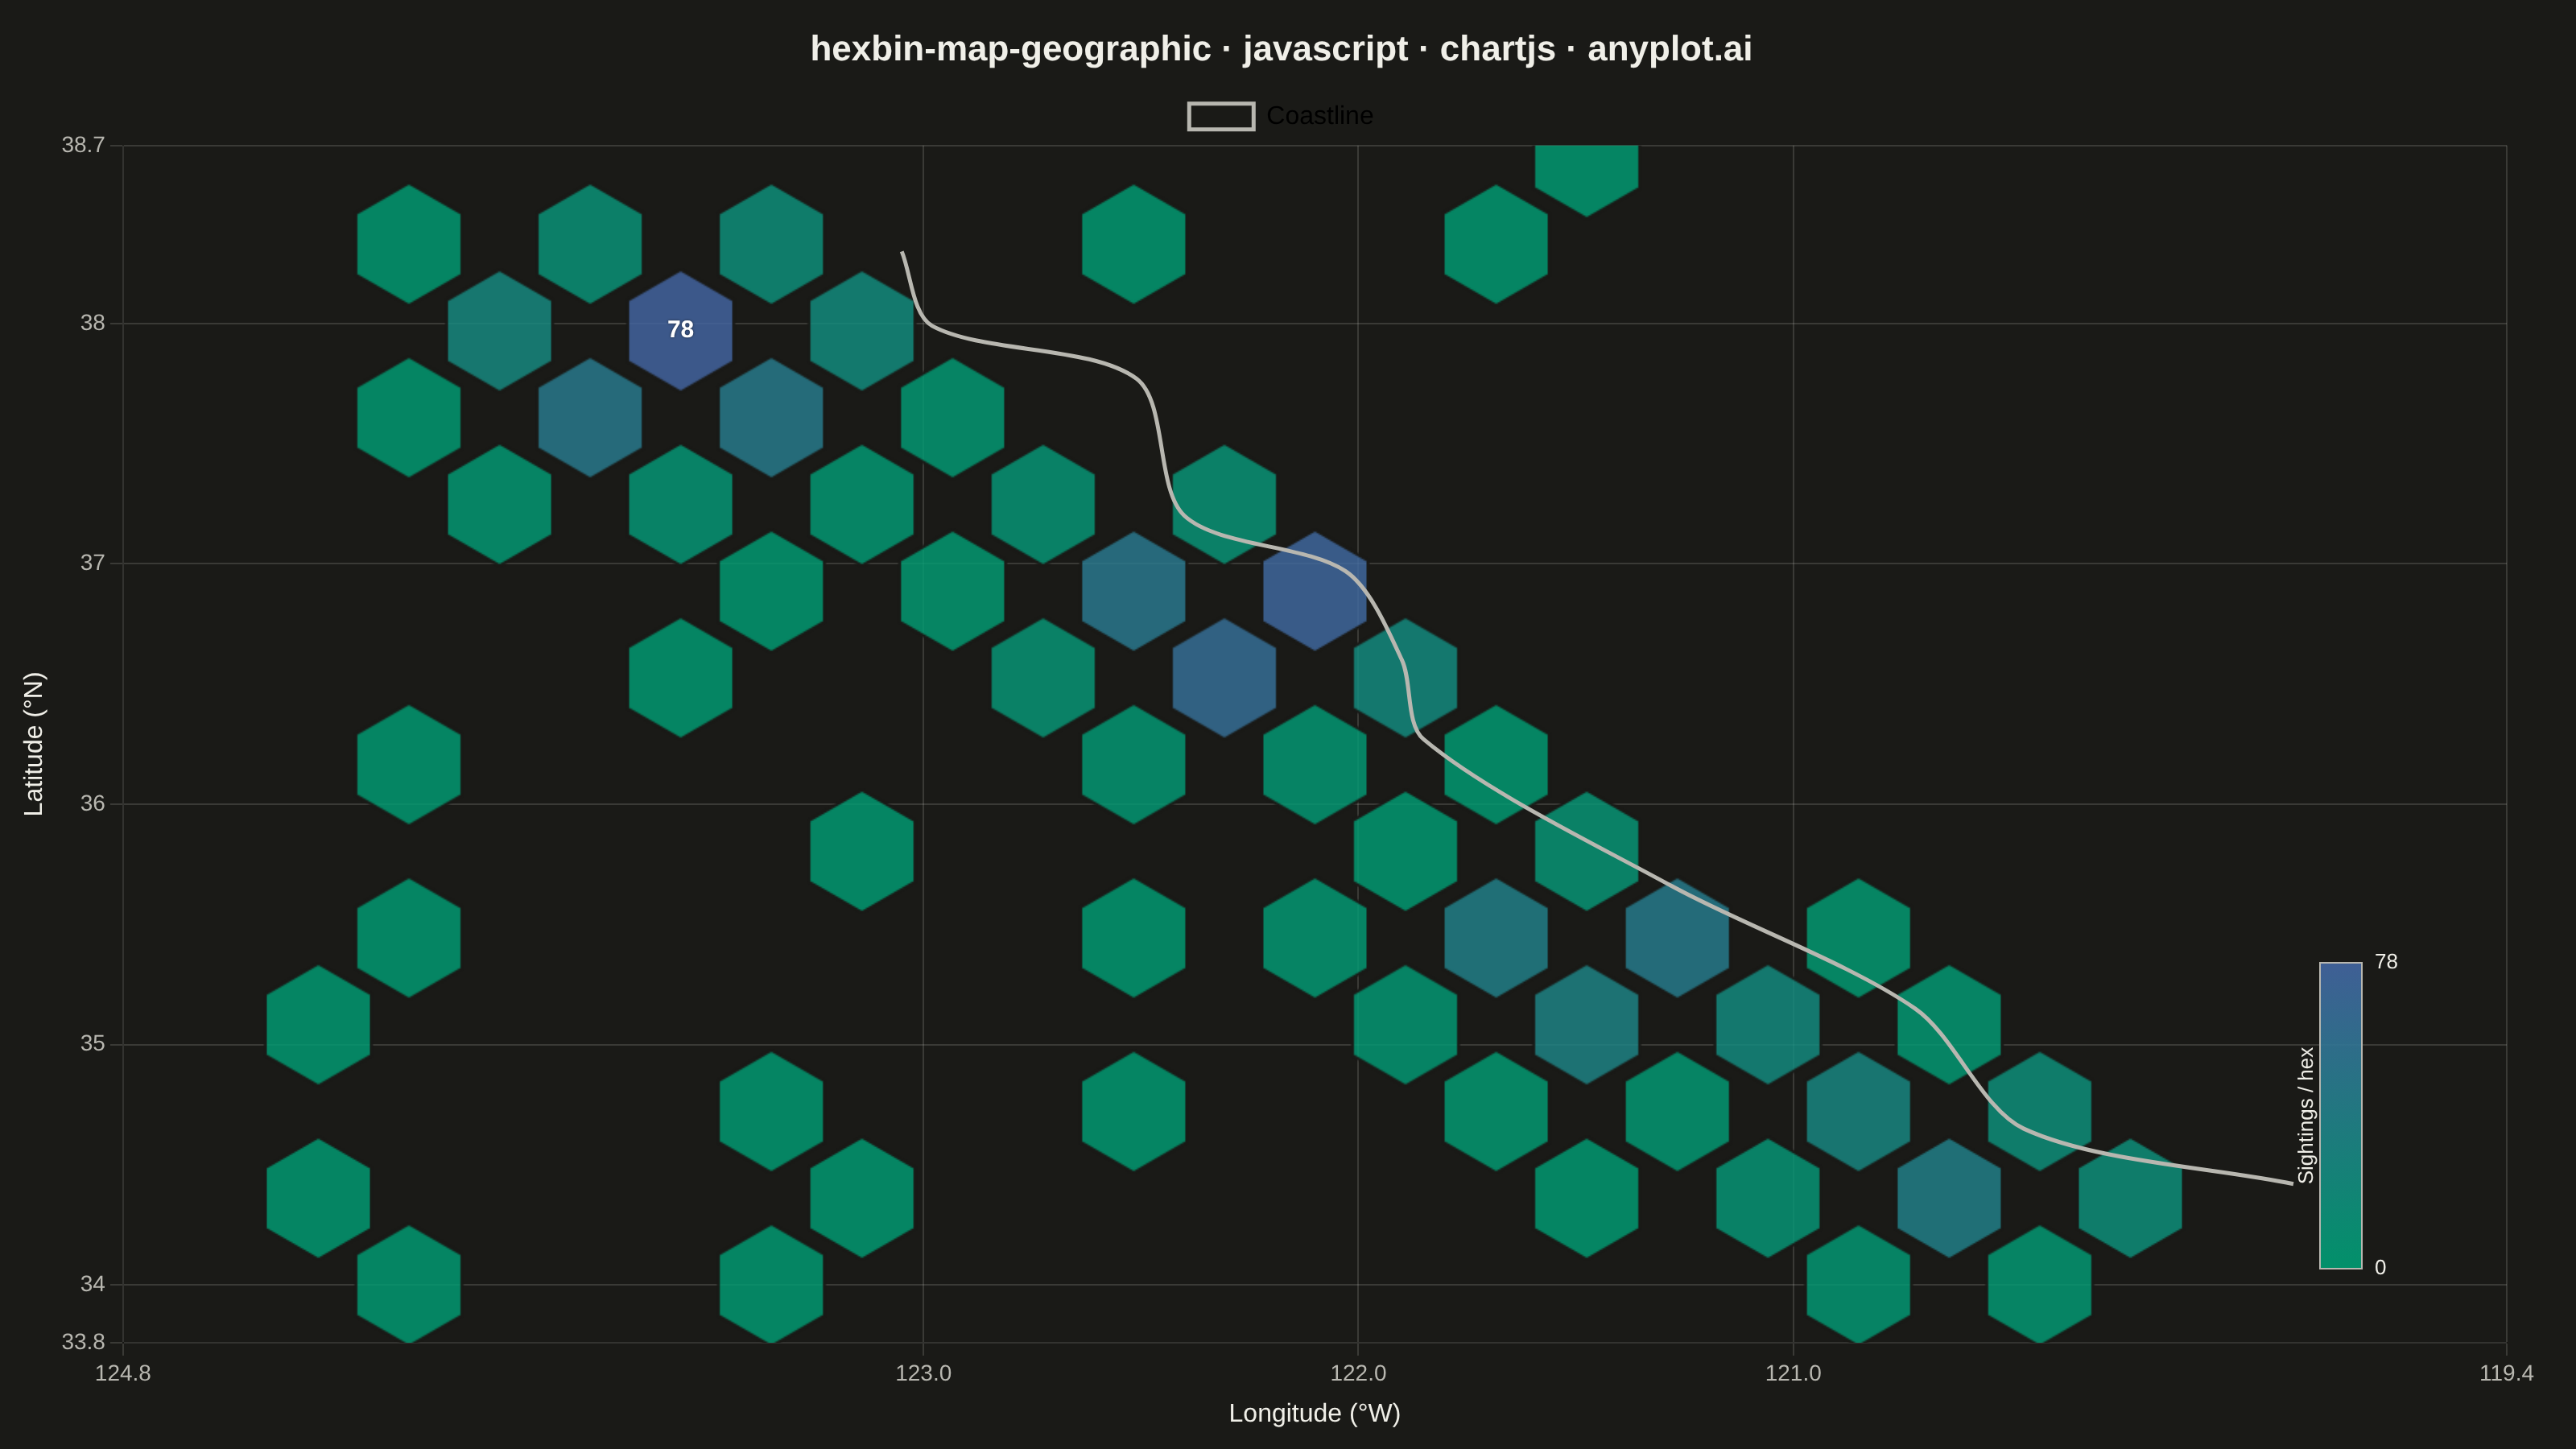
A geographic map visualization that aggregates point data into hexagonal cells, displaying density or aggregated values per cell using color intensity. Unlike continuous heatmaps that use kernel density estimation, hexbin maps provide discrete binning that clearly shows data aggregation boundaries. The hexagonal grid is superior to square grids due to isotropy (equal distance to neighboring cells) and better visual continuity, making it ideal for spatial statistics and urban data analysis.
// anyplot.ai
// hexbin-map-geographic: Hexagonal Binning Map
// Library: chartjs 4.4.7 | JavaScript 22.23.2
// Quality: 92/100 | Created: 2026-08-25

const t = window.ANYPLOT_TOKENS;

// --- Deterministic PRNG (fixed-seed LCG + Box-Muller) -----------------------
function makeLcg(seed) {
  let state = seed >>> 0;
  return function lcg() {
    state = (Math.imul(state, 1664525) + 1013904223) >>> 0;
    return state / 4294967296;
  };
}
const rand = makeLcg(42);
function gaussian(mean, std) {
  const u1 = Math.max(rand(), 1e-9);
  const u2 = rand();
  const z = Math.sqrt(-2 * Math.log(u1)) * Math.cos(2 * Math.PI * u2);
  return mean + z * std;
}

// --- Geography: bounding box + simplified Central California coastline -----
const LAT_MIN = 34.0;
const LAT_MAX = 38.5;
const LON_MIN = -124.6;
const LON_MAX = -119.6;

// [lat, lon] north -> south, deliberately simplified for map context (not navigational)
const COASTLINE = [
  [38.3, -123.05],
  [37.99, -122.98],
  [37.77, -122.51],
  [37.2, -122.4],
  [36.97, -122.03],
  [36.6, -121.9],
  [36.27, -121.85],
  [35.66, -121.28],
  [35.15, -120.72],
  [34.65, -120.47],
  [34.42, -119.85],
];

function coastLonAtLat(lat) {
  for (let i = 0; i < COASTLINE.length - 1; i++) {
    const [latA, lonA] = COASTLINE[i];
    const [latB, lonB] = COASTLINE[i + 1];
    if (lat <= latA && lat >= latB) {
      const f = (latA - lat) / (latA - latB);
      return lonA + (lonB - lonA) * f;
    }
  }
  return COASTLINE[COASTLINE.length - 1][1];
}

// --- Sightings: gray whale pods offshore, clustered near known feeding grounds
const HOTSPOTS = [
  { lat: 37.85, lon: -123.55, weight: 260 }, // Cordell Bank / Farallones
  { lat: 36.78, lon: -122.25, weight: 300 }, // Monterey Bay submarine canyon
  { lat: 35.35, lon: -121.35, weight: 190 }, // offshore Big Sur / Cambria
  { lat: 34.55, lon: -120.55, weight: 160 }, // Point Conception approach
];
const BACKGROUND_COUNT = 45;

const sightings = [];
for (const spot of HOTSPOTS) {
  for (let i = 0; i < spot.weight; i++) {
    sightings.push({ lat: gaussian(spot.lat, 0.24), lon: gaussian(spot.lon, 0.24) });
  }
}
for (let i = 0; i < BACKGROUND_COUNT; i++) {
  sightings.push({
    lat: LAT_MIN + rand() * (LAT_MAX - LAT_MIN),
    lon: LON_MIN + rand() * (LON_MAX - LON_MIN),
  });
}

const oceanSightings = sightings
  .filter((p) => p.lat >= LAT_MIN && p.lat <= LAT_MAX && p.lon >= LON_MIN && p.lon <= LON_MAX)
  .filter((p) => p.lon <= coastLonAtLat(p.lat) - 0.05)
  .map((p) => ({ ...p, pod: 1 + Math.floor(rand() * 6) })); // individuals per sighting

// --- Hexagonal binning (pointy-top axial grid) ------------------------------
const HEX_COLUMNS = 12;
const HEX_SIZE = (LON_MAX - LON_MIN) / (HEX_COLUMNS * Math.sqrt(3)); // circumradius, degrees

function toHex(x, y) {
  const q = ((Math.sqrt(3) / 3) * x - (1 / 3) * y) / HEX_SIZE;
  const r = ((2 / 3) * y) / HEX_SIZE;
  const cy = -q - r;
  let rx = Math.round(q);
  let ry = Math.round(cy);
  let rz = Math.round(r);
  const dx = Math.abs(rx - q);
  const dy = Math.abs(ry - cy);
  const dz = Math.abs(rz - r);
  if (dx > dy && dx > dz) rx = -ry - rz;
  else if (dy > dz) ry = -rx - rz;
  else rz = -rx - ry;
  return { q: rx, r: rz };
}
function hexCenter(q, r) {
  return {
    x: HEX_SIZE * (Math.sqrt(3) * q + (Math.sqrt(3) / 2) * r),
    y: HEX_SIZE * 1.5 * r,
  };
}

const bins = new Map();
for (const s of oceanSightings) {
  const x = s.lon - LON_MIN;
  const y = s.lat - LAT_MIN;
  const { q, r } = toHex(x, y);
  const key = `${q},${r}`;
  if (!bins.has(key)) bins.set(key, { q, r, count: 0, podSum: 0 });
  const bin = bins.get(key);
  bin.count += 1;
  bin.podSum += s.pod;
}

const hexBins = Array.from(bins.values()).map((bin) => {
  const center = hexCenter(bin.q, bin.r);
  return {
    x: center.x + LON_MIN,
    y: center.y + LAT_MIN,
    count: bin.count,
    podSum: bin.podSum,
    podMean: bin.podSum / bin.count,
  };
});

const maxCount = Math.max(...hexBins.map((b) => b.count));

// --- Color: imprint_seq (sequential, single-polarity density) --------------
function hexToRgb(hex) {
  const n = parseInt(hex.slice(1), 16);
  return [(n >> 16) & 255, (n >> 8) & 255, n & 255];
}
function seqColor(ratio, alpha) {
  const [r0, g0, b0] = hexToRgb(t.seq[0]);
  const [r1, g1, b1] = hexToRgb(t.seq[1]);
  const r = Math.round(r0 + (r1 - r0) * ratio);
  const g = Math.round(g0 + (g1 - g0) * ratio);
  const b = Math.round(b0 + (b1 - b0) * ratio);
  return `rgba(${r}, ${g}, ${b}, ${alpha})`;
}

// --- Hexagon marker icons (pointy-top, pre-rendered per bin) ---------------
const ICON_PX = 78;
function hexIcon(color) {
  const iconCanvas = document.createElement("canvas");
  iconCanvas.width = ICON_PX;
  iconCanvas.height = ICON_PX;
  const ctx = iconCanvas.getContext("2d");
  const cx = ICON_PX / 2;
  const cy = ICON_PX / 2;
  const radius = ICON_PX / 2 - 1;
  ctx.beginPath();
  for (let i = 0; i < 6; i++) {
    const angle = (Math.PI / 3) * i - Math.PI / 2;
    const px = cx + radius * Math.cos(angle);
    const py = cy + radius * Math.sin(angle);
    if (i === 0) ctx.moveTo(px, py);
    else ctx.lineTo(px, py);
  }
  ctx.closePath();
  ctx.fillStyle = color;
  ctx.fill();
  ctx.lineWidth = 1.75;
  ctx.strokeStyle = t.pageBg;
  ctx.stroke();
  return iconCanvas;
}

const hexPointStyles = hexBins.map((b) => hexIcon(seqColor(b.count / maxCount, 0.82)));
const peakBin = hexBins.find((b) => b.count === maxCount);

// --- Mount -------------------------------------------------------------------
const canvas = document.createElement("canvas");
document.getElementById("container").appendChild(canvas);

// --- Custom plugin: sequential color-scale legend ---------------------------
const colorbarPlugin = {
  id: "imprintColorbar",
  afterDraw(chart) {
    const { ctx, chartArea } = chart;
    const barW = 26;
    const barH = 190;
    const x = chartArea.right - barW - 90;
    const y = chartArea.bottom - barH - 46;

    ctx.save();
    const gradient = ctx.createLinearGradient(0, y, 0, y + barH);
    gradient.addColorStop(0, seqColor(1, 0.9));
    gradient.addColorStop(1, seqColor(0, 0.9));
    ctx.fillStyle = gradient;
    ctx.fillRect(x, y, barW, barH);
    ctx.strokeStyle = t.inkSoft;
    ctx.lineWidth = 1;
    ctx.strokeRect(x, y, barW, barH);

    ctx.fillStyle = t.ink;
    ctx.font = "13px sans-serif";
    ctx.textAlign = "left";
    ctx.textBaseline = "middle";
    ctx.fillText(String(maxCount), x + barW + 8, y);
    ctx.fillText("0", x + barW + 8, y + barH);

    ctx.save();
    ctx.translate(x - 8, y + barH / 2);
    ctx.rotate(-Math.PI / 2);
    ctx.textAlign = "center";
    ctx.fillText("Sightings / hex", 0, 0);
    ctx.restore();
    ctx.restore();
  },
};

// --- Custom plugin: numeric callout on the single highest-density cell -----
const peakLabelPlugin = {
  id: "peakLabel",
  afterDraw(chart) {
    const { ctx, scales } = chart;
    const px = scales.x.getPixelForValue(peakBin.x);
    const py = scales.y.getPixelForValue(peakBin.y);

    ctx.save();
    ctx.fillStyle = "#FFFFFF";
    ctx.font = "bold 15px sans-serif";
    ctx.textAlign = "center";
    ctx.textBaseline = "middle";
    ctx.shadowColor = "rgba(0, 0, 0, 0.6)";
    ctx.shadowBlur = 3;
    ctx.fillText(String(peakBin.count), px, py);
    ctx.restore();
  },
};

// --- Chart -------------------------------------------------------------------
new Chart(canvas, {
  type: "scatter",
  data: {
    datasets: [
      {
        label: "Coastline",
        type: "line",
        data: COASTLINE.map(([lat, lon]) => ({ x: lon, y: lat })),
        showLine: true,
        borderColor: t.inkSoft,
        borderWidth: 2.5,
        pointRadius: 0,
        tension: 0.3,
        order: 1,
      },
      {
        label: "Sighting density",
        data: hexBins,
        pointStyle: hexPointStyles,
        pointRadius: ICON_PX / 2,
        pointHoverRadius: ICON_PX / 2 + 3,
        order: 2,
      },
    ],
  },
  options: {
    responsive: true,
    maintainAspectRatio: false,
    animation: false,
    layout: { padding: { top: 8, right: 16, bottom: 8, left: 8 } },
    plugins: {
      title: {
        display: true,
        text: "hexbin-map-geographic · javascript · chartjs · anyplot.ai",
        color: t.ink,
        font: { size: 22 },
      },
      legend: {
        labels: {
          color: t.ink,
          font: { size: 16 },
          generateLabels: (chart) => {
            const coastline = chart.data.datasets[0];
            return [
              {
                text: coastline.label,
                strokeStyle: coastline.borderColor,
                lineWidth: coastline.borderWidth,
                fillStyle: "transparent",
                pointStyle: "line",
                datasetIndex: 0,
              },
            ];
          },
        },
      },
      tooltip: {
        callbacks: {
          title: () => "Hex cell",
          label: (ctx) => {
            const d = ctx.raw;
            if (d.count === undefined) {
              return `${d.y.toFixed(2)}°N, ${Math.abs(d.x).toFixed(2)}°W`;
            }
            return [
              `Sightings: ${d.count}`,
              `Individuals (sum): ${d.podSum}`,
              `Pod size (mean): ${d.podMean.toFixed(1)}`,
              `Center: ${d.y.toFixed(2)}°N, ${Math.abs(d.x).toFixed(2)}°W`,
            ];
          },
        },
      },
    },
    scales: {
      x: {
        min: LON_MIN - HEX_SIZE,
        max: LON_MAX + HEX_SIZE,
        title: { display: true, text: "Longitude (°W)", color: t.ink, font: { size: 16 } },
        ticks: { color: t.inkSoft, font: { size: 14 }, callback: (v) => Math.abs(v).toFixed(1) },
        grid: { color: t.grid },
      },
      y: {
        min: LAT_MIN - HEX_SIZE,
        max: LAT_MAX + HEX_SIZE,
        title: { display: true, text: "Latitude (°N)", color: t.ink, font: { size: 16 } },
        ticks: { color: t.inkSoft, font: { size: 14 } },
        grid: { color: t.grid },
      },
    },
  },
  plugins: [colorbarPlugin, peakLabelPlugin],
});
Runnable source as JSON, for any HTTP client: https://api.anyplot.ai/specs/hexbin-map-geographic/chartjs/code. Any spec id and library id listed in llms-full.txt fit the same URL shape; every URL below is complete and callable.
{
  "spec_id": "hexbin-map-geographic",
  "language": "javascript",
  "library": "chartjs",
  "page": "https://anyplot.ai/hexbin-map-geographic/javascript/chartjs",
  "hub": "https://anyplot.ai/hexbin-map-geographic",
  "code_json": "https://api.anyplot.ai/specs/hexbin-map-geographic/chartjs/code",
  "spec_json": "https://api.anyplot.ai/specs/hexbin-map-geographic",
  "render_light_png": "https://storage.googleapis.com/anyplot-images/plots/hexbin-map-geographic/javascript/chartjs/plot-light.png",
  "render_dark_png": "https://storage.googleapis.com/anyplot-images/plots/hexbin-map-geographic/javascript/chartjs/plot-dark.png",
  "interactive_light_html": "https://storage.googleapis.com/anyplot-images/plots/hexbin-map-geographic/javascript/chartjs/plot-light.html",
  "interactive_dark_html": "https://storage.googleapis.com/anyplot-images/plots/hexbin-map-geographic/javascript/chartjs/plot-dark.html",
  "quality_score": 92.0,
  "license": "MIT",
  "guide": "https://anyplot.ai/llms.txt"
}
Part of Hexagonal Binning Map on anyplot.ai.