The same plot in 14 other libraries — JavaScript: Chart.js, D3.js, Apache ECharts, MUI X Charts; Python: Altair, Bokeh, lets-plot, Matplotlib, Plotly, plotnine, Pygal, Seaborn; R: ggplot2; Julia: Makie.jl. Compare all 15 side by side: Hexagonal Binning Map in Python, R, Julia and JavaScript.
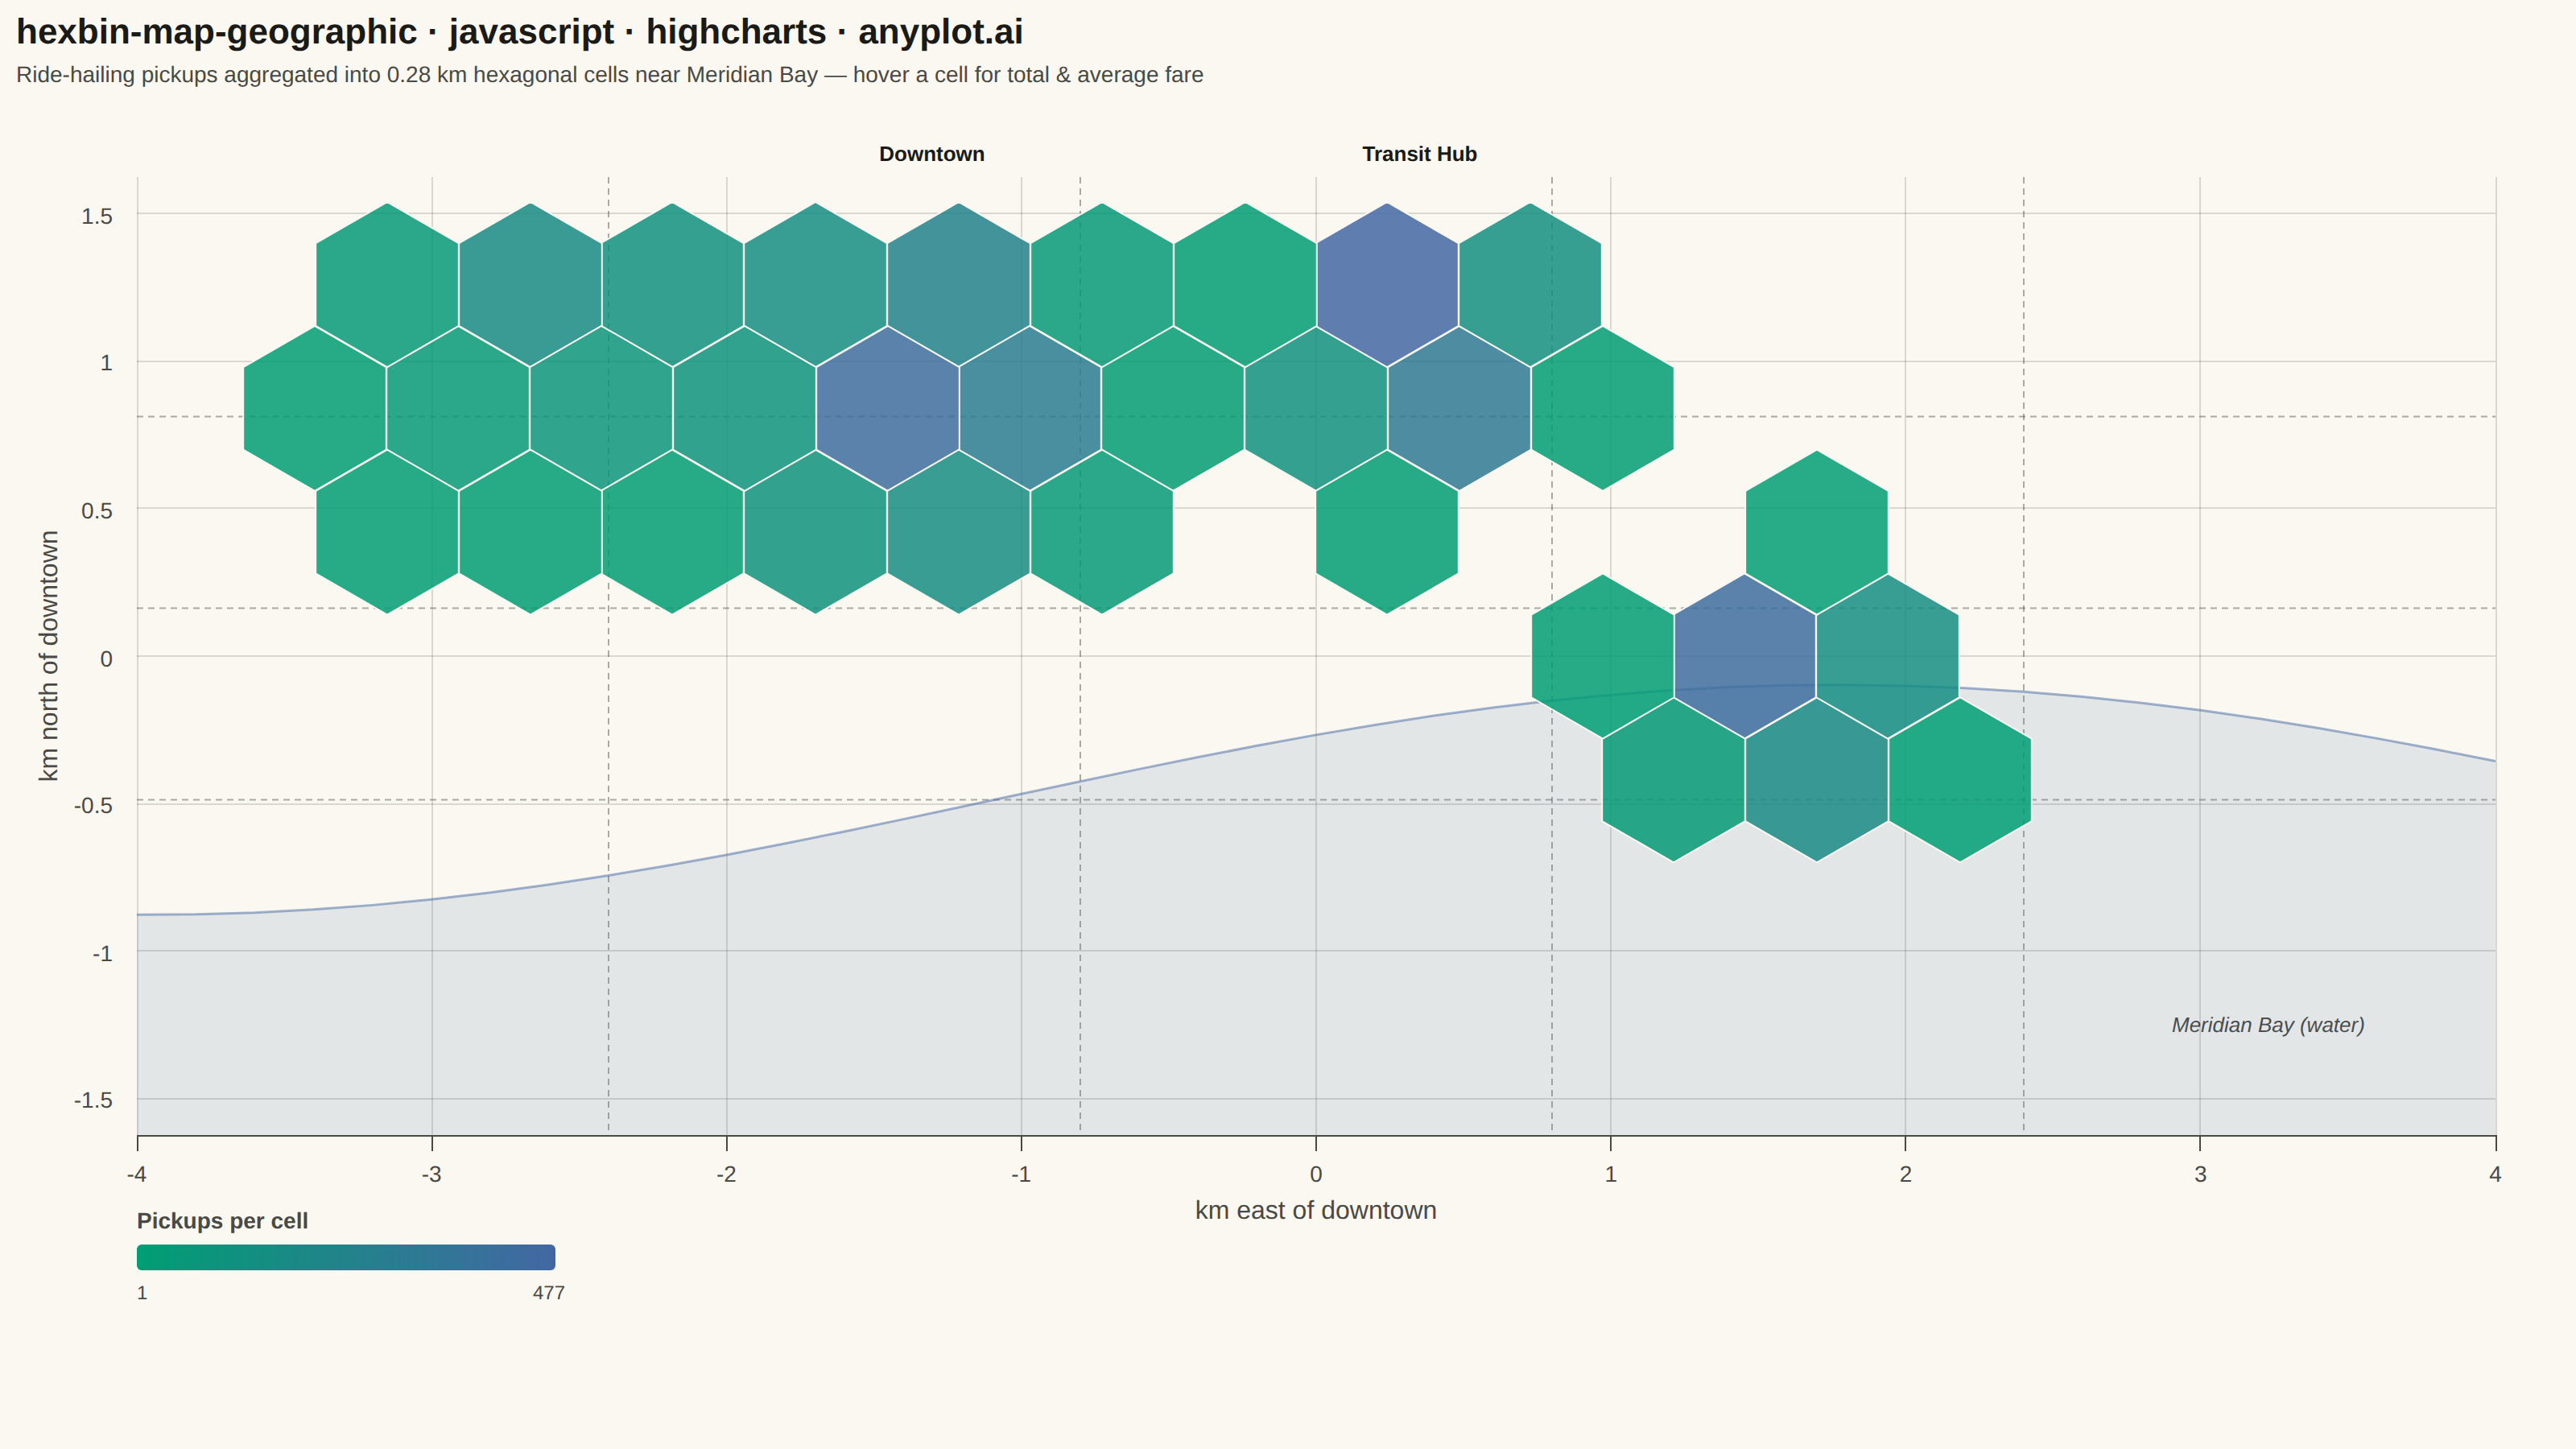
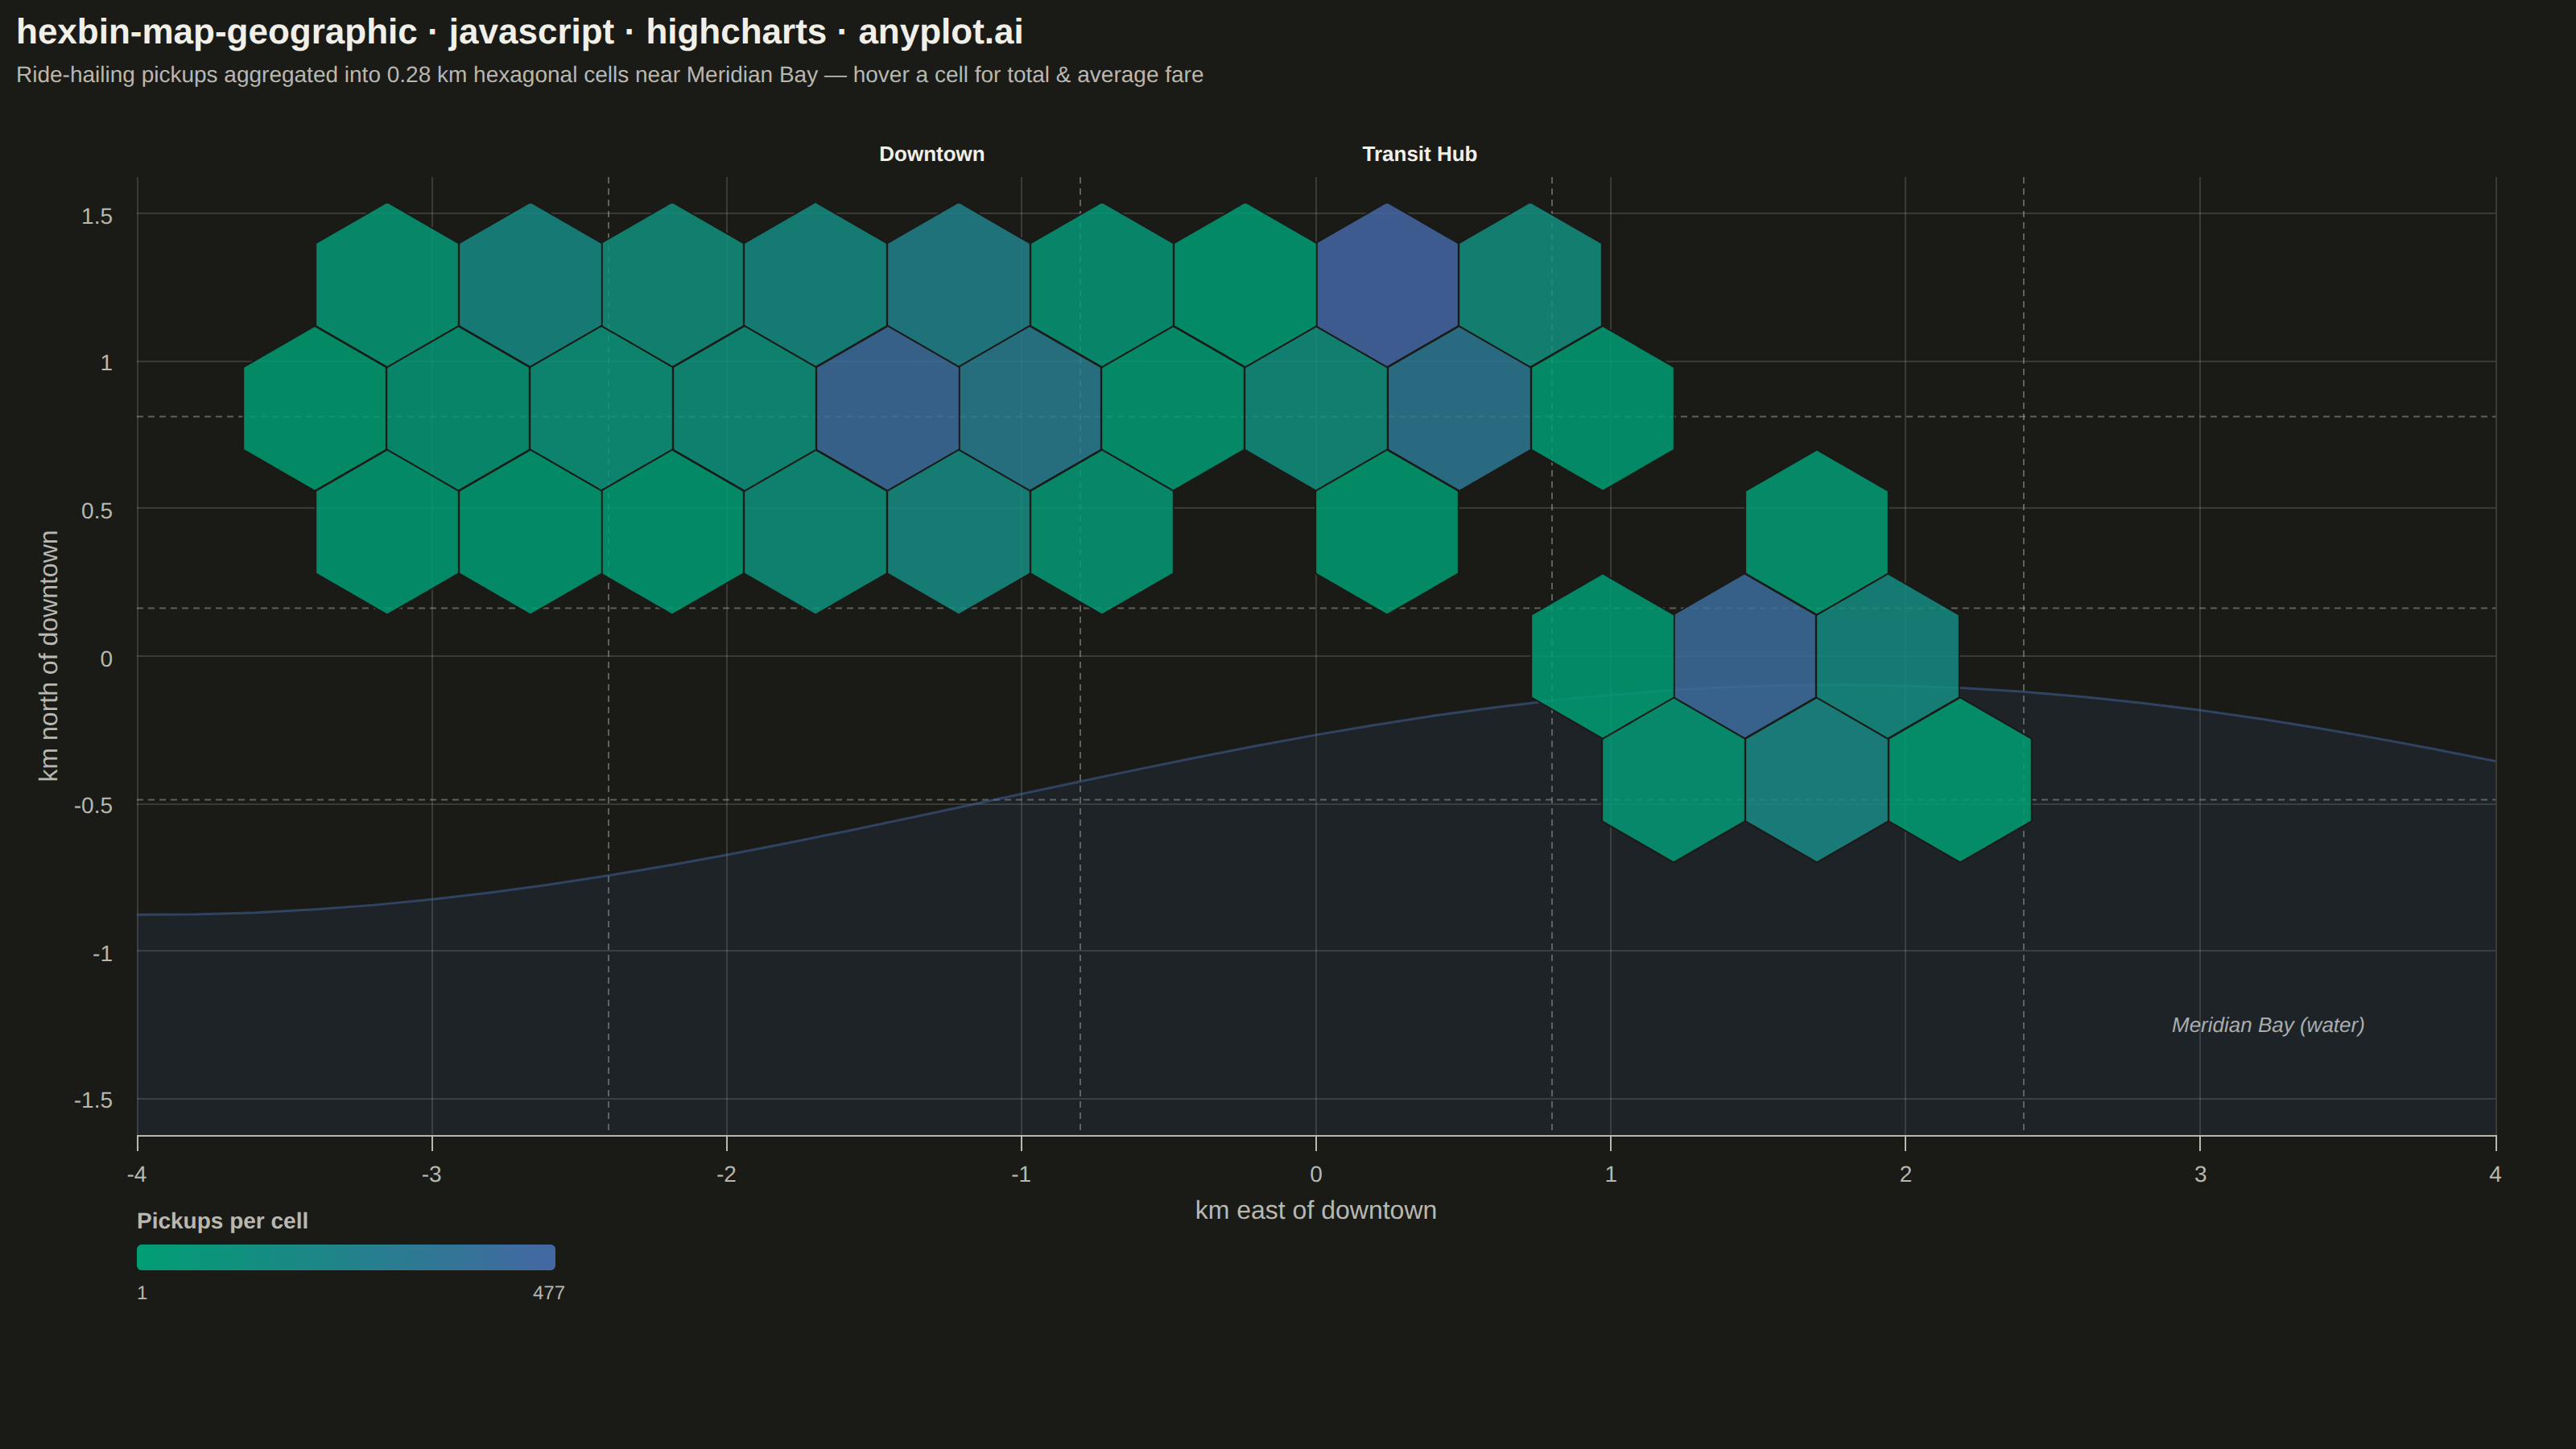
A geographic map visualization that aggregates point data into hexagonal cells, displaying density or aggregated values per cell using color intensity. Unlike continuous heatmaps that use kernel density estimation, hexbin maps provide discrete binning that clearly shows data aggregation boundaries. The hexagonal grid is superior to square grids due to isotropy (equal distance to neighboring cells) and better visual continuity, making it ideal for spatial statistics and urban data analysis.
// anyplot.ai
// hexbin-map-geographic: Hexagonal Binning Map
// Library: highcharts 12.6.0 | JavaScript 22.23.2
// Quality: 92/100 | Created: 2026-08-25

const t = window.ANYPLOT_TOKENS;

// --- Layout constants --------------------------------------------------------
// The mount is a fixed 1600×900 CSS box (harness renders at deviceScaleFactor 2
// -> 3200×1800 PNG). Margins are set explicitly (not "spacing") so the plot area
// pixel size is known at codegen time, letting us pick a km bounding box whose
// aspect ratio exactly matches plotWidth/plotHeight — that's what keeps the
// hand-tiled hexagons regular instead of stretched (1 km must map to the same
// pixel count on both axes).
const MOUNT_WIDTH = 1600;
const MOUNT_HEIGHT = 900;
const MARGIN_LEFT = 85;
const MARGIN_RIGHT = 50;
const MARGIN_TOP = 110;
const MARGIN_BOTTOM = 195; // x-axis title/ticks + gap + hand-drawn gradient legend
const PLOT_WIDTH = MOUNT_WIDTH - MARGIN_LEFT - MARGIN_RIGHT;
const PLOT_HEIGHT = MOUNT_HEIGHT - MARGIN_TOP - MARGIN_BOTTOM;

// Fictional coastal service area — illustrative lat/lon, not a real place.
const LAT0 = 41.85;
const LON0 = -71.35;
const KM_PER_DEG_LAT = 110.57;
const KM_PER_DEG_LON = 111.32 * Math.cos((LAT0 * Math.PI) / 180);

const X_RANGE_KM = 8; // area width, city-scale
const Y_RANGE_KM = (X_RANGE_KM * PLOT_HEIGHT) / PLOT_WIDTH; // locks pixel aspect
const X_MIN = -X_RANGE_KM / 2;
const X_MAX = X_RANGE_KM / 2;
const Y_MIN = -Y_RANGE_KM / 2;
const Y_MAX = Y_RANGE_KM / 2;
const PX_PER_KM = PLOT_WIDTH / X_RANGE_KM;

// Hexagon size — configurable: smaller = more detail, larger = more overview.
const HEX_RADIUS_KM = 0.28;
const HEX_RADIUS_PX = HEX_RADIUS_KM * PX_PER_KM;
const SQRT3 = Math.sqrt(3);

// --- Deterministic PRNG (browser has no seeded RNG) --------------------------
let lcgState = 42;
function nextRandom() {
  lcgState = (lcgState * 1103515245 + 12345) % 2147483648;
  return lcgState / 2147483648;
}
function jitter(spread) {
  // Sum of 3 uniforms centred on 0 — cheap approx-normal, bounded, deterministic.
  return ((nextRandom() + nextRandom() + nextRandom() - 1.5) / 1.5) * spread;
}

// --- Coastline (base-map context) --------------------------------------------
// Water sits south of this wavy curve; ride-hailing pickups never originate on
// water, so the exclusion also shapes which hexagons end up with data.
function coastlineY(x) {
  return -0.15 * Y_RANGE_KM + 0.12 * Y_RANGE_KM * Math.sin((x / X_RANGE_KM) * Math.PI * 1.4 + 0.6);
}

// --- Data: ride-hailing pickups around four demand hotspots -------------------
// (lat, lon, value=fare $) aggregated per hex cell into count / sum / mean.
const N_POINTS = 4000;
const HOTSPOTS = [
  { name: "Downtown", cx: -1.3, cy: 0.9, spread: 0.85, weight: 0.38 },
  { name: "Transit Hub", cx: 0.35, cy: 1.1, spread: 0.55, weight: 0.27 },
  // Waterfront Promenade sits on a pier, so its pickups are allowed to dip
  // below the coastline — this is what actually lets the hex-cell alpha=0.85
  // fill show the water polygon underneath instead of only ever sitting on land.
  { name: "Waterfront Promenade", cx: 1.6, cy: -0.15, spread: 0.5, weight: 0.2, waterMargin: -0.22 },
  { name: "North Residential", cx: -2.5, cy: 1.3, spread: 1.0, weight: 0.15 },
];

const points = [];
HOTSPOTS.forEach((hotspot) => {
  const target = Math.round(N_POINTS * hotspot.weight);
  let placed = 0;
  let attempts = 0;
  const waterMargin = hotspot.waterMargin ?? 0.05;
  while (placed < target && attempts < target * 20) {
    attempts += 1;
    const x = hotspot.cx + jitter(hotspot.spread);
    const y = hotspot.cy + jitter(hotspot.spread);
    if (x < X_MIN || x > X_MAX || y < Y_MIN || y > Y_MAX) continue;
    if (y < coastlineY(x) + waterMargin) continue; // no pickups on open water
    const distFromCenter = Math.hypot(x - hotspot.cx, y - hotspot.cy);
    const fare = Math.max(4, 7 + distFromCenter * 1.4 + jitter(3));
    points.push({ x, y, value: fare });
    placed += 1;
  }
});

// --- Hexagonal binning (pointy-top axial grid, cube-rounded) ------------------
function pixelToAxial(x, y, size) {
  const q = ((SQRT3 / 3) * x - (1 / 3) * y) / size;
  const r = ((2 / 3) * y) / size;
  return cubeRound(q, r);
}
function cubeRound(qf, rf) {
  const xf = qf;
  const zf = rf;
  const yf = -xf - zf;
  let rx = Math.round(xf);
  let ry = Math.round(yf);
  let rz = Math.round(zf);
  const dx = Math.abs(rx - xf);
  const dy = Math.abs(ry - yf);
  const dz = Math.abs(rz - zf);
  if (dx > dy && dx > dz) rx = -ry - rz;
  else if (dy > dz) ry = -rx - rz;
  else rz = -rx - ry;
  return { q: rx, r: rz };
}
function axialToPixel(q, r, size) {
  return { x: size * (SQRT3 * q + (SQRT3 / 2) * r), y: size * 1.5 * r };
}

const bins = new Map();
points.forEach((p) => {
  const { q, r } = pixelToAxial(p.x, p.y, HEX_RADIUS_KM);
  const key = `${q},${r}`;
  let bin = bins.get(key);
  if (!bin) {
    const center = axialToPixel(q, r, HEX_RADIUS_KM);
    bin = { x: center.x, y: center.y, count: 0, sum: 0 };
    bins.set(key, bin);
  }
  bin.count += 1;
  bin.sum += p.value;
});

const hexCells = Array.from(bins.values()).map((bin) => {
  const mean = bin.sum / bin.count;
  const lat = LAT0 + bin.y / KM_PER_DEG_LAT;
  const lon = LON0 + bin.x / KM_PER_DEG_LON;
  return {
    x: bin.x,
    y: bin.y,
    count: bin.count,
    sum: Math.round(bin.sum),
    mean: Math.round(mean * 10) / 10,
    lat: Math.round(lat * 1000) / 1000,
    lon: Math.round(lon * 1000) / 1000,
  };
});
const minCount = Math.min(...hexCells.map((c) => c.count));
const maxCount = Math.max(...hexCells.map((c) => c.count));

// The core Highcharts bundle has no heatmap/colorAxis module (see
// prompts/library/highcharts.md), so each cell's fill is computed by hand — a
// linear interpolation across the two-stop imprint_seq gradient.
function hexToRgb(hex) {
  const n = parseInt(hex.slice(1), 16);
  return [(n >> 16) & 255, (n >> 8) & 255, n & 255];
}
const seqLow = hexToRgb(t.seq[0]);
const seqHigh = hexToRgb(t.seq[1]);
function valueToColor(value, min, max) {
  const frac = max > min ? (value - min) / (max - min) : 1;
  const rgb = seqLow.map((c, i) => Math.round(c + (seqHigh[i] - c) * frac));
  return `rgba(${rgb[0]},${rgb[1]},${rgb[2]},0.85)`;
}
hexCells.forEach((c) => {
  c.color = valueToColor(c.count, minCount, maxCount);
});

// Sampled coastline curve for the water-fill area series (base-map context).
const coastlineSamples = [];
for (let i = 0; i <= 40; i++) {
  const x = X_MIN + (i / 40) * X_RANGE_KM;
  coastlineSamples.push([x, coastlineY(x)]);
}

// Schematic street grid — additional base-map context beyond the coastline
// alone (per spec: "base map showing geographic context"). Each line is its
// own tiny series (not one multi-segment series) so Highcharts never
// re-sorts the two endpoints by x, which would otherwise scramble the grid.
const streetRgb = hexToRgb(t.inkSoft);
const streetLineColor = `rgba(${streetRgb[0]},${streetRgb[1]},${streetRgb[2]},0.45)`;
const STREET_GRID_X_FRACS = [0.2, 0.4, 0.6, 0.8];
const STREET_GRID_Y_FRACS = [0.35, 0.55, 0.75];
function streetLine(data) {
  return {
    type: "line",
    data,
    color: streetLineColor,
    lineWidth: 1,
    dashStyle: "Dash",
    marker: { enabled: false },
    enableMouseTracking: false,
    showInLegend: false,
    zIndex: 0,
  };
}
const streetGridSeries = [
  ...STREET_GRID_X_FRACS.map((f) => streetLine([
    [X_MIN + f * X_RANGE_KM, Y_MAX],
    [X_MIN + f * X_RANGE_KM, Y_MIN],
  ])),
  ...STREET_GRID_Y_FRACS.map((f) => streetLine([
    [X_MIN, Y_MIN + f * Y_RANGE_KM],
    [X_MAX, Y_MIN + f * Y_RANGE_KM],
  ])),
];

// --- Custom hexagon marker symbol --------------------------------------------
// Pointy-top orientation to match the axial math above; registering a symbol on
// the SVGRenderer is a core-Highcharts feature (no add-on module needed).
Highcharts.SVGRenderer.prototype.symbols.hexagon = function (x, y, w, h) {
  const cx = x + w / 2;
  const cy = y + h / 2;
  const r = w / 2;
  const path = [];
  for (let i = 0; i < 6; i++) {
    const angle = (Math.PI / 180) * (-90 + 60 * i);
    const px = cx + r * Math.cos(angle);
    const py = cy + r * Math.sin(angle);
    path.push(i === 0 ? "M" : "L", px, py);
  }
  path.push("Z");
  return path;
};

// --- Chart ---------------------------------------------------------------
const title = "hexbin-map-geographic · javascript · highcharts · anyplot.ai";

function drawColorLegend(chart) {
  const r = chart.renderer;
  const x0 = chart.plotLeft;
  const y0 = chart.plotTop + chart.plotHeight + 68;
  const barWidth = 260;
  const barHeight = 16;

  r.text("Pickups per cell", x0, y0 - 10)
    .css({ color: t.inkSoft, fontSize: "14px", fontWeight: "600" })
    .add();

  r.rect(x0, y0, barWidth, barHeight, 3)
    .attr({
      fill: {
        linearGradient: { x1: 0, y1: 0, x2: 1, y2: 0 },
        stops: [
          [0, t.seq[0]],
          [1, t.seq[1]],
        ],
      },
      "stroke-width": 0,
    })
    .add();
  r.text(String(minCount), x0, y0 + barHeight + 18)
    .css({ color: t.inkSoft, fontSize: "12px" })
    .add();
  r.text(String(maxCount), x0 + barWidth - 14, y0 + barHeight + 18)
    .css({ color: t.inkSoft, fontSize: "12px" })
    .add();
}

function drawWaterLabel(chart) {
  const px = chart.xAxis[0].toPixels(X_MAX - 1.1, false);
  const py = chart.yAxis[0].toPixels(Y_MIN + 0.35, false);
  chart.renderer
    .text("Meridian Bay (water)", px, py)
    .css({ color: t.inkSoft, fontSize: "13px", fontStyle: "italic" })
    .add();
}

// Label the two densest hotspots directly on the chart (turns the color
// contrast into a named story instead of leaving it to the tooltip alone).
// Placed in the margin band just above the plot area — hex cells can be
// clipped right up to the axis-max edge, so any label inside the plot area
// risks sitting on top of a cell; the margin band is guaranteed clear.
function drawHotspotLabels(chart) {
  const topHotspots = [HOTSPOTS[0], HOTSPOTS[1]]; // Downtown, Transit Hub
  const py = chart.plotTop - 10;
  topHotspots.forEach((h) => {
    const px = chart.xAxis[0].toPixels(h.cx, false);
    chart.renderer
      .text(h.name, px, py)
      .attr({ align: "center" })
      .css({ color: t.ink, fontSize: "13px", fontWeight: "700" })
      .add();
  });
}

Highcharts.chart(
  "container",
  {
    chart: {
      type: "scatter",
      backgroundColor: "transparent",
      animation: false,
      style: { fontFamily: "inherit" },
      marginLeft: MARGIN_LEFT,
      marginRight: MARGIN_RIGHT,
      marginTop: MARGIN_TOP,
      marginBottom: MARGIN_BOTTOM,
    },
    credits: { enabled: false },
    colors: t.palette,
    title: {
      text: title,
      align: "left",
      style: { color: t.ink, fontSize: "22px", fontWeight: "600" },
    },
    subtitle: {
      text: "Ride-hailing pickups aggregated into 0.28 km hexagonal cells near Meridian Bay — hover a cell for total & average fare",
      align: "left",
      style: { color: t.inkSoft, fontSize: "14px" },
    },
    xAxis: {
      min: X_MIN,
      max: X_MAX,
      startOnTick: false,
      endOnTick: false,
      title: { text: "km east of downtown", style: { color: t.inkSoft, fontSize: "16px" } },
      lineColor: t.inkSoft,
      tickColor: t.inkSoft,
      gridLineColor: t.grid,
      gridLineWidth: 1,
      labels: { style: { color: t.inkSoft, fontSize: "14px" } },
    },
    yAxis: {
      min: Y_MIN,
      max: Y_MAX,
      startOnTick: false,
      endOnTick: false,
      title: { text: "km north of downtown", style: { color: t.inkSoft, fontSize: "16px" } },
      lineColor: t.inkSoft,
      tickColor: t.inkSoft,
      gridLineColor: t.grid,
      gridLineWidth: 1,
      labels: { style: { color: t.inkSoft, fontSize: "14px" } },
    },
    legend: { enabled: false },
    tooltip: {
      backgroundColor: t.elevatedBg,
      borderColor: t.inkSoft,
      style: { color: t.ink, fontSize: "13px" },
      useHTML: false,
    },
    plotOptions: {
      series: { animation: false },
    },
    series: [
      ...streetGridSeries,
      {
        name: "Bay waters",
        type: "area",
        data: coastlineSamples,
        threshold: Y_MIN,
        color: "rgba(68,103,163,0.16)",
        lineWidth: 1.5,
        lineColor: "rgba(68,103,163,0.5)",
        marker: { enabled: false },
        enableMouseTracking: false,
        showInLegend: false,
        zIndex: 1,
      },
      {
        name: "Hex cells",
        type: "scatter",
        data: hexCells,
        showInLegend: false,
        zIndex: 2,
        marker: {
          symbol: "hexagon",
          radius: HEX_RADIUS_PX,
          lineWidth: 1,
          lineColor: t.pageBg,
          states: { hover: { lineWidthPlus: 1, lineColor: t.ink } },
        },
        tooltip: {
          pointFormatter() {
            return (
              `<b>${this.count} pickups</b><br/>` +
              `Total fare: $${this.sum}<br/>` +
              `Avg fare: $${this.mean}<br/>` +
              `≈ ${this.lat}°N, ${Math.abs(this.lon)}°W`
            );
          },
        },
      },
    ],
  },
  function (chart) {
    drawColorLegend(chart);
    drawWaterLabel(chart);
    drawHotspotLabels(chart);
  },
);
Runnable source as JSON, for any HTTP client: https://api.anyplot.ai/specs/hexbin-map-geographic/highcharts/code. Any spec id and library id listed in llms-full.txt fit the same URL shape; every URL below is complete and callable.
{
  "spec_id": "hexbin-map-geographic",
  "language": "javascript",
  "library": "highcharts",
  "page": "https://anyplot.ai/hexbin-map-geographic/javascript/highcharts",
  "hub": "https://anyplot.ai/hexbin-map-geographic",
  "code_json": "https://api.anyplot.ai/specs/hexbin-map-geographic/highcharts/code",
  "spec_json": "https://api.anyplot.ai/specs/hexbin-map-geographic",
  "render_light_png": "https://storage.googleapis.com/anyplot-images/plots/hexbin-map-geographic/javascript/highcharts/plot-light.png",
  "render_dark_png": "https://storage.googleapis.com/anyplot-images/plots/hexbin-map-geographic/javascript/highcharts/plot-dark.png",
  "interactive_light_html": "https://storage.googleapis.com/anyplot-images/plots/hexbin-map-geographic/javascript/highcharts/plot-light.html",
  "interactive_dark_html": "https://storage.googleapis.com/anyplot-images/plots/hexbin-map-geographic/javascript/highcharts/plot-dark.html",
  "quality_score": 92.0,
  "license": "MIT",
  "guide": "https://anyplot.ai/llms.txt"
}
Part of Hexagonal Binning Map on anyplot.ai.