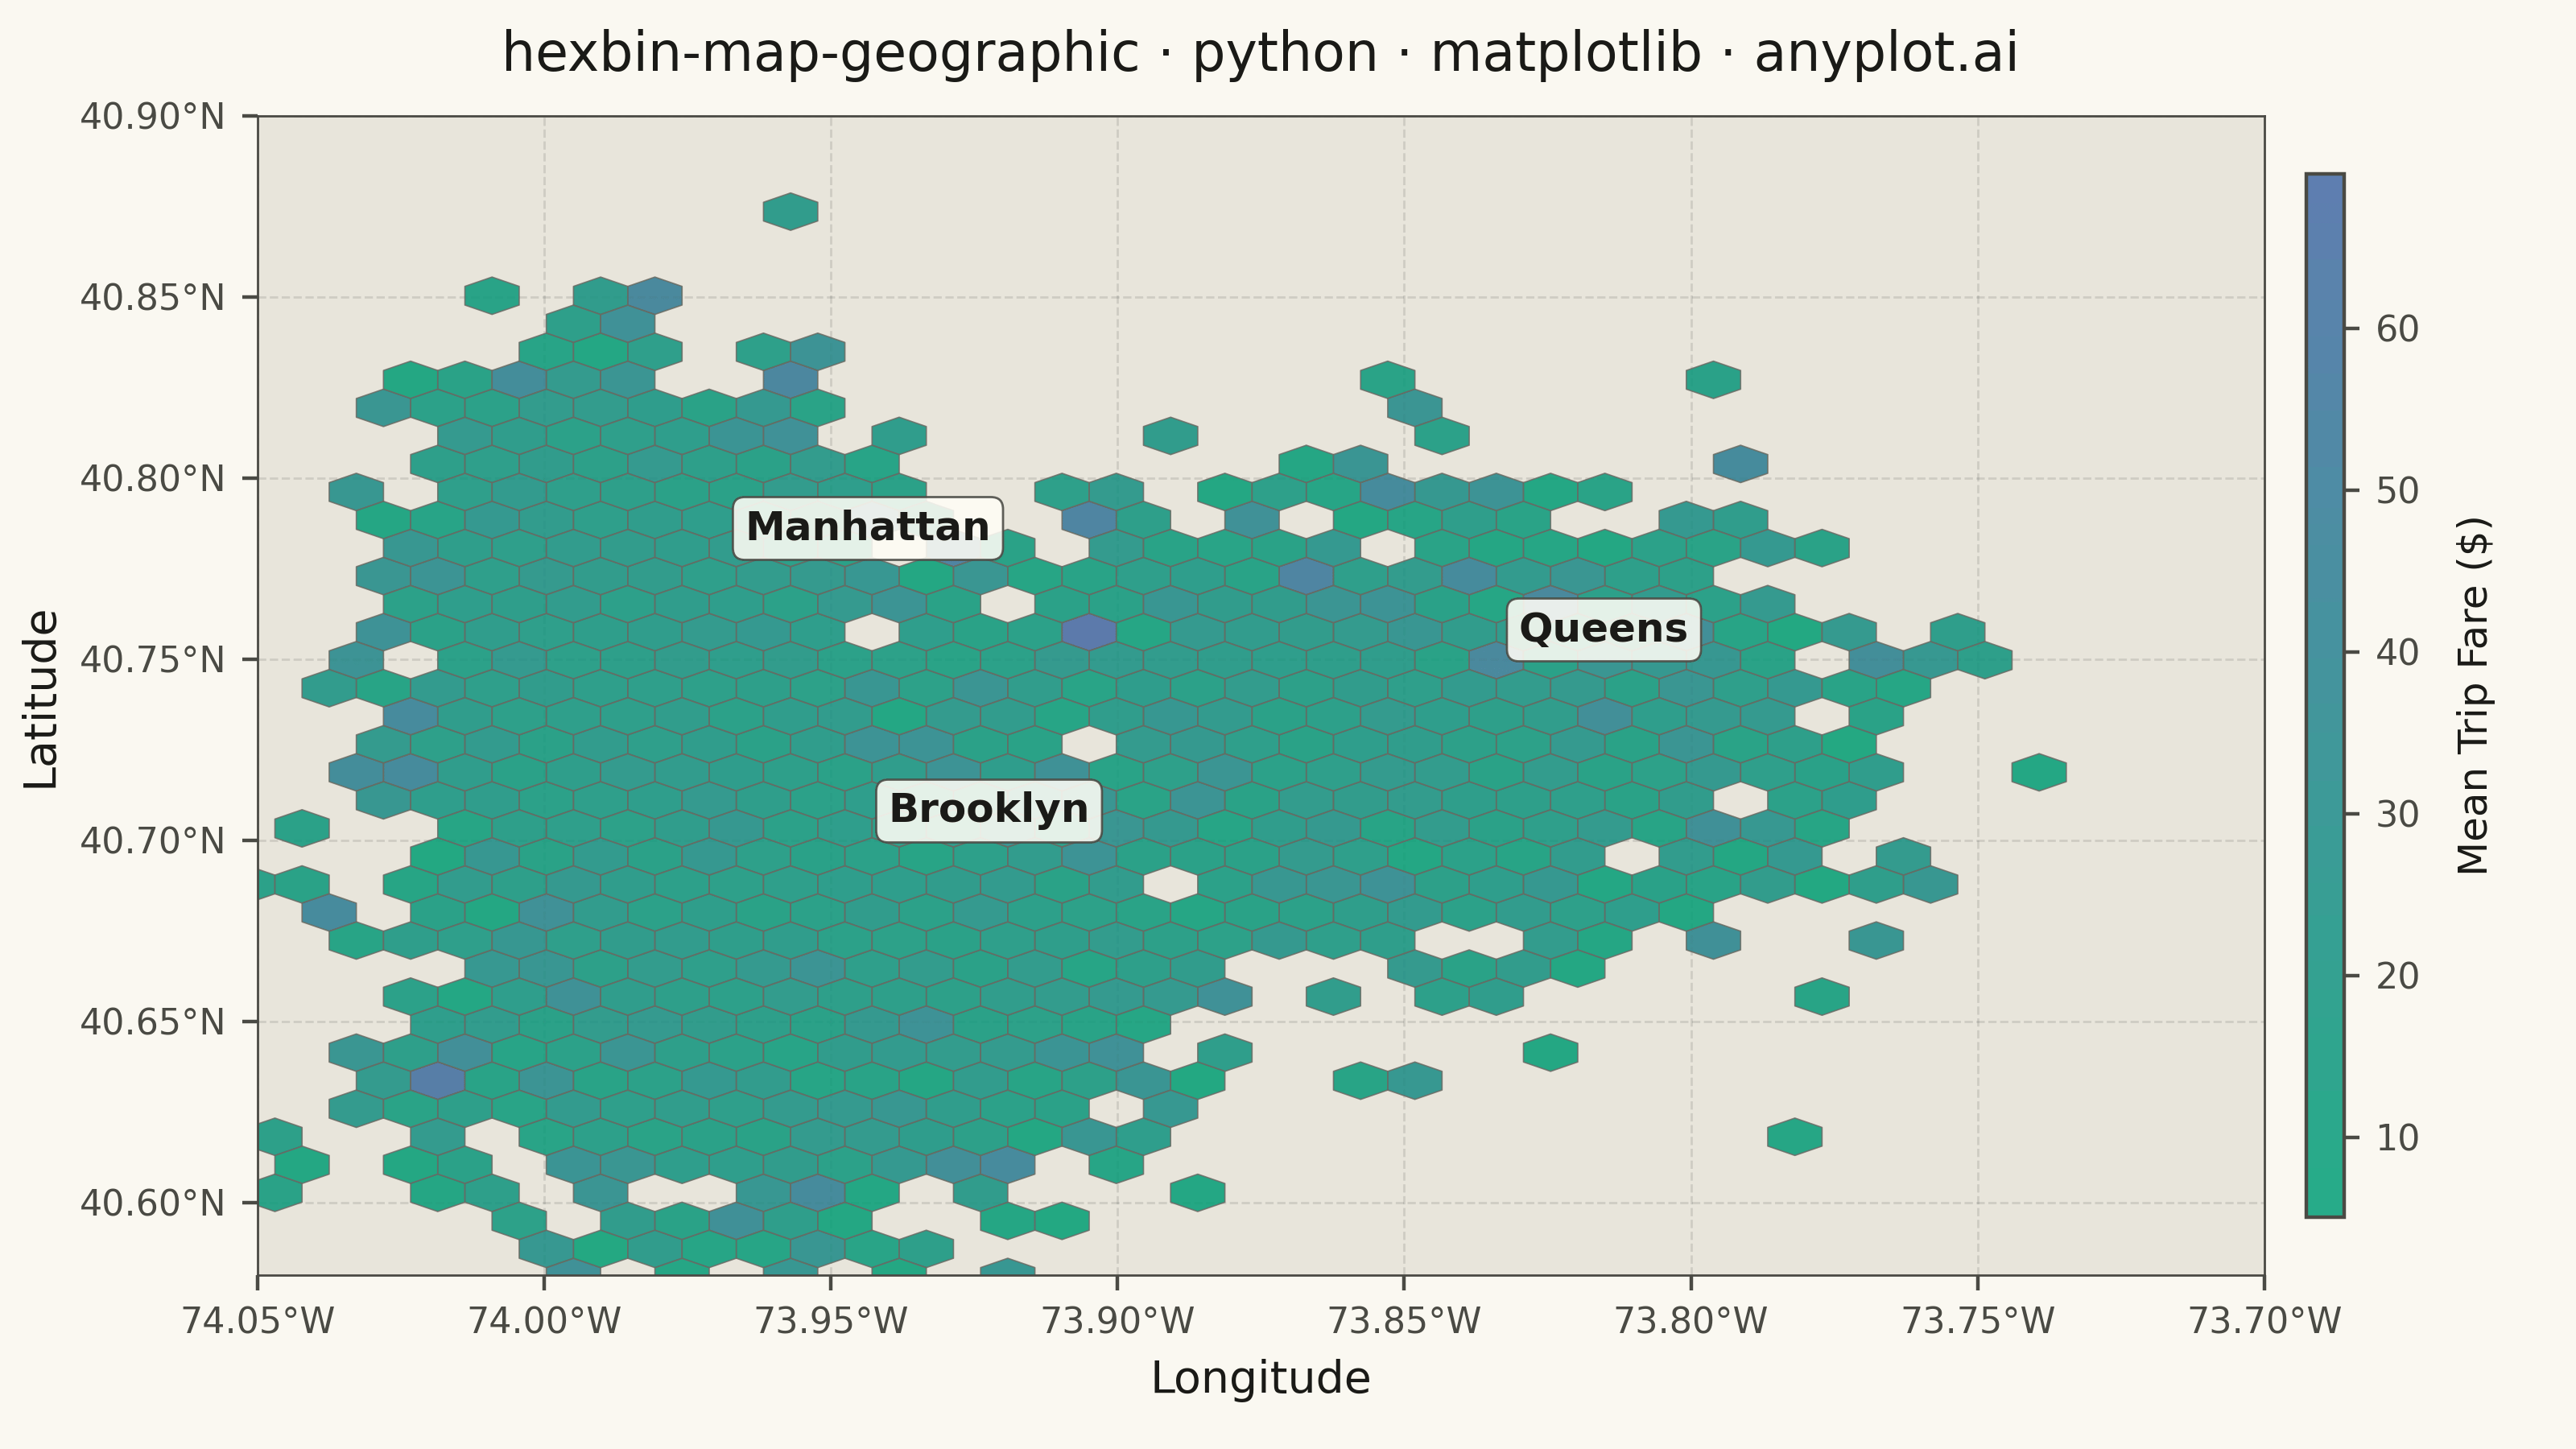
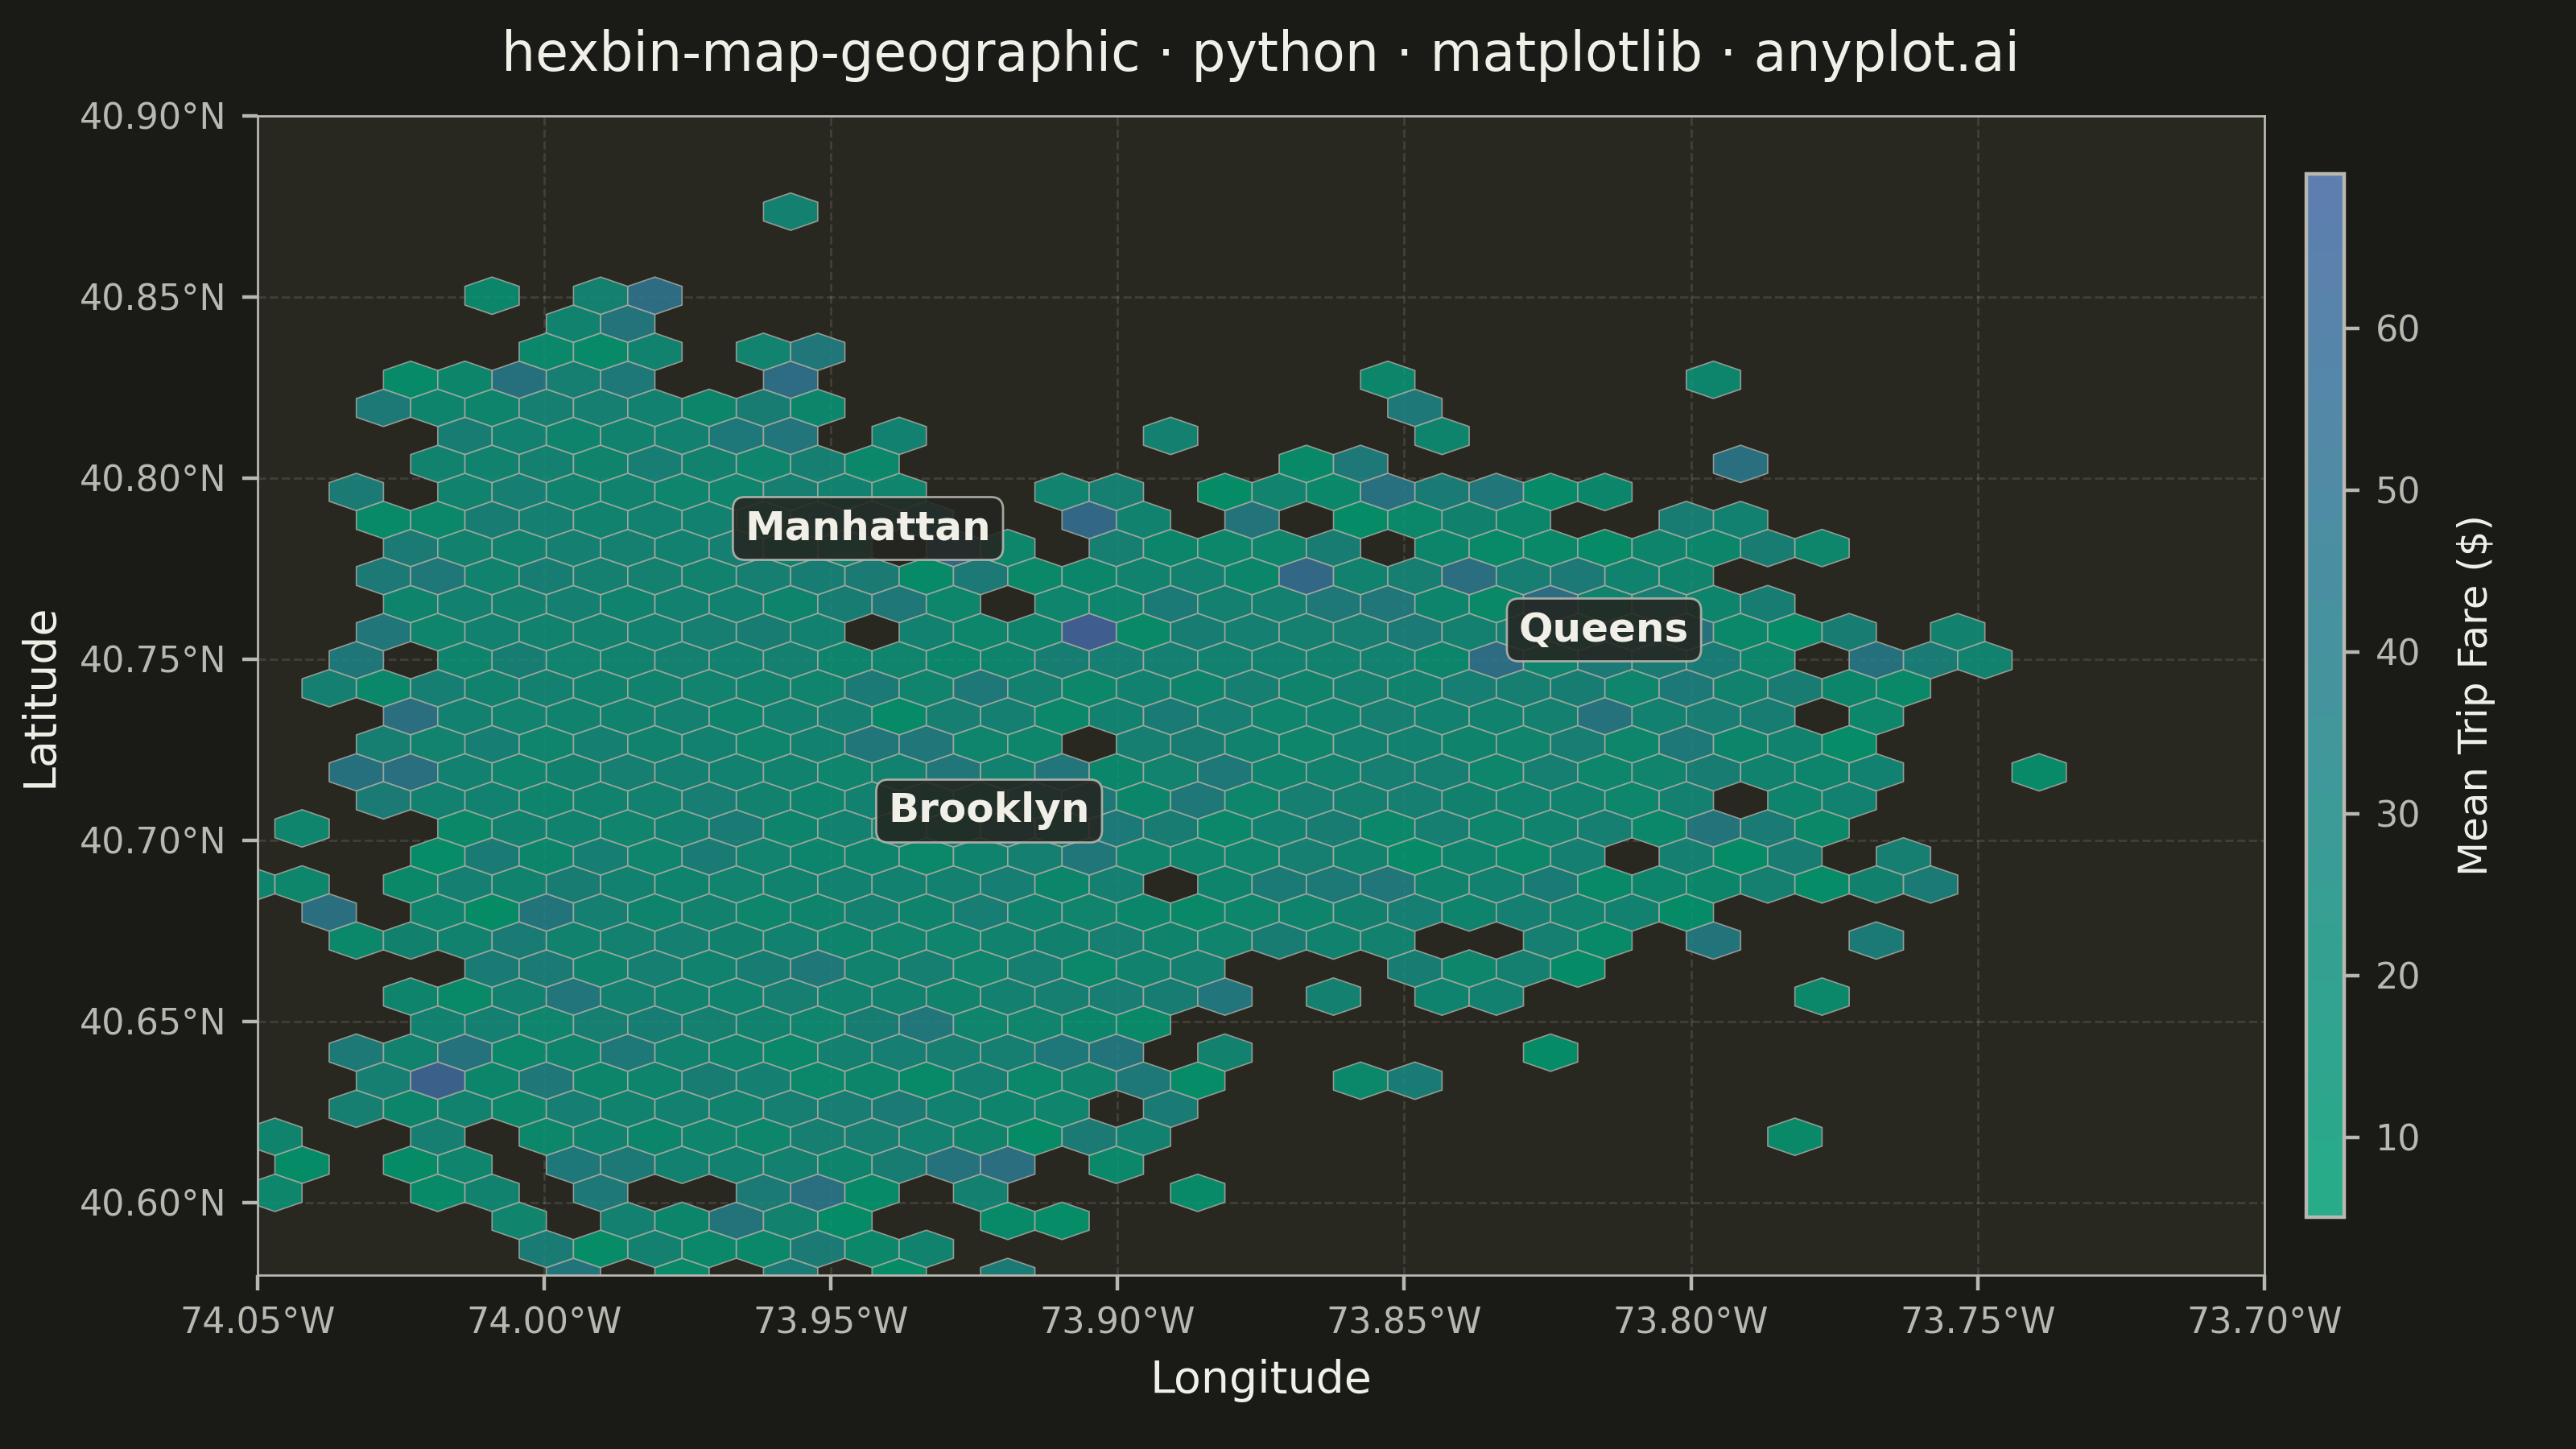
A geographic map visualization that aggregates point data into hexagonal cells, displaying density or aggregated values per cell using color intensity. Unlike continuous heatmaps that use kernel density estimation, hexbin maps provide discrete binning that clearly shows data aggregation boundaries. The hexagonal grid is superior to square grids due to isotropy (equal distance to neighboring cells) and better visual continuity, making it ideal for spatial statistics and urban data analysis.
""" anyplot.ai
hexbin-map-geographic: Hexagonal Binning Map
Library: matplotlib 3.10.9 | Python 3.13.13
Quality: 92/100 | Updated: 2026-05-27
"""

import os

import matplotlib.pyplot as plt
import numpy as np
from matplotlib.colors import LinearSegmentedColormap
from matplotlib.patches import Rectangle


# Theme tokens
THEME = os.getenv("ANYPLOT_THEME", "light")
PAGE_BG = "#FAF8F1" if THEME == "light" else "#1A1A17"
ELEVATED_BG = "#FFFDF6" if THEME == "light" else "#242420"
INK = "#1A1A17" if THEME == "light" else "#F0EFE8"
INK_SOFT = "#4A4A44" if THEME == "light" else "#B8B7B0"
INK_MUTED = "#6B6A63" if THEME == "light" else "#A8A79F"

# Continuous colormap — imprint_seq (green → blue, single-polarity)
imprint_seq = LinearSegmentedColormap.from_list("imprint_seq", ["#009E73", "#4467A3"])

# Base map surface colors
WATER_BG = "#C8DFF0" if THEME == "light" else "#1C2D3A"
LAND_BG = "#E8E5DB" if THEME == "light" else "#282820"

# Data: NYC taxi pickup locations (5,000 simulated points)
np.random.seed(42)
n_points = 5000

lat_manhattan = np.random.normal(40.758, 0.030, 2500)
lon_manhattan = np.random.normal(-73.985, 0.015, 2500)
lat_brooklyn = np.random.normal(40.680, 0.040, 1500)
lon_brooklyn = np.random.normal(-73.960, 0.030, 1500)
lat_queens = np.random.normal(40.730, 0.030, 1000)
lon_queens = np.random.normal(-73.850, 0.040, 1000)

lat = np.concatenate([lat_manhattan, lat_brooklyn, lat_queens])
lon = np.concatenate([lon_manhattan, lon_brooklyn, lon_queens])
values = np.random.exponential(15, n_points) + 5

# Plot — landscape 3200 × 1800 px
fig, ax = plt.subplots(figsize=(8, 4.5), dpi=400, facecolor=PAGE_BG)

# Base map: water background + land area rectangle
ax.set_facecolor(WATER_BG)
ax.add_patch(Rectangle((-74.05, 40.58), 0.35, 0.32, linewidth=0, facecolor=LAND_BG, zorder=0))

# Hexbin: mean trip fare aggregated per hex cell
hb = ax.hexbin(
    lon,
    lat,
    C=values,
    gridsize=35,
    reduce_C_function=np.mean,
    cmap=imprint_seq,
    alpha=0.85,
    edgecolors=INK_MUTED,
    linewidths=0.3,
    mincnt=1,
    zorder=2,
)

# Colorbar
cbar = fig.colorbar(hb, ax=ax, shrink=0.90, pad=0.02, aspect=28, fraction=0.030)
cbar.set_label("Mean Trip Fare ($)", fontsize=9, color=INK, labelpad=8)
cbar.ax.tick_params(labelsize=8, colors=INK_SOFT, labelcolor=INK_SOFT)
cbar.outline.set_edgecolor(INK_SOFT)

# Axis limits and coordinate formatters
ax.set_xlim(-74.05, -73.70)
ax.set_ylim(40.58, 40.90)
ax.xaxis.set_major_formatter(plt.FuncFormatter(lambda x, p: f"{abs(x):.2f}°W"))
ax.yaxis.set_major_formatter(plt.FuncFormatter(lambda y, p: f"{y:.2f}°N"))

# Style
ax.set_xlabel("Longitude", fontsize=10, color=INK)
ax.set_ylabel("Latitude", fontsize=10, color=INK)

title = "hexbin-map-geographic · python · matplotlib · anyplot.ai"
n = len(title)
title_fs = max(8, round(12 * 67 / n)) if n > 67 else 12
ax.set_title(title, fontsize=title_fs, fontweight="medium", color=INK, pad=10)

ax.tick_params(axis="both", labelsize=8, colors=INK_SOFT, labelcolor=INK_SOFT)
ax.grid(True, alpha=0.12, linestyle="--", color=INK, zorder=1, linewidth=0.5)
for spine in ax.spines.values():
    spine.set_color(INK_SOFT)
    spine.set_linewidth(0.5)

# Borough annotations
for x, y, name in [(-73.985, 40.758, "Manhattan"), (-73.960, 40.680, "Brooklyn"), (-73.850, 40.730, "Queens")]:
    ax.annotate(
        name,
        xy=(x, y),
        xytext=(x + 0.020, y + 0.025),
        fontsize=9,
        fontweight="bold",
        color=INK,
        ha="left",
        bbox={"boxstyle": "round,pad=0.3", "facecolor": ELEVATED_BG, "alpha": 0.88, "edgecolor": INK_SOFT, "linewidth": 0.5},
        zorder=5,
    )

# Layout — subplots_adjust controls padding; no bbox_inches='tight' in savefig
fig.subplots_adjust(left=0.10, right=0.92, top=0.92, bottom=0.12)

# Save
plt.savefig(f"plot-{THEME}.png", dpi=400, facecolor=PAGE_BG)
Runnable source as JSON, for any HTTP client: https://api.anyplot.ai/specs/hexbin-map-geographic/matplotlib/code. Any spec id and library id listed in llms-full.txt fit the same URL shape; every URL below is complete and callable.
{
  "spec_id": "hexbin-map-geographic",
  "language": "python",
  "library": "matplotlib",
  "page": "https://anyplot.ai/hexbin-map-geographic/python/matplotlib",
  "hub": "https://anyplot.ai/hexbin-map-geographic",
  "code_json": "https://api.anyplot.ai/specs/hexbin-map-geographic/matplotlib/code",
  "spec_json": "https://api.anyplot.ai/specs/hexbin-map-geographic",
  "render_light_png": "https://storage.googleapis.com/anyplot-images/plots/hexbin-map-geographic/python/matplotlib/plot-light.png",
  "render_dark_png": "https://storage.googleapis.com/anyplot-images/plots/hexbin-map-geographic/python/matplotlib/plot-dark.png",
  "quality_score": 92.0,
  "license": "MIT",
  "guide": "https://anyplot.ai/llms.txt"
}
Part of Hexagonal Binning Map on anyplot.ai.