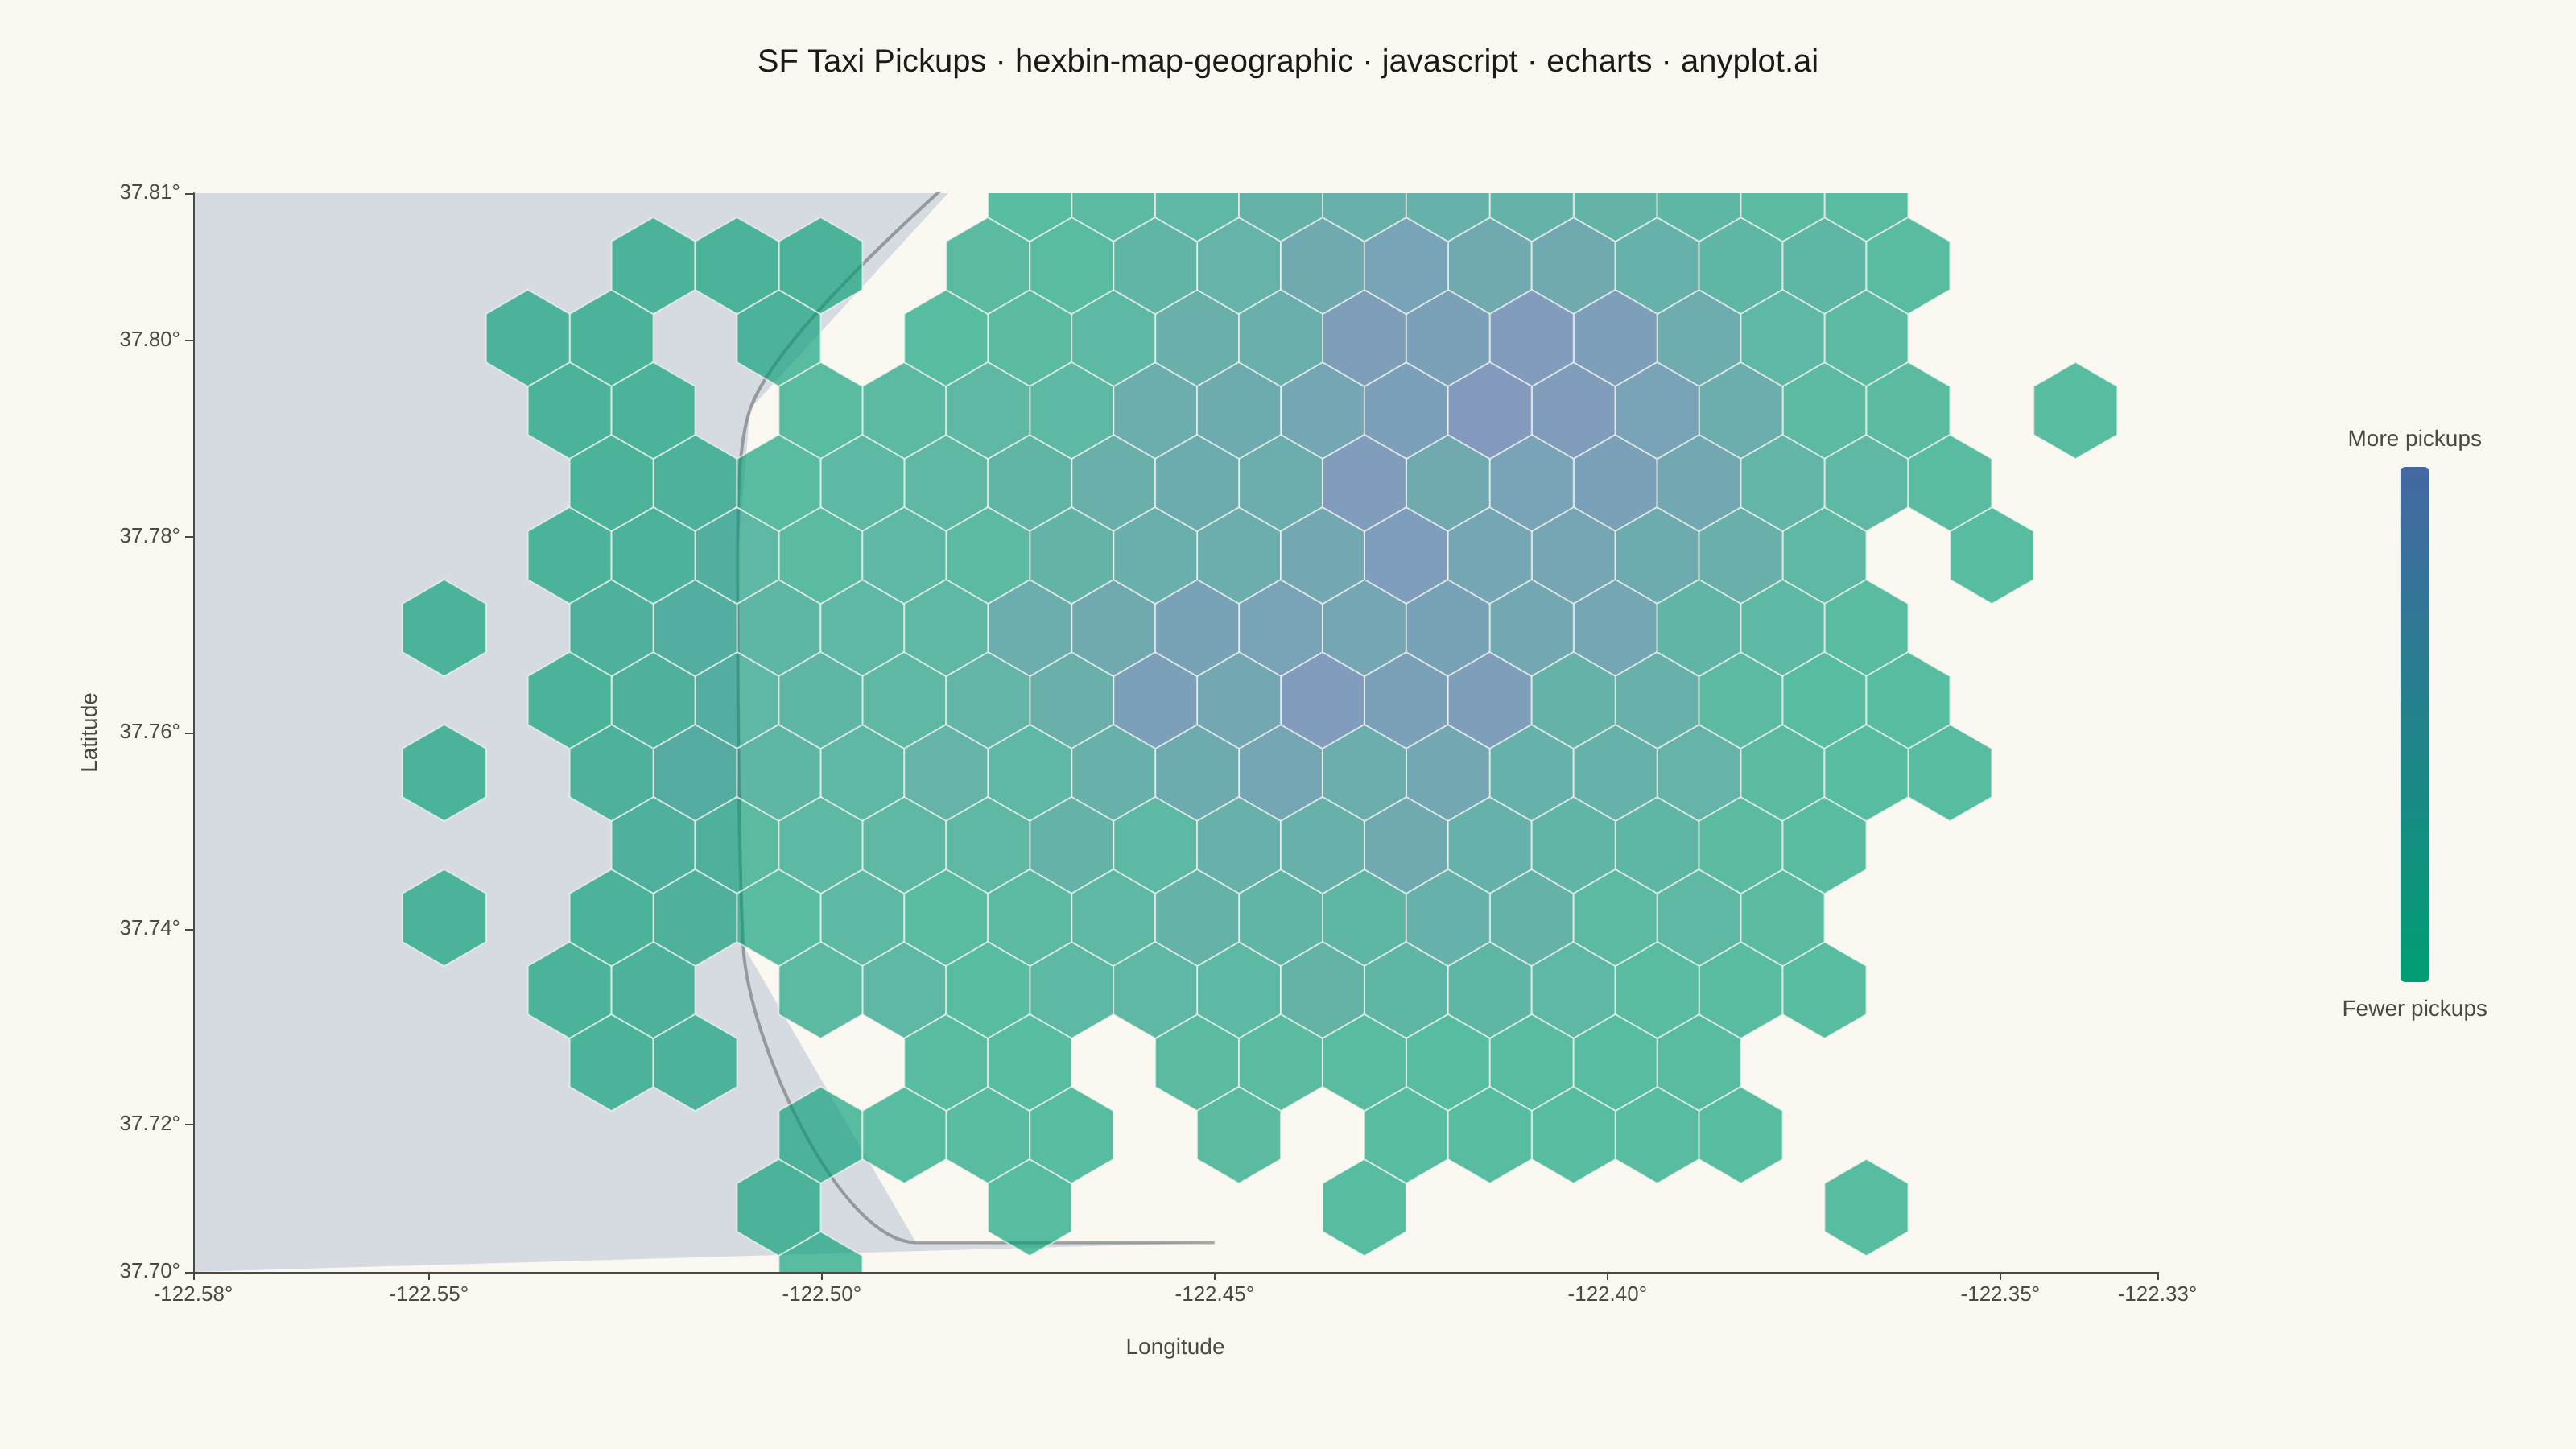
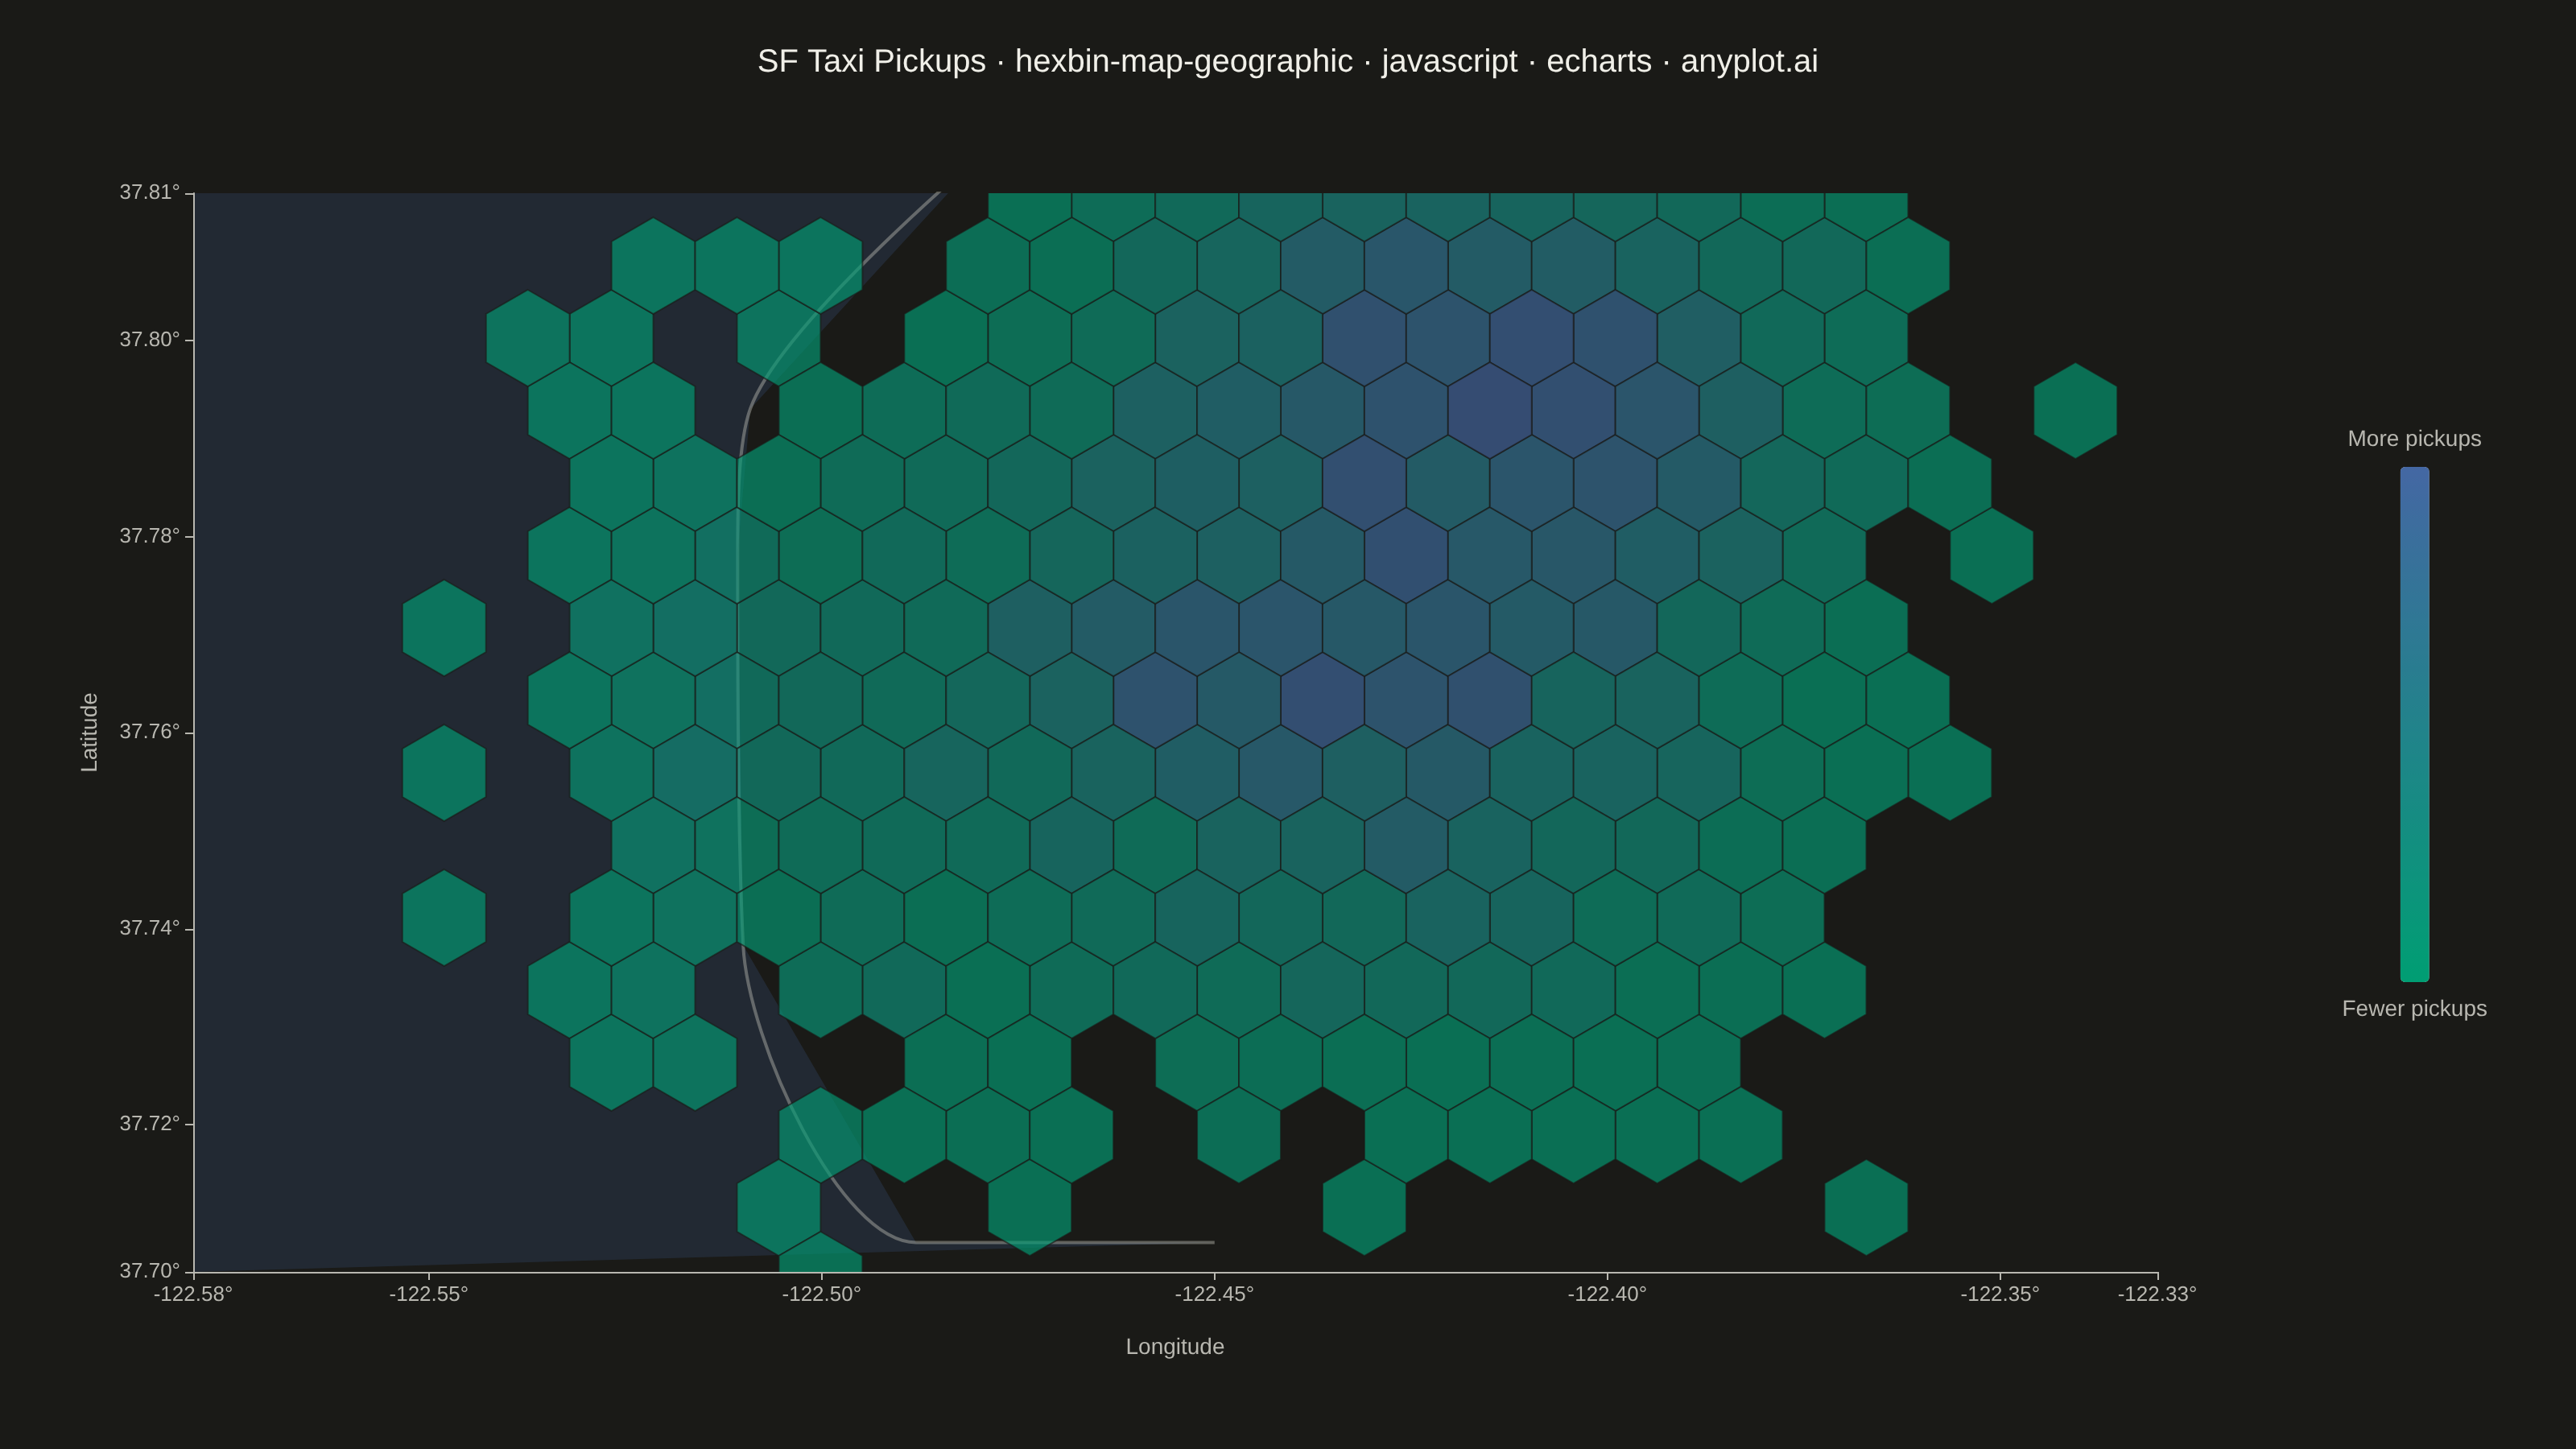
The same plot in 14 other libraries — JavaScript: Chart.js, D3.js, Highcharts, MUI X Charts; Python: Altair, Bokeh, lets-plot, Matplotlib, Plotly, plotnine, Pygal, Seaborn; R: ggplot2; Julia: Makie.jl. Compare all 15 side by side: Hexagonal Binning Map in Python, R, Julia and JavaScript.
A geographic map visualization that aggregates point data into hexagonal cells, displaying density or aggregated values per cell using color intensity. Unlike continuous heatmaps that use kernel density estimation, hexbin maps provide discrete binning that clearly shows data aggregation boundaries. The hexagonal grid is superior to square grids due to isotropy (equal distance to neighboring cells) and better visual continuity, making it ideal for spatial statistics and urban data analysis.
// anyplot.ai
// hexbin-map-geographic: Hexagonal Binning Map
// Library: echarts 6.1.0 | JavaScript 22.23.2
// Quality: 94/100 | Created: 2026-08-25

const t = window.ANYPLOT_TOKENS;
const size = window.ANYPLOT_SIZE;

// --- Study area: San Francisco peninsula, synthetic taxi pickups -----------
const LON_MIN = -122.58;
const LON_MAX = -122.33;
const LAT_MIN = 37.705;
const LAT_MAX = 37.815;

// Rough Pacific-facing shoreline, north to south — geographic context only,
// not a precise survey boundary.
const COASTLINE = [
  [-122.4783, 37.8199],
  [-122.5091, 37.7930],
  [-122.5107, 37.7783],
  [-122.5100, 37.7383],
  [-122.4880, 37.7080],
  [-122.4500, 37.7080],
];

const HOTSPOTS = [
  { lon: -122.4014, lat: 37.7936, weight: 0.28, spread: 0.014 }, // Financial District
  { lon: -122.4194, lat: 37.7599, weight: 0.24, spread: 0.016 }, // Mission District
  { lon: -122.4348, lat: 37.8060, weight: 0.18, spread: 0.012 }, // Marina & Wharf
  { lon: -122.4477, lat: 37.7692, weight: 0.16, spread: 0.014 }, // Haight-Ashbury
  { lon: -122.4869, lat: 37.7599, weight: 0.14, spread: 0.02 },  // Sunset District
];

// --- Fixed-seed LCG (browser has no seeded RNG) -----------------------------
let seed = 42;
function rand() {
  seed = (seed * 1103515245 + 12345) & 0x7fffffff;
  return seed / 0x7fffffff;
}
function gaussian() {
  const u1 = Math.max(rand(), 1e-9);
  const u2 = rand();
  return Math.sqrt(-2 * Math.log(u1)) * Math.cos(2 * Math.PI * u2);
}
function pickHotspot() {
  const r = rand();
  let cumulative = 0;
  for (const h of HOTSPOTS) {
    cumulative += h.weight;
    if (r <= cumulative) return h;
  }
  return HOTSPOTS[HOTSPOTS.length - 1];
}

// --- Synthetic pickup points -------------------------------------------------
const POINT_COUNT = 2600;
const points = [];
for (let i = 0; i < POINT_COUNT; i++) {
  const hotspot = pickHotspot();
  const lon = hotspot.lon + (gaussian() * hotspot.spread) / 0.79;
  const lat = hotspot.lat + gaussian() * hotspot.spread;
  const fare = 6 + Math.abs(gaussian()) * 9 + rand() * 6;
  if (lon < LON_MIN || lon > LON_MAX || lat < LAT_MIN || lat > LAT_MAX) continue;
  points.push({ lon, lat, fare });
}

// --- Geographic projection (must mirror the chart's linear value axes) -----
const GRID = { left: 120, right: 260, top: 120, bottom: 110 };
const PLOT_W = size.width - GRID.left - GRID.right;
const PLOT_H = size.height - GRID.top - GRID.bottom;

function project(lon, lat) {
  const px = ((lon - LON_MIN) / (LON_MAX - LON_MIN)) * PLOT_W;
  const py = ((LAT_MAX - lat) / (LAT_MAX - LAT_MIN)) * PLOT_H;
  return [px, py];
}
function unproject(px, py) {
  const lon = LON_MIN + (px / PLOT_W) * (LON_MAX - LON_MIN);
  const lat = LAT_MAX - (py / PLOT_H) * (LAT_MAX - LAT_MIN);
  return [lon, lat];
}

// --- Hexagonal binning (pointy-top grid, nearest-center assignment) --------
const HEX_RADIUS = 30;
const HEX_DX = HEX_RADIUS * Math.sqrt(3);
const HEX_DY = HEX_RADIUS * 1.5;

function nearestHexCell(px, py) {
  const rowGuess = Math.round(py / HEX_DY);
  let bestRow = rowGuess;
  let bestCol = 0;
  let bestDist = Infinity;
  for (let rowOffset = -1; rowOffset <= 1; rowOffset++) {
    const row = rowGuess + rowOffset;
    const shift = (((row % 2) + 2) % 2 === 1) ? HEX_DX / 2 : 0;
    const colGuess = Math.round((px - shift) / HEX_DX);
    for (let colOffset = -1; colOffset <= 1; colOffset++) {
      const col = colGuess + colOffset;
      const cx = col * HEX_DX + shift;
      const cy = row * HEX_DY;
      const dist = (cx - px) ** 2 + (cy - py) ** 2;
      if (dist < bestDist) {
        bestDist = dist;
        bestRow = row;
        bestCol = col;
      }
    }
  }
  const shift = (((bestRow % 2) + 2) % 2 === 1) ? HEX_DX / 2 : 0;
  return { row: bestRow, col: bestCol, cx: bestCol * HEX_DX + shift, cy: bestRow * HEX_DY };
}

const bins = new Map();
for (const p of points) {
  const [px, py] = project(p.lon, p.lat);
  const cell = nearestHexCell(px, py);
  const key = `${cell.row}_${cell.col}`;
  let bin = bins.get(key);
  if (!bin) {
    bin = { count: 0, sumFare: 0, cx: cell.cx, cy: cell.cy };
    bins.set(key, bin);
  }
  bin.count += 1;
  bin.sumFare += p.fare;
}

const hexData = Array.from(bins.values()).map((bin) => {
  const [lon, lat] = unproject(bin.cx, bin.cy);
  return [lon, lat, bin.count, bin.sumFare / bin.count, bin.sumFare];
});
const maxCount = Math.max(...hexData.map((d) => d[2]));

// --- Ocean tint: fills the water side of the coastline (west of the coast) -
const OCEAN_POLYGON = [
  [LON_MIN, LAT_MAX],
  ...COASTLINE,
  [LON_MIN, LAT_MIN],
];
function renderOcean(params, api) {
  const shapePoints = OCEAN_POLYGON.map(([lon, lat]) => api.coord([lon, lat]));
  return {
    type: "polygon",
    shape: { points: shapePoints },
    style: { fill: t.palette[2], opacity: 0.2 },
    silent: true,
  };
}

// --- Custom series: draw one regular hexagon per occupied cell -------------
function renderHex(params, api) {
  const center = api.coord([api.value(0), api.value(1)]);
  const shapePoints = [];
  for (let i = 0; i < 6; i++) {
    const angle = (Math.PI / 180) * (60 * i - 90);
    shapePoints.push([
      center[0] + HEX_RADIUS * Math.cos(angle),
      center[1] + HEX_RADIUS * Math.sin(angle),
    ]);
  }
  return {
    type: "polygon",
    shape: { points: shapePoints },
    style: api.style({
      fill: api.visual("color"),
      stroke: t.pageBg,
      lineWidth: 1,
      opacity: 0.65,
    }),
  };
}

// --- Title (fontsize scaled to the ~67-char baseline) -----------------------
const titleText = "SF Taxi Pickups · hexbin-map-geographic · javascript · echarts · anyplot.ai";
const titleFontSize = Math.round(22 * Math.min(1, 67 / titleText.length));

// --- Init ---------------------------------------------------------------
const chart = echarts.init(document.getElementById("container"));

chart.setOption({
  animation: false,
  backgroundColor: "transparent",
  title: {
    text: titleText,
    left: "center",
    top: 24,
    textStyle: { color: t.ink, fontSize: titleFontSize, fontWeight: 500 },
  },
  tooltip: { trigger: "item" },
  grid: { left: GRID.left, right: GRID.right, top: GRID.top, bottom: GRID.bottom },
  visualMap: {
    type: "continuous",
    dimension: 2,
    min: 0,
    max: maxCount,
    orient: "vertical",
    right: 40,
    top: "middle",
    itemHeight: 320,
    itemWidth: 18,
    text: ["More pickups", "Fewer pickups"],
    textStyle: { color: t.inkSoft, fontSize: 14 },
    inRange: { color: t.seq },
    calculable: false,
  },
  xAxis: {
    type: "value",
    min: LON_MIN,
    max: LON_MAX,
    name: "Longitude",
    nameLocation: "middle",
    nameGap: 40,
    nameTextStyle: { color: t.inkSoft, fontSize: 14 },
    axisLabel: { color: t.inkSoft, fontSize: 13, formatter: (v) => `${v.toFixed(2)}°` },
    axisLine: { lineStyle: { color: t.inkSoft } },
    splitLine: { show: false },
  },
  yAxis: {
    type: "value",
    min: LAT_MIN,
    max: LAT_MAX,
    name: "Latitude",
    nameLocation: "middle",
    nameGap: 55,
    nameTextStyle: { color: t.inkSoft, fontSize: 14 },
    axisLabel: { color: t.inkSoft, fontSize: 13, formatter: (v) => `${v.toFixed(2)}°` },
    axisLine: { lineStyle: { color: t.inkSoft } },
    splitLine: { show: false },
  },
  series: [
    {
      name: "Ocean",
      type: "custom",
      coordinateSystem: "cartesian2d",
      clip: true,
      renderItem: renderOcean,
      data: [[LON_MIN, LAT_MIN]],
      encode: { x: 0, y: 1 },
      z: 0,
    },
    {
      name: "Coastline",
      type: "line",
      coordinateSystem: "cartesian2d",
      data: COASTLINE,
      showSymbol: false,
      smooth: 0.3,
      lineStyle: { color: t.inkSoft, width: 2, opacity: 0.45 },
      z: 1,
      silent: true,
    },
    {
      name: "Pickup density",
      type: "custom",
      coordinateSystem: "cartesian2d",
      clip: true,
      renderItem: renderHex,
      data: hexData,
      dimensions: ["lon", "lat", "count", "meanFare", "sumFare"],
      encode: { x: 0, y: 1, tooltip: [2, 3, 4] },
      tooltip: {
        formatter: (params) =>
          `Pickups: ${params.value[2]}<br/>Total fares: $${params.value[4].toFixed(2)}<br/>` +
          `Avg fare: $${params.value[3].toFixed(2)}<br/>` +
          `Center: ${params.value[1].toFixed(3)}°N, ${Math.abs(params.value[0]).toFixed(3)}°W`,
      },
      z: 3,
    },
  ],
});
Runnable source as JSON, for any HTTP client: https://api.anyplot.ai/specs/hexbin-map-geographic/echarts/code. Any spec id and library id listed in llms-full.txt fit the same URL shape; every URL below is complete and callable.
{
  "spec_id": "hexbin-map-geographic",
  "language": "javascript",
  "library": "echarts",
  "page": "https://anyplot.ai/hexbin-map-geographic/javascript/echarts",
  "hub": "https://anyplot.ai/hexbin-map-geographic",
  "code_json": "https://api.anyplot.ai/specs/hexbin-map-geographic/echarts/code",
  "spec_json": "https://api.anyplot.ai/specs/hexbin-map-geographic",
  "render_light_png": "https://storage.googleapis.com/anyplot-images/plots/hexbin-map-geographic/javascript/echarts/plot-light.png",
  "render_dark_png": "https://storage.googleapis.com/anyplot-images/plots/hexbin-map-geographic/javascript/echarts/plot-dark.png",
  "interactive_light_html": "https://storage.googleapis.com/anyplot-images/plots/hexbin-map-geographic/javascript/echarts/plot-light.html",
  "interactive_dark_html": "https://storage.googleapis.com/anyplot-images/plots/hexbin-map-geographic/javascript/echarts/plot-dark.html",
  "quality_score": 94.0,
  "license": "MIT",
  "guide": "https://anyplot.ai/llms.txt"
}
Part of Hexagonal Binning Map on anyplot.ai.