The same plot in 14 other libraries — JavaScript: D3.js, Apache ECharts, Highcharts, MUI X Charts; Python: Altair, Bokeh, lets-plot, Matplotlib, Plotly, plotnine, Pygal, Seaborn; R: ggplot2; Julia: Makie.jl. Compare all 15 side by side: Horizon Chart in Python, R, Julia and JavaScript.
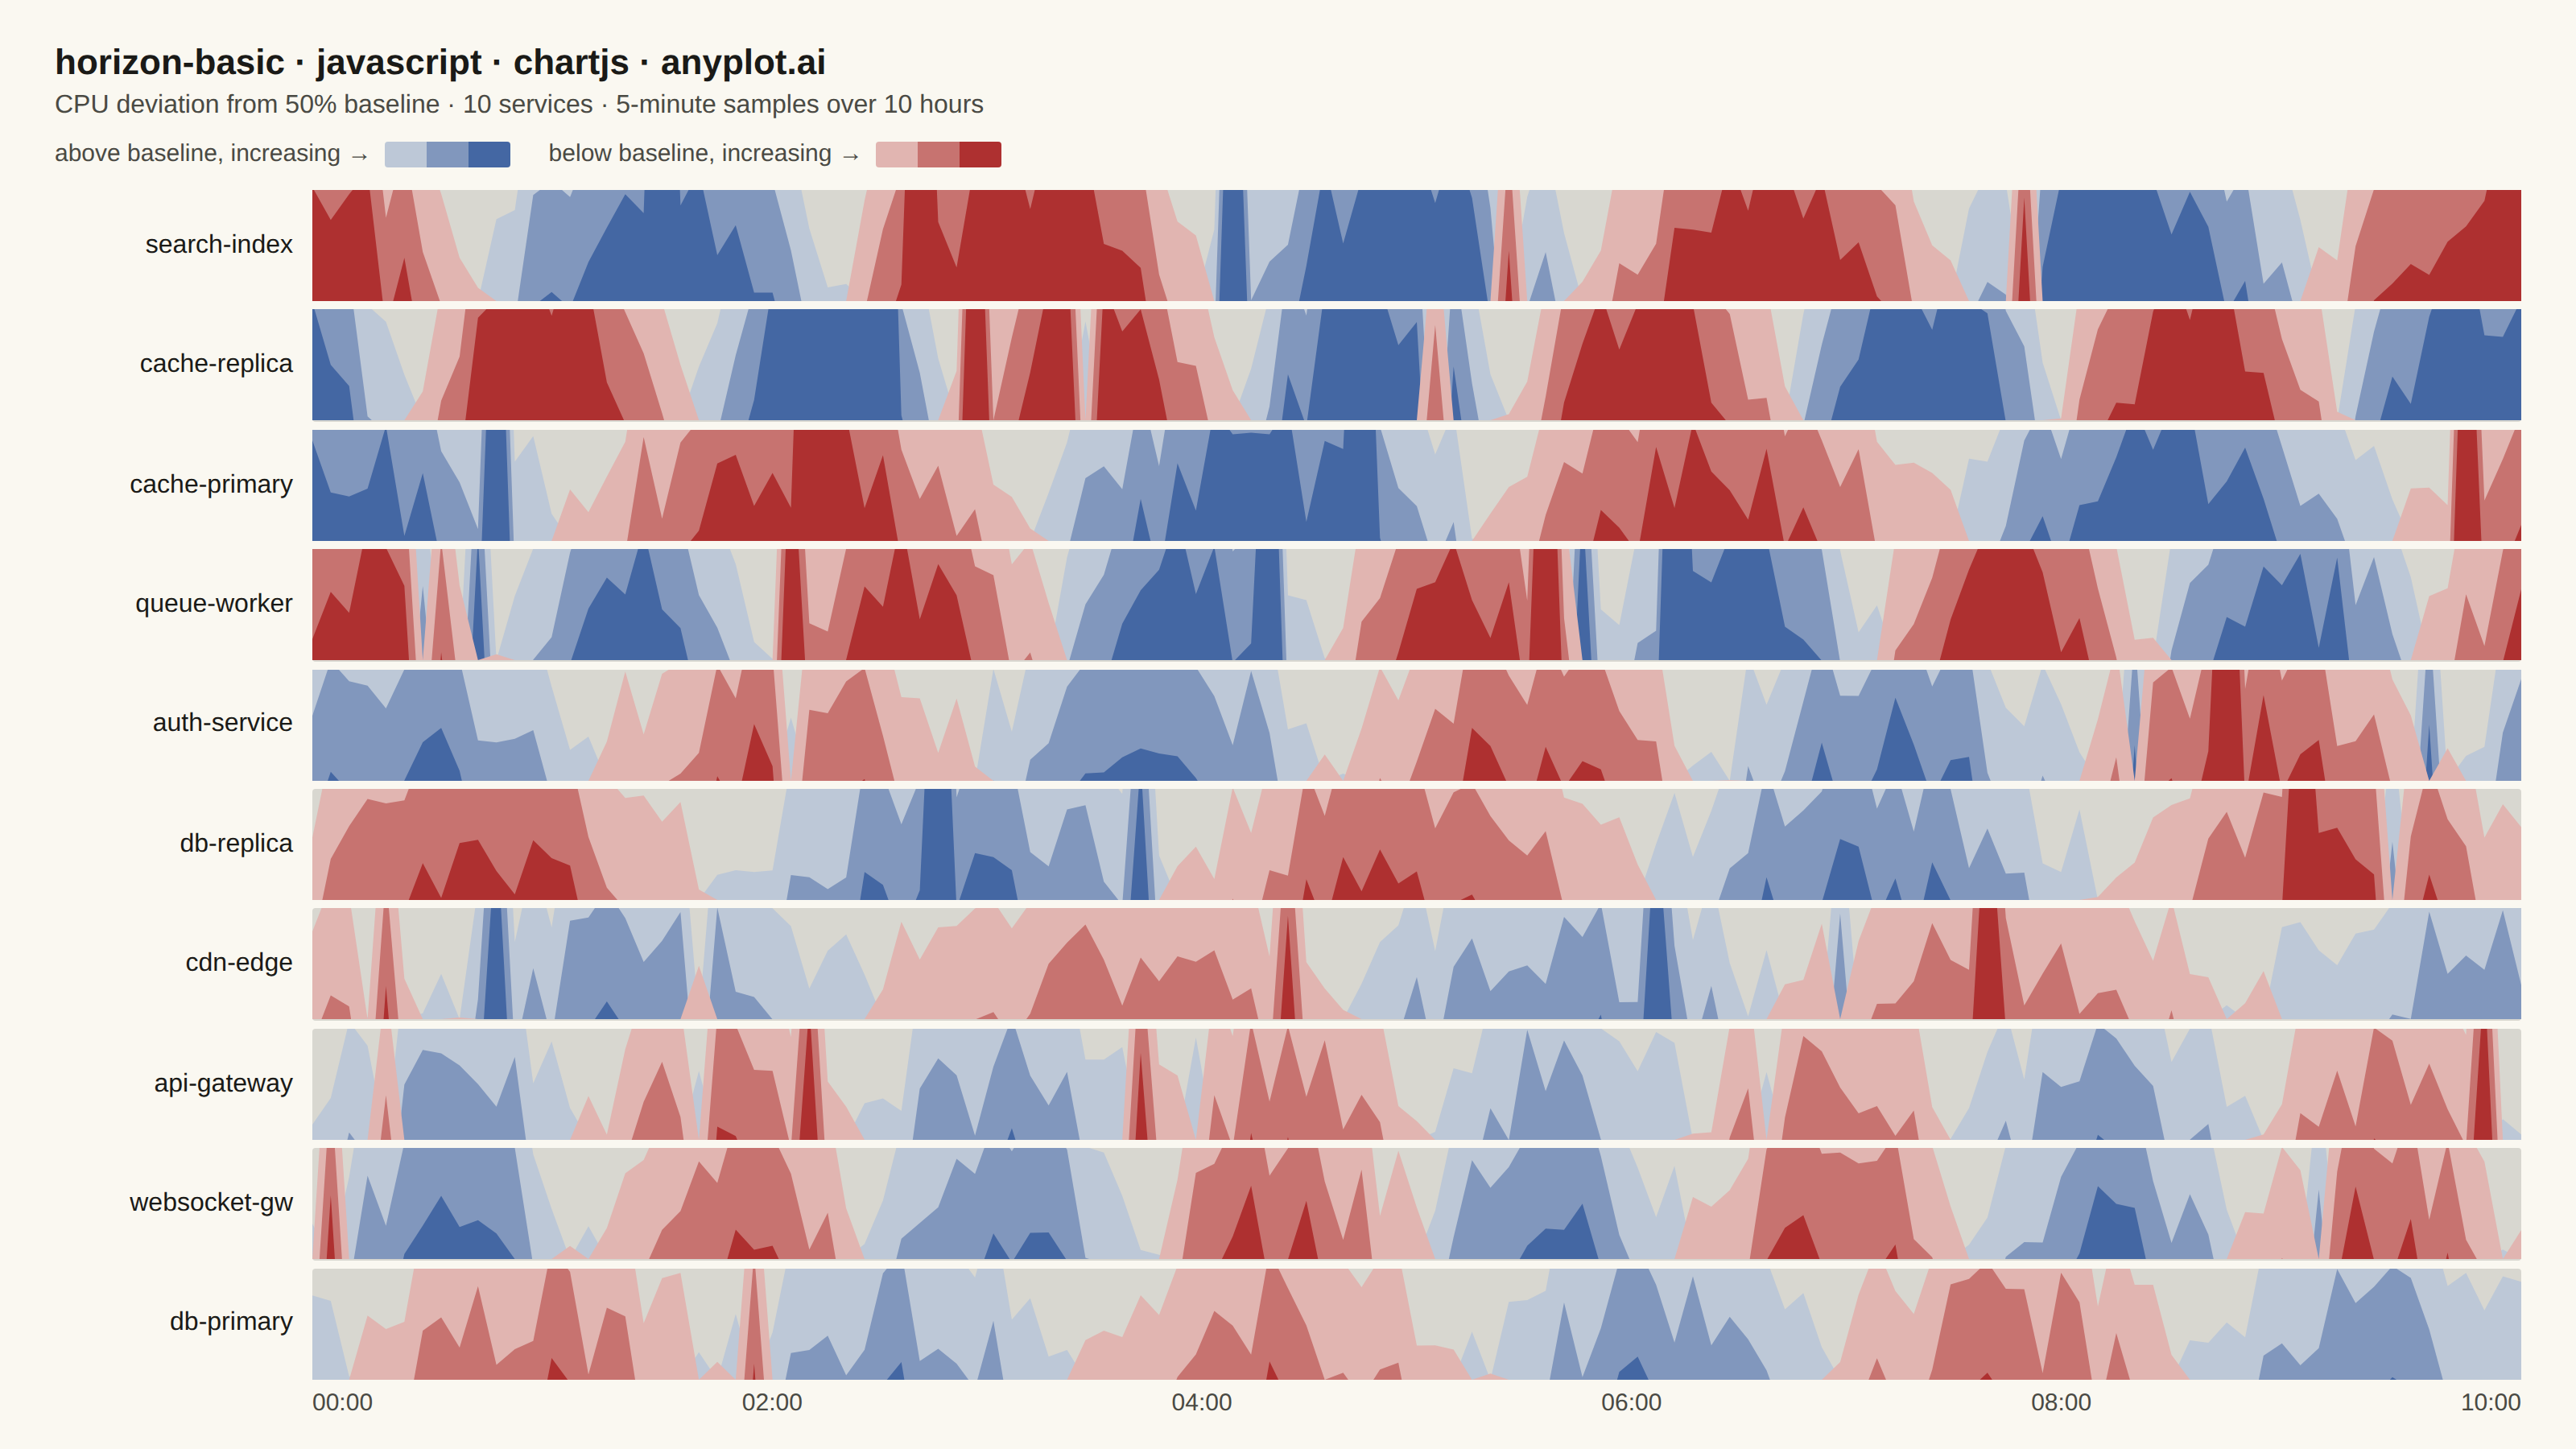
A horizon chart displays many time series compactly by folding values into color-coded bands, preserving local resolution while minimizing vertical space. It divides the y-axis into bands and uses color intensity to encode magnitude, allowing dozens of series to be compared in limited space. This technique is particularly effective when monitoring many metrics simultaneously where traditional line charts would become unreadable.
// anyplot.ai
// horizon-basic: Horizon Chart
// Library: chartjs 4.4.7 | JavaScript 22.23.2
// Quality: 88/100 | Created: 2026-08-18
//# anyplot-orientation: landscape

// Chart.js has no native "horizon chart" type, so this snippet builds one out
// of core primitives: for each service row and each magnitude band, a small
// transparent-background line chart is layered (via absolutely-positioned
// canvases) with the y-scale clamped to that band's [min, max) window and
// `fill: "start"`. A value inside the window fills proportionally; a value
// below it collapses to zero height; a value above it saturates the full
// band height (Chart.js/canvas clip the polygon at the row's pixel bounds).
// Stacking bands from low-index to high-index (drawn in that order) produces
// the classic "fold and overlay" horizon look with plain Chart.js Line charts
// — no custom draw plugin, no other library.

const t = window.ANYPLOT_TOKENS;
const SIZE = window.ANYPLOT_SIZE;

// --- Data (in-memory, deterministic) ----------------------------------------
// Ten backend services; CPU deviation (percentage points) from a 50% baseline,
// sampled every 5 minutes over a 10-hour window — 120 points per series.
function lcg(seed) {
  let s = seed >>> 0;
  return () => {
    s = (Math.imul(s, 1664525) + 1013904223) >>> 0;
    return s / 4294967296;
  };
}

const SERVICES = [
  "api-gateway",
  "auth-service",
  "cache-primary",
  "cache-replica",
  "db-primary",
  "db-replica",
  "queue-worker",
  "search-index",
  "cdn-edge",
  "websocket-gw",
];
const N_POINTS = 121; // 5-minute samples over a 10-hour window (00:00..10:00 inclusive)

const labels = Array.from({ length: N_POINTS }, (_, i) => {
  const totalMin = i * 5;
  const h = String(Math.floor(totalMin / 60)).padStart(2, "0");
  const m = String(totalMin % 60).padStart(2, "0");
  return `${h}:${m}`;
});

const series = SERVICES.map((name, k) => {
  const rnd = lcg(1000 + k * 37);
  const amplitude = 15 + (k % 4) * 5;
  const period = 30 + (k % 3) * 10;
  const phase = k * 0.7;
  const values = Array.from({ length: N_POINTS }, (_, i) => {
    const wave = amplitude * Math.sin((2 * Math.PI * i) / period + phase);
    const noise = (rnd() - 0.5) * 10;
    const spike = rnd() < 0.04 ? (rnd() < 0.5 ? 1 : -1) * amplitude * 1.4 : 0;
    return wave + noise + spike;
  });
  const peak = Math.max(...values.map(Math.abs));
  return { name, values, peak };
});

// Rows are ordered by peak magnitude (most volatile first) instead of the
// data-generation order — gives the dense 10-row layout a clear focal point
// at the top instead of leaving every row visually equal-weight.
const orderedSeries = [...series].sort((a, b) => b.peak - a.peak);

// --- Band color ramps (Imprint diverging, matching spec's "blue up / red down") ---
const N_BANDS = 3; // per polarity — 6 bands total, within the spec's "2-4 bands" note
const BAND_HEIGHT = 9; // deviation points per band

function hexToRgb(hex) {
  const n = parseInt(hex.slice(1), 16);
  return [(n >> 16) & 255, (n >> 8) & 255, n & 255];
}
function mix(hexA, hexB, frac) {
  const a = hexToRgb(hexA);
  const b = hexToRgb(hexB);
  const c = a.map((v, i) => Math.round(v + (b[i] - v) * frac));
  return `rgb(${c[0]}, ${c[1]}, ${c[2]})`;
}

const posColors = Array.from({ length: N_BANDS }, (_, i) => mix(t.pageBg, t.div[2], (i + 1) / N_BANDS));
const negColors = Array.from({ length: N_BANDS }, (_, i) => mix(t.pageBg, t.div[0], (i + 1) / N_BANDS));

// --- Layout ------------------------------------------------------------------
// Append a wrapper instead of restyling #container directly — the harness sets
// #container's own inline width/height/position, which a `cssText` overwrite
// would clobber and collapse the mount to its content height.
const root = document.createElement("div");
root.style.cssText = `box-sizing:border-box; width:100%; height:100%; padding:26px 34px 20px 34px; display:flex; flex-direction:column; font-family:inherit;`;
document.getElementById("container").appendChild(root);

const title = document.createElement("div");
title.textContent = "horizon-basic · javascript · chartjs · anyplot.ai";
title.style.cssText = `color:${t.ink}; font-size:22px; font-weight:600; margin-bottom:5px;`;
root.appendChild(title);

const subtitle = document.createElement("div");
subtitle.textContent = "CPU deviation from 50% baseline · 10 services · 5-minute samples over 10 hours";
subtitle.style.cssText = `color:${t.inkSoft}; font-size:16px; margin-bottom:12px;`;
root.appendChild(subtitle);

// Small legend explaining the folded color-intensity bands.
function legendGroup(label, colors) {
  const wrap = document.createElement("div");
  wrap.style.cssText = "display:flex; align-items:center; gap:8px;";
  const text = document.createElement("span");
  text.textContent = label;
  wrap.appendChild(text);
  const bar = document.createElement("div");
  bar.style.cssText = "display:flex; height:16px; border-radius:2px; overflow:hidden;";
  colors.forEach((c) => {
    const seg = document.createElement("div");
    seg.style.cssText = `width:26px; height:100%; background:${c};`;
    bar.appendChild(seg);
  });
  wrap.appendChild(bar);
  return wrap;
}
const legend = document.createElement("div");
legend.style.cssText = `display:flex; align-items:center; gap:24px; margin-bottom:14px; font-size:15px; color:${t.inkSoft};`;
legend.appendChild(legendGroup("above baseline, increasing →", posColors));
legend.appendChild(legendGroup("below baseline, increasing →", negColors));
root.appendChild(legend);

const LABEL_WIDTH = 160;

const rowsWrap = document.createElement("div");
rowsWrap.style.cssText = "display:flex; flex-direction:column; flex:1 1 auto; min-height:0; gap:5px;";
root.appendChild(rowsWrap);

function makeBandLayer(parent, values, bandIndex, color) {
  const canvas = document.createElement("canvas");
  canvas.style.cssText = "position:absolute; inset:0; width:100%; height:100%;";
  parent.appendChild(canvas);
  new Chart(canvas, {
    type: "line",
    data: {
      labels,
      datasets: [
        {
          data: values,
          borderWidth: 0,
          fill: "start",
          backgroundColor: color,
          pointRadius: 0,
          tension: 0,
        },
      ],
    },
    options: {
      responsive: true,
      maintainAspectRatio: false,
      animation: false,
      layout: { padding: 0 },
      plugins: { legend: { display: false }, title: { display: false }, tooltip: { display: false } },
      scales: {
        x: { type: "category", offset: false, display: false, grid: { display: false } },
        y: {
          min: bandIndex * BAND_HEIGHT,
          max: (bandIndex + 1) * BAND_HEIGHT,
          display: false,
          grid: { display: false },
        },
      },
    },
  });
}

orderedSeries.forEach((s) => {
  const row = document.createElement("div");
  row.style.cssText = "display:flex; align-items:stretch; flex:1 1 auto; min-height:0;";

  const label = document.createElement("div");
  label.textContent = s.name;
  label.style.cssText = `flex:0 0 ${LABEL_WIDTH}px; width:${LABEL_WIDTH}px; display:flex; align-items:center; justify-content:flex-end; color:${t.ink}; font-size:16px; padding-right:12px; overflow:hidden; text-overflow:ellipsis; white-space:nowrap;`;
  row.appendChild(label);

  const plotWrap = document.createElement("div");
  plotWrap.style.cssText = `position:relative; flex:1 1 auto; min-width:0; background:${t.grid}; border-radius:2px;`;
  row.appendChild(plotWrap);

  const posValues = s.values.map((v) => Math.max(v, 0));
  const negValues = s.values.map((v) => Math.max(-v, 0));

  for (let i = 0; i < N_BANDS; i++) makeBandLayer(plotWrap, posValues, i, posColors[i]);
  for (let i = 0; i < N_BANDS; i++) makeBandLayer(plotWrap, negValues, i, negColors[i]);

  rowsWrap.appendChild(row);
});

// --- X-axis time labels (shared across all rows, drawn once at the bottom) --
const axisRow = document.createElement("div");
axisRow.style.cssText = "display:flex; margin-top:6px;";
const axisSpacer = document.createElement("div");
axisSpacer.style.cssText = `flex:0 0 ${LABEL_WIDTH}px;`;
axisRow.appendChild(axisSpacer);
const axisLabels = document.createElement("div");
axisLabels.style.cssText = `flex:1 1 auto; display:flex; justify-content:space-between; color:${t.inkSoft}; font-size:15px;`;
const N_TICKS = 6;
for (let i = 0; i < N_TICKS; i++) {
  const idx = Math.round((i / (N_TICKS - 1)) * (N_POINTS - 1));
  const span = document.createElement("span");
  span.textContent = labels[idx];
  axisLabels.appendChild(span);
}
axisRow.appendChild(axisLabels);
root.appendChild(axisRow);
Runnable source as JSON, for any HTTP client: https://api.anyplot.ai/specs/horizon-basic/chartjs/code. Any spec id and library id listed in llms-full.txt fit the same URL shape; every URL below is complete and callable.
{
  "spec_id": "horizon-basic",
  "language": "javascript",
  "library": "chartjs",
  "page": "https://anyplot.ai/horizon-basic/javascript/chartjs",
  "hub": "https://anyplot.ai/horizon-basic",
  "code_json": "https://api.anyplot.ai/specs/horizon-basic/chartjs/code",
  "spec_json": "https://api.anyplot.ai/specs/horizon-basic",
  "render_light_png": "https://storage.googleapis.com/anyplot-images/plots/horizon-basic/javascript/chartjs/plot-light.png",
  "render_dark_png": "https://storage.googleapis.com/anyplot-images/plots/horizon-basic/javascript/chartjs/plot-dark.png",
  "interactive_light_html": "https://storage.googleapis.com/anyplot-images/plots/horizon-basic/javascript/chartjs/plot-light.html",
  "interactive_dark_html": "https://storage.googleapis.com/anyplot-images/plots/horizon-basic/javascript/chartjs/plot-dark.html",
  "quality_score": 88.0,
  "license": "MIT",
  "guide": "https://anyplot.ai/llms.txt"
}
Part of Horizon Chart on anyplot.ai.