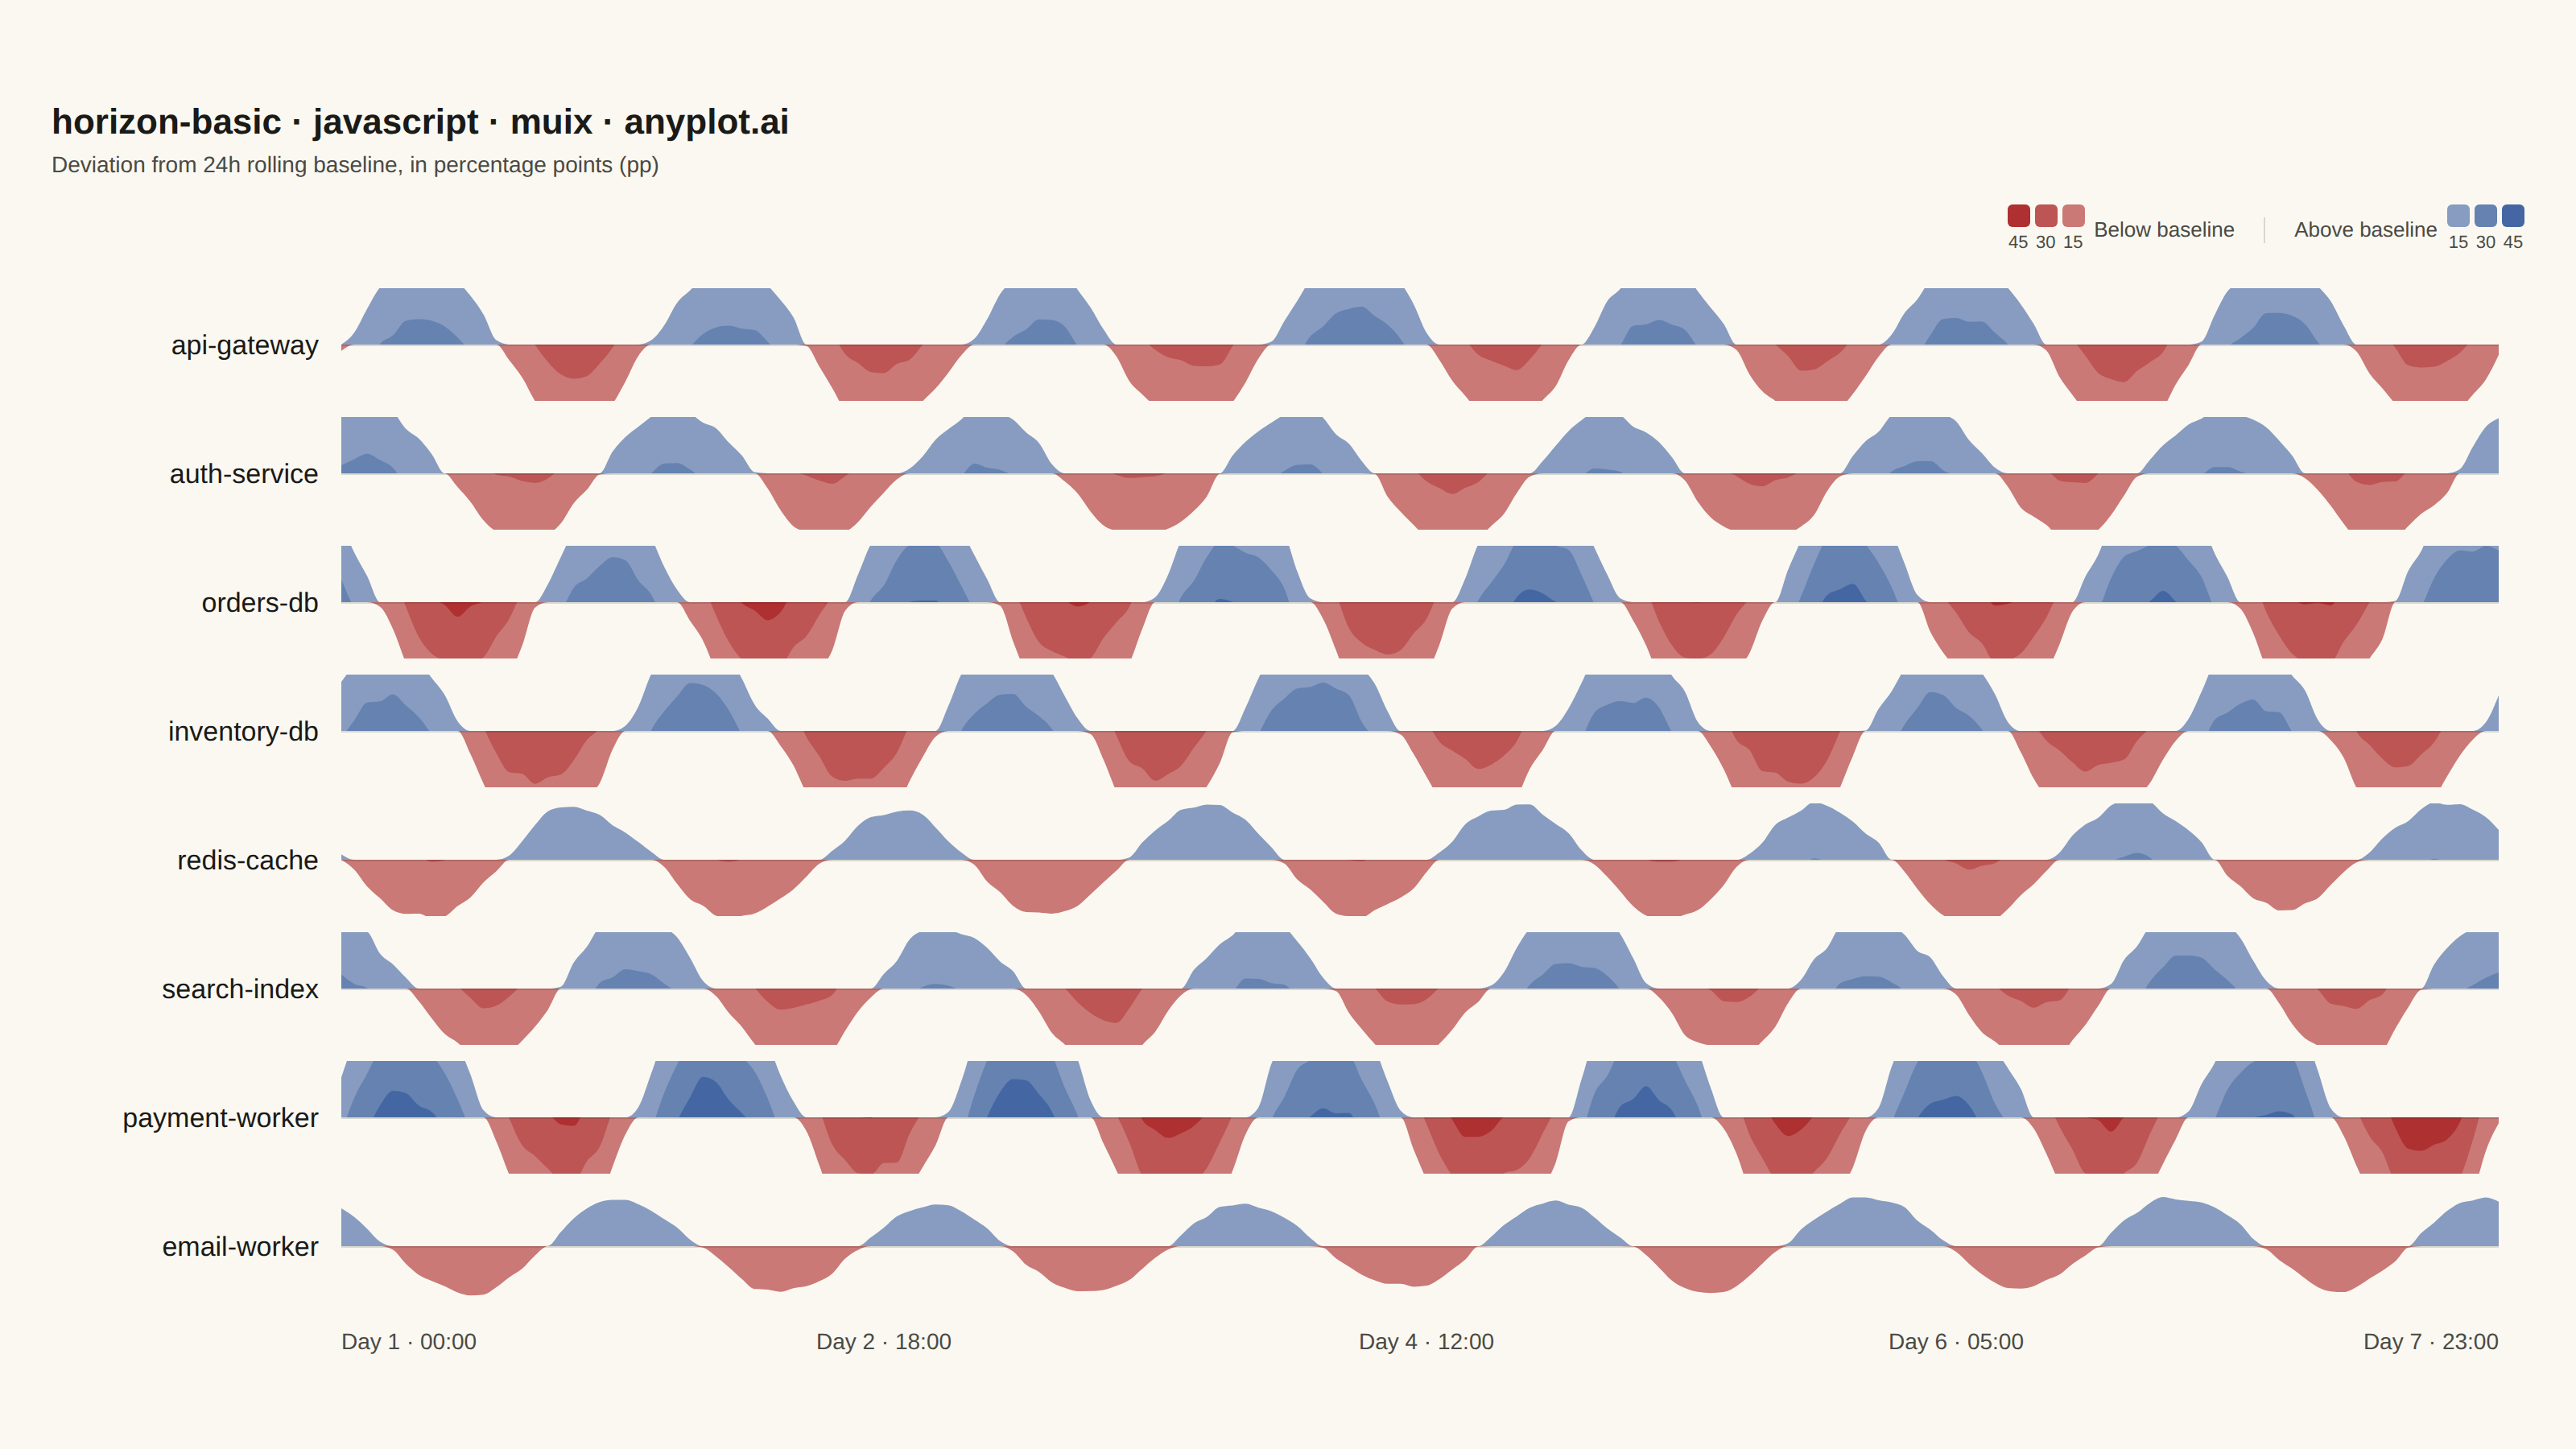
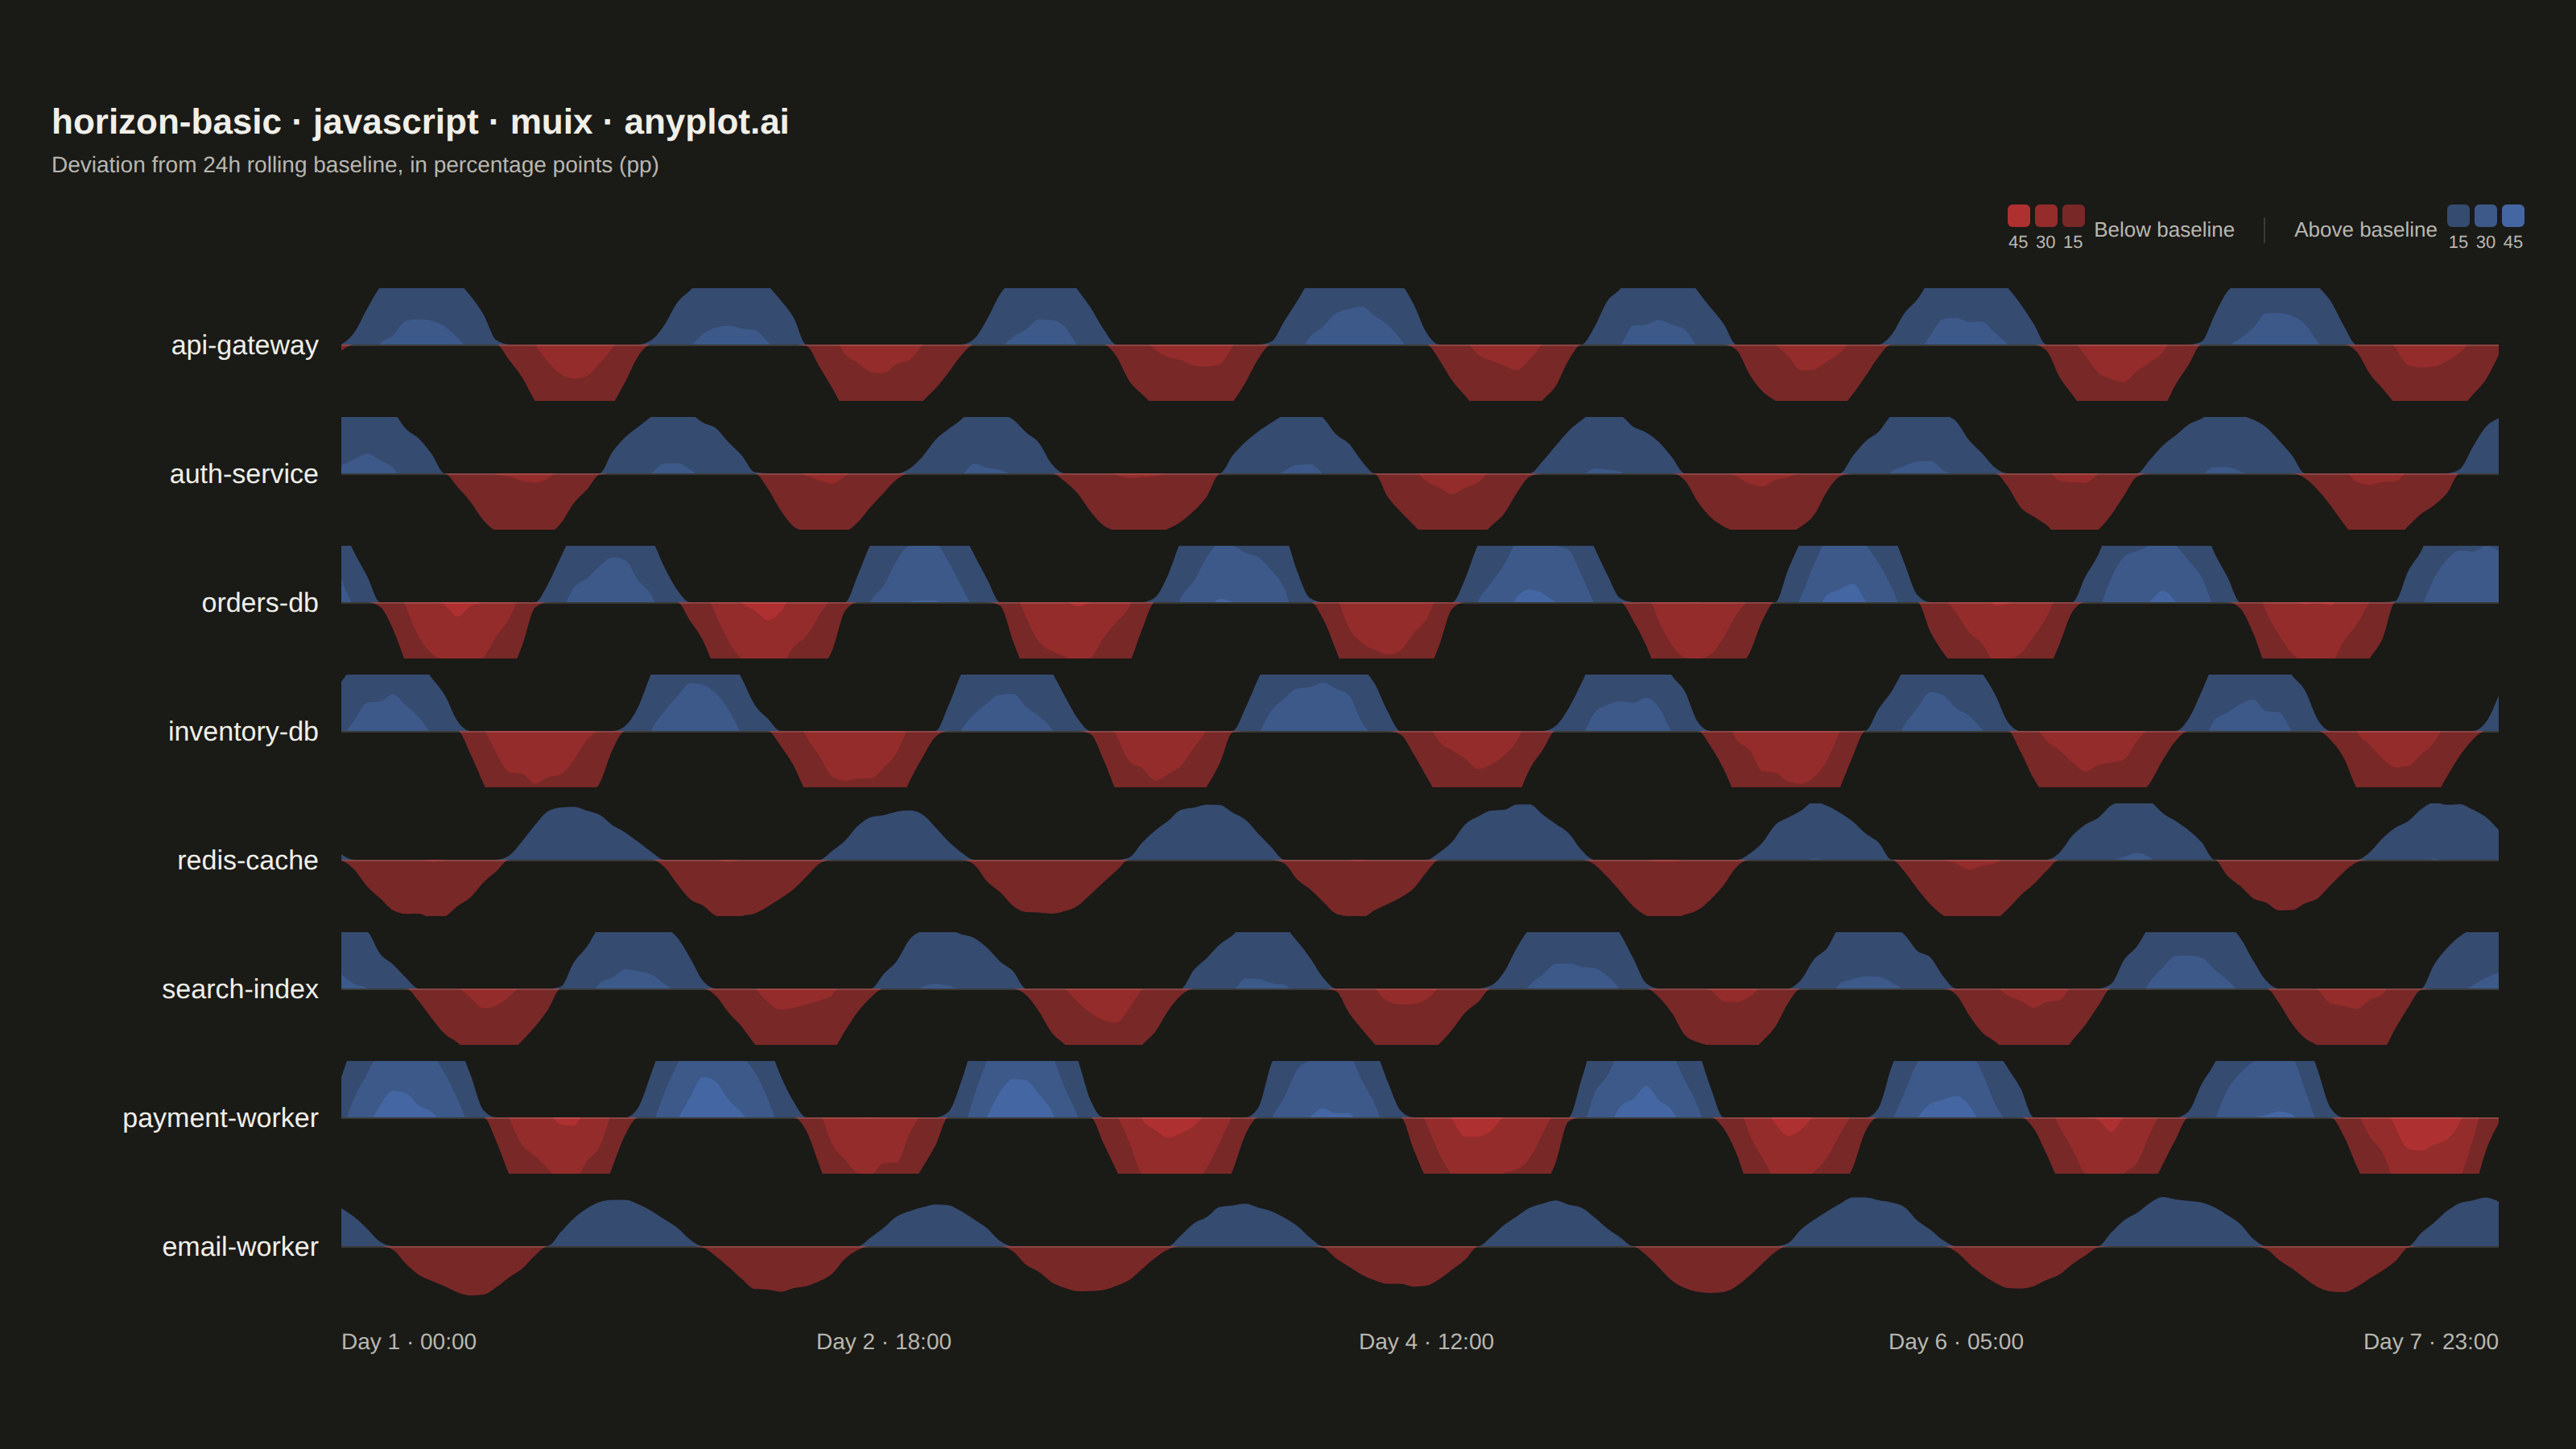
The same plot in 14 other libraries — JavaScript: Chart.js, D3.js, Apache ECharts, Highcharts; Python: Altair, Bokeh, lets-plot, Matplotlib, Plotly, plotnine, Pygal, Seaborn; R: ggplot2; Julia: Makie.jl. Compare all 15 side by side: Horizon Chart in Python, R, Julia and JavaScript.
A horizon chart displays many time series compactly by folding values into color-coded bands, preserving local resolution while minimizing vertical space. It divides the y-axis into bands and uses color intensity to encode magnitude, allowing dozens of series to be compared in limited space. This technique is particularly effective when monitoring many metrics simultaneously where traditional line charts would become unreadable.
// anyplot.ai
// horizon-basic: Horizon Chart
// Library: muix 7.29.1 | JavaScript 22.23.2
// Quality: 85/100 | Created: 2026-08-20
import { ChartContainer } from "@mui/x-charts/ChartContainer";
import { AreaPlot } from "@mui/x-charts/LineChart";
import { Box, Typography } from "@mui/material";

const t = window.ANYPLOT_TOKENS;
const SIZE = window.ANYPLOT_SIZE;

// --- Layout constants (CSS px in the mount's coordinate space) -------------
const OUTER_PAD = 32;
const LABEL_COL_WIDTH = 180;
const RIGHT_PAD = 16;
const CHART_WIDTH = SIZE.width - OUTER_PAD * 2 - LABEL_COL_WIDTH - RIGHT_PAD;

const ROW_HEIGHT = 70;
const HALF_HEIGHT = ROW_HEIGHT / 2;
const ROW_GAP = 10;
const BAND_COUNT = 3;
const MAX_DEVIATION = 45; // percentage points from the 24h rolling baseline
const POINT_COUNT = 168; // hourly readings over 7 days
const ZERO_MARGIN = { top: 0, right: 0, bottom: 0, left: 0 };
// Upper bound of each band's percentage-point range (e.g. 0-15 / 15-30 / 30-45).
const BAND_THRESHOLDS = Array.from({ length: BAND_COUNT }, (_, k) => Math.round((MAX_DEVIATION * (k + 1)) / BAND_COUNT));

const TITLE = "horizon-basic · javascript · muix · anyplot.ai";
const TITLE_FONT_SIZE = Math.round(22 * (TITLE.length > 67 ? 67 / TITLE.length : 1));

// --- Data (in-memory, deterministic) ----------------------------------------
// Fixed-seed LCG — the browser has no seeded RNG (see prompts/library/muix.md
// "Reproducibility").
function mulberry32(seed) {
  let s = seed;
  return () => {
    s = (s + 0x6d2b79f5) | 0;
    let v = Math.imul(s ^ (s >>> 15), 1 | s);
    v = (v + Math.imul(v ^ (v >>> 7), 61 | v)) ^ v;
    return ((v ^ (v >>> 14)) >>> 0) / 4294967296;
  };
}

// Deviation of a server metric (e.g. CPU load) from its 24h rolling baseline:
// a daily sine cycle plus a mean-reverting random walk, clamped to the domain.
function seriesValues(amplitude, phase, walkScale, seed) {
  const rand = mulberry32(seed);
  let walk = 0;
  const values = [];
  for (let i = 0; i < POINT_COUNT; i += 1) {
    walk += (rand() - 0.5) * walkScale * 0.6 - walk * 0.15;
    const daily = amplitude * Math.sin((2 * Math.PI * i) / 24 + phase);
    values.push(Math.max(-MAX_DEVIATION, Math.min(MAX_DEVIATION, daily + walk)));
  }
  return values;
}

const SERVERS = [
  { name: "api-gateway", amplitude: 22, phase: 0.0, walkScale: 6, seed: 1013 },
  { name: "auth-service", amplitude: 18, phase: 1.1, walkScale: 5, seed: 1069 },
  { name: "orders-db", amplitude: 30, phase: 2.4, walkScale: 9, seed: 1151 },
  { name: "inventory-db", amplitude: 26, phase: 0.6, walkScale: 8, seed: 1223 },
  { name: "redis-cache", amplitude: 15, phase: 3.0, walkScale: 4, seed: 1291 },
  { name: "search-index", amplitude: 20, phase: 1.8, walkScale: 6, seed: 1373 },
  { name: "payment-worker", amplitude: 35, phase: 0.3, walkScale: 10, seed: 1447 },
  { name: "email-worker", amplitude: 12, phase: 2.1, walkScale: 3, seed: 1523 },
];

const X_INDEX = Array.from({ length: POINT_COUNT }, (_, i) => i);

const SERIES_DATA = SERVERS.map((server) => {
  const values = seriesValues(server.amplitude, server.phase, server.walkScale, server.seed);
  return {
    name: server.name,
    positive: values.map((v) => Math.max(v, 0)),
    negative: values.map((v) => Math.max(-v, 0)),
  };
});

// --- Imprint diverging colours — mirrored positive/negative bands ----------
// t.div = [red pole, page-bg midpoint, blue pole] (see default-style-guide.md
// "Continuous Data"). Bands fade from the midpoint toward the pole so the
// folded magnitude reads as increasing colour intensity.
function mixHex(hexA, hexB, ratio) {
  const a = parseInt(hexA.slice(1), 16);
  const b = parseInt(hexB.slice(1), 16);
  const channel = (shift) => {
    const va = (a >> shift) & 255;
    const vb = (b >> shift) & 255;
    return Math.round(va + (vb - va) * ratio);
  };
  const [r, g, bl] = [16, 8, 0].map(channel);
  return `#${[r, g, bl].map((c) => c.toString(16).padStart(2, "0")).join("")}`;
}

function bandColors(pole) {
  return Array.from({ length: BAND_COUNT }, (_, k) => {
    const strength = 0.45 + 0.55 * ((k + 1) / BAND_COUNT);
    return mixHex(t.div[1], pole, strength);
  });
}

const POS_BAND_COLORS = bandColors(t.div[2]); // above baseline — blue
const NEG_BAND_COLORS = bandColors(t.div[0]); // below baseline — red

// --- Chart geometry ----------------------------------------------------------
// Classic CSS "horizon chart" fold: every band layer renders the SAME area
// (baseline 0 → value) at full virtual height (HALF_HEIGHT * BAND_COUNT), then
// is shifted down by `bandIndex * HALF_HEIGHT` and clipped to one HALF_HEIGHT
// window. Lower bands are always fully covered wherever the value reaches
// them, so stacking band 0 → band N-1 in DOM order (later = on top) reveals
// exactly the highest reached band's colour at each point — no opacity
// blending needed.
function BandStack({ values, colors }) {
  return (
    <>
      {colors.map((color, bandIndex) => (
        <Box
          key={bandIndex}
          sx={{
            position: "absolute",
            left: 0,
            bottom: 0,
            width: CHART_WIDTH,
            height: HALF_HEIGHT * BAND_COUNT,
            transform: `translateY(${bandIndex * HALF_HEIGHT}px)`,
          }}
        >
          <ChartContainer
            width={CHART_WIDTH}
            height={HALF_HEIGHT * BAND_COUNT}
            margin={ZERO_MARGIN}
            disableAxisListener
            series={[
              {
                type: "line",
                data: values,
                area: true,
                baseline: 0,
                curve: "monotoneX",
                color,
              },
            ]}
            xAxis={[{ scaleType: "linear", data: X_INDEX, min: 0, max: POINT_COUNT - 1, domainLimit: "strict" }]}
            yAxis={[{ scaleType: "linear", min: 0, max: MAX_DEVIATION, domainLimit: "strict" }]}
          >
            {/* slotProps forces the exact Imprint hex — AreaPlot's default style brightens `color` */}
            <AreaPlot skipAnimation slotProps={{ area: { style: { fill: color, fillOpacity: 1 } } }} />
          </ChartContainer>
        </Box>
      ))}
    </>
  );
}

function HorizonRow({ name, positive, negative }) {
  return (
    <Box sx={{ display: "flex", alignItems: "center", height: ROW_HEIGHT }}>
      <Box sx={{ width: LABEL_COL_WIDTH, pr: "14px", boxSizing: "border-box", textAlign: "right" }}>
        <Typography
          sx={{
            m: 0,
            fontSize: 17,
            fontWeight: 500,
            color: t.ink,
            whiteSpace: "nowrap",
            overflow: "hidden",
            textOverflow: "ellipsis",
          }}
        >
          {name}
        </Typography>
      </Box>
      <Box sx={{ position: "relative", width: CHART_WIDTH, height: ROW_HEIGHT }}>
        <Box sx={{ position: "absolute", top: 0, left: 0, width: CHART_WIDTH, height: HALF_HEIGHT, overflow: "hidden" }}>
          <BandStack values={positive} colors={POS_BAND_COLORS} />
        </Box>
        <Box
          sx={{
            position: "absolute",
            top: HALF_HEIGHT,
            left: 0,
            width: CHART_WIDTH,
            height: HALF_HEIGHT,
            overflow: "hidden",
            transform: "scaleY(-1)",
          }}
        >
          <BandStack values={negative} colors={NEG_BAND_COLORS} />
        </Box>
        {/* baseline (0 deviation) reference rule */}
        <Box sx={{ position: "absolute", top: HALF_HEIGHT, left: 0, width: CHART_WIDTH, height: "1px", bgcolor: t.grid }} />
      </Box>
    </Box>
  );
}

function LegendSwatches({ colors, thresholds, label, align }) {
  return (
    <Box sx={{ display: "flex", alignItems: "center", gap: "6px", flexDirection: align === "left" ? "row-reverse" : "row" }}>
      <Typography sx={{ m: 0, fontSize: 13, color: t.inkSoft, whiteSpace: "nowrap" }}>{label}</Typography>
      <Box sx={{ display: "flex", flexDirection: "column", alignItems: "center", gap: "2px" }}>
        <Box sx={{ display: "flex", gap: "3px" }}>
          {colors.map((color, i) => (
            <Box key={i} sx={{ width: 14, height: 14, borderRadius: "3px", bgcolor: color }} />
          ))}
        </Box>
        <Box sx={{ display: "flex", gap: "3px" }}>
          {thresholds.map((th, i) => (
            <Typography key={i} sx={{ m: 0, fontSize: 11, color: t.inkSoft, width: 14, textAlign: "center", whiteSpace: "nowrap" }}>
              {th}
            </Typography>
          ))}
        </Box>
      </Box>
    </Box>
  );
}

function formatTick(index) {
  const day = Math.floor(index / 24) + 1;
  const hour = index % 24;
  return `Day ${day} · ${String(hour).padStart(2, "0")}:00`;
}

const TICKS = [0, Math.round((POINT_COUNT - 1) / 4), Math.round((POINT_COUNT - 1) / 2), Math.round((3 * (POINT_COUNT - 1)) / 4), POINT_COUNT - 1];

export default function Chart() {
  return (
    <Box
      sx={{
        width: SIZE.width,
        height: SIZE.height,
        boxSizing: "border-box",
        p: `${OUTER_PAD}px`,
        display: "flex",
        flexDirection: "column",
        justifyContent: "center",
      }}
    >
      <Typography sx={{ m: 0, fontSize: TITLE_FONT_SIZE, fontWeight: 600, color: t.ink }}>{TITLE}</Typography>
      <Typography sx={{ m: 0, mb: "14px", fontSize: 14, color: t.inkSoft }}>
        Deviation from 24h rolling baseline, in percentage points (pp)
      </Typography>

      <Box sx={{ display: "flex", justifyContent: "flex-end", alignItems: "center", gap: "18px", mb: "20px" }}>
        <LegendSwatches
          label="Below baseline"
          colors={[...NEG_BAND_COLORS].reverse()}
          thresholds={[...BAND_THRESHOLDS].reverse()}
          align="left"
        />
        <Box sx={{ width: "1px", height: "16px", bgcolor: t.grid }} />
        <LegendSwatches label="Above baseline" colors={POS_BAND_COLORS} thresholds={BAND_THRESHOLDS} align="right" />
      </Box>

      <Box>
        {SERIES_DATA.map((series, i) => (
          <Box key={series.name} sx={{ mb: i === SERIES_DATA.length - 1 ? 0 : `${ROW_GAP}px` }}>
            <HorizonRow name={series.name} positive={series.positive} negative={series.negative} />
          </Box>
        ))}
      </Box>

      <Box sx={{ display: "flex", mt: "14px" }}>
        <Box sx={{ width: LABEL_COL_WIDTH, flexShrink: 0 }} />
        <Box sx={{ position: "relative", width: CHART_WIDTH, height: "18px" }}>
          {TICKS.map((index) => (
            <Typography
              key={index}
              component="span"
              sx={{
                m: 0,
                position: "absolute",
                left: `${(index / (POINT_COUNT - 1)) * 100}%`,
                transform: index === 0 ? "none" : index === POINT_COUNT - 1 ? "translateX(-100%)" : "translateX(-50%)",
                fontSize: 14,
                color: t.inkSoft,
                whiteSpace: "nowrap",
              }}
            >
              {formatTick(index)}
            </Typography>
          ))}
        </Box>
      </Box>
    </Box>
  );
}
Runnable source as JSON, for any HTTP client: https://api.anyplot.ai/specs/horizon-basic/muix/code. Any spec id and library id listed in llms-full.txt fit the same URL shape; every URL below is complete and callable.
{
  "spec_id": "horizon-basic",
  "language": "javascript",
  "library": "muix",
  "page": "https://anyplot.ai/horizon-basic/javascript/muix",
  "hub": "https://anyplot.ai/horizon-basic",
  "code_json": "https://api.anyplot.ai/specs/horizon-basic/muix/code",
  "spec_json": "https://api.anyplot.ai/specs/horizon-basic",
  "render_light_png": "https://storage.googleapis.com/anyplot-images/plots/horizon-basic/javascript/muix/plot-light.png",
  "render_dark_png": "https://storage.googleapis.com/anyplot-images/plots/horizon-basic/javascript/muix/plot-dark.png",
  "interactive_light_html": "https://storage.googleapis.com/anyplot-images/plots/horizon-basic/javascript/muix/plot-light.html",
  "interactive_dark_html": "https://storage.googleapis.com/anyplot-images/plots/horizon-basic/javascript/muix/plot-dark.html",
  "quality_score": 85.0,
  "license": "MIT",
  "guide": "https://anyplot.ai/llms.txt"
}
Part of Horizon Chart on anyplot.ai.