The same plot in 14 other libraries — JavaScript: Chart.js, D3.js, Highcharts, MUI X Charts; Python: Altair, Bokeh, lets-plot, Matplotlib, Plotly, plotnine, Pygal, Seaborn; R: ggplot2; Julia: Makie.jl. Compare all 15 side by side: Horizon Chart in Python, R, Julia and JavaScript.
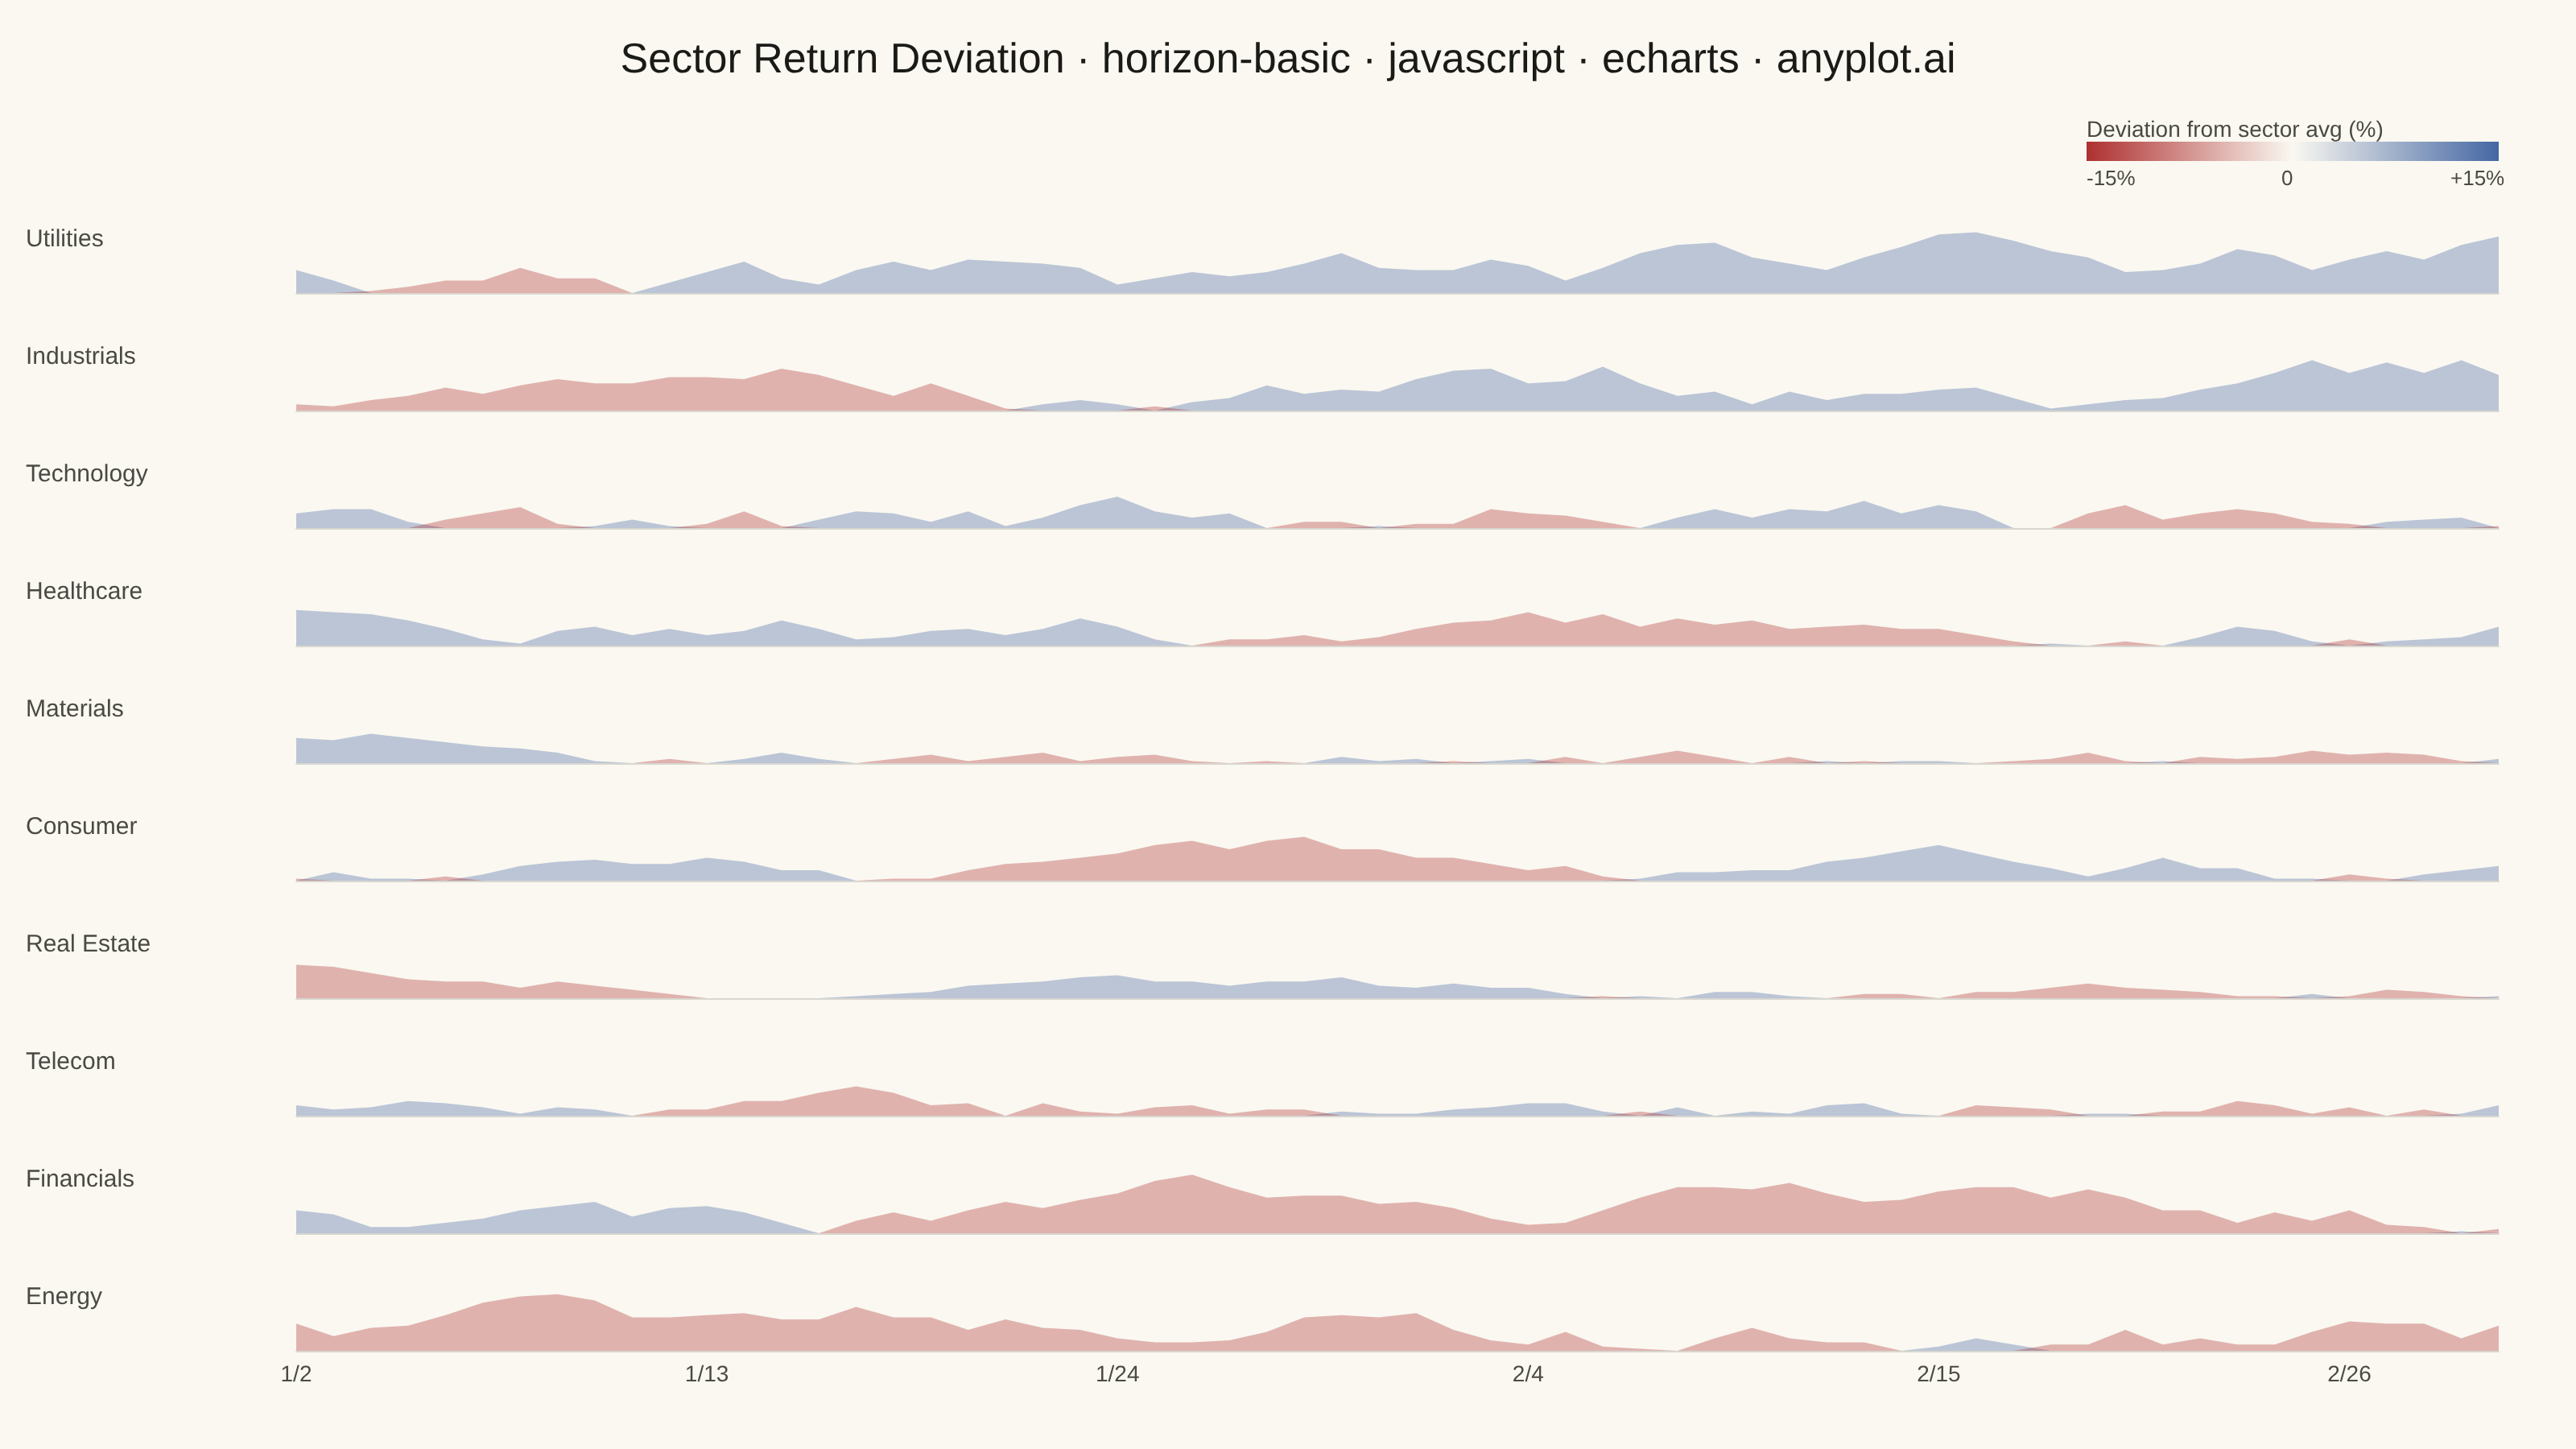
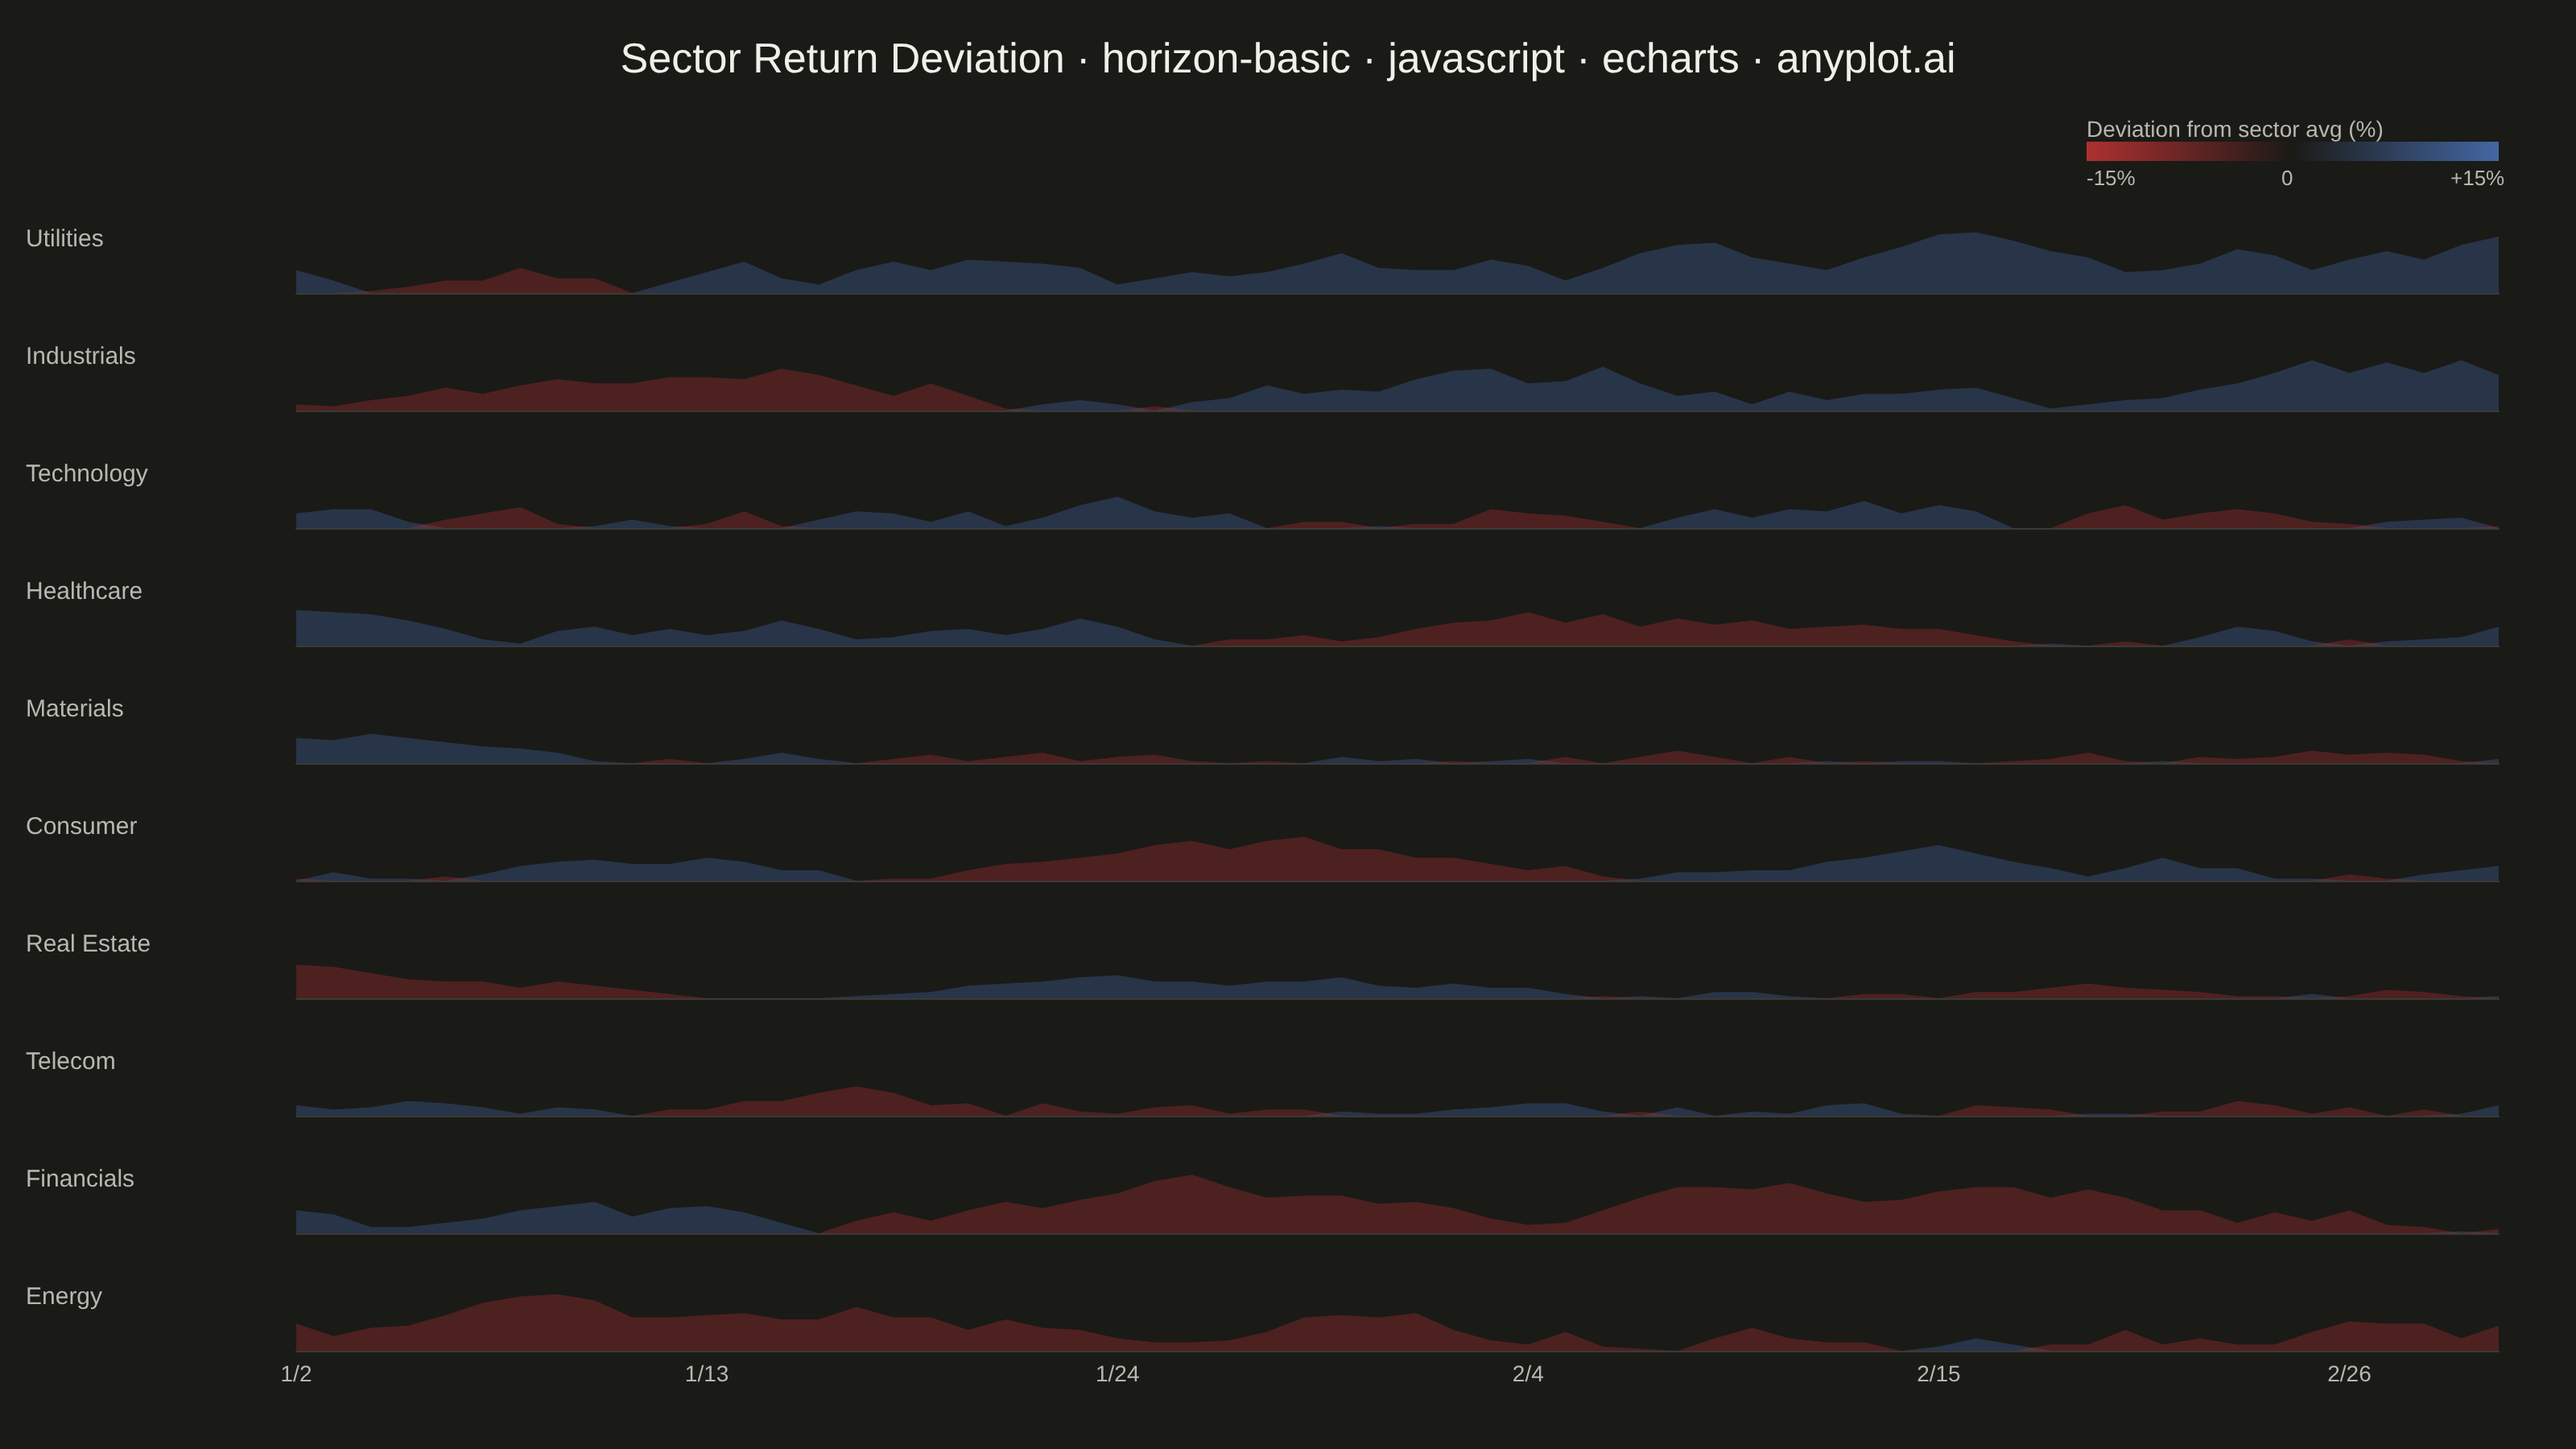
A horizon chart displays many time series compactly by folding values into color-coded bands, preserving local resolution while minimizing vertical space. It divides the y-axis into bands and uses color intensity to encode magnitude, allowing dozens of series to be compared in limited space. This technique is particularly effective when monitoring many metrics simultaneously where traditional line charts would become unreadable.
// anyplot.ai
// horizon-basic: Horizon Chart
// Library: echarts 6.1.0 | JavaScript 22.23.2
// Quality: 91/100 | Created: 2026-08-18

//# anyplot-orientation: landscape
const t = window.ANYPLOT_TOKENS;
const size = window.ANYPLOT_SIZE;

// --- Data (in-memory, deterministic LCG) ------------------------------------
const sectorNames = [
  "Technology", "Energy", "Healthcare", "Financials", "Industrials",
  "Materials", "Utilities", "Consumer", "Real Estate", "Telecom",
];
const N = sectorNames.length;
const T = 60;

let seed = 42;
const rand = () => {
  seed = (seed * 1103515245 + 12345) & 0x7fffffff;
  return seed / 0x7fffffff;
};

const rawValues = sectorNames.map(() => {
  let value = (rand() - 0.5) * 4;
  const drift = (rand() - 0.5) * 0.08;
  const volatility = 0.6 + rand() * 0.9;
  const reversion = 0.05 + rand() * 0.03; // pulls sustained runs back toward baseline
  const values = [];
  for (let i = 0; i < T; i++) {
    value += drift + (rand() - 0.5) * volatility - reversion * value;
    value = Math.max(-18, Math.min(18, value));
    values.push(Math.round(value * 10) / 10);
  }
  return values;
});

// Sort rows by mean deviation (descending) so the strongest/weakest sectors
// cluster at top/bottom and the pattern is visible at a glance.
const order = sectorNames
  .map((_, i) => i)
  .sort((a, b) => {
    const meanA = rawValues[a].reduce((s, v) => s + v, 0) / T;
    const meanB = rawValues[b].reduce((s, v) => s + v, 0) / T;
    return meanB - meanA;
  });
const rowNames = order.map((i) => sectorNames[i]);
const seriesValues = order.map((i) => rawValues[i]);

const startDate = new Date(2024, 0, 2);
const dayLabels = Array.from({ length: T }, (_, i) => {
  const d = new Date(startDate);
  d.setDate(d.getDate() + i);
  return `${d.getMonth() + 1}/${d.getDate()}`;
});

// --- Horizon folding: K overlapping bands per row, opacity encodes magnitude
const K = 3;
const BAND_H = 5; // percentage points per band; 3 bands saturate at +/-15
const BAND_OPACITY = [0.35, 0.65, 1.0];
const POS_COLOR = t.div[2]; // blue — above sector average
const NEG_COLOR = t.div[0]; // red — below sector average

function bandValue(v, k) {
  return Math.min(BAND_H, Math.max(0, v - k * BAND_H));
}

// --- Layout (derived from the mount size so it holds for any canvas) -------
const W = size.width;
const H = size.height;
const titleH = Math.round(H * 0.08);
const legendH = Math.round(H * 0.05);
const bottomAxisH = Math.round(H * 0.06);
const leftMargin = Math.round(W * 0.115);
const rightMargin = Math.round(W * 0.03);
const rowGap = Math.round(H * 0.009);
const rowsTop = titleH + legendH;
const rowsAvail = H - bottomAxisH - rowsTop;
const rowH = Math.floor((rowsAvail - (N - 1) * rowGap) / N);
const rowTop = (i) => rowsTop + i * (rowH + rowGap);

// --- Init ---------------------------------------------------------------
const chart = echarts.init(document.getElementById("container"));

// --- Grids, axes, series (one row per sector) -------------------------------
const grid = [];
const xAxis = [];
const yAxis = [];
const series = [];
const graphic = [];

for (let i = 0; i < N; i++) {
  grid.push({
    left: leftMargin,
    right: rightMargin,
    top: rowTop(i),
    height: rowH,
  });

  const isLastRow = i === N - 1;
  xAxis.push({
    type: "category",
    data: dayLabels,
    gridIndex: i,
    boundaryGap: false,
    axisLabel: {
      show: isLastRow,
      color: t.inkSoft,
      fontSize: 14,
      interval: Math.round(T / 6),
    },
    axisTick: { show: false },
    axisLine: { show: true, lineStyle: { color: t.grid } },
    splitLine: { show: false },
  });

  yAxis.push({
    type: "value",
    min: 0,
    max: BAND_H,
    gridIndex: i,
    axisLabel: { show: false },
    axisTick: { show: false },
    axisLine: { show: false },
    splitLine: { show: false },
  });

  for (let k = 0; k < K; k++) {
    series.push({
      type: "line",
      xAxisIndex: i,
      yAxisIndex: i,
      data: seriesValues[i].map((v) => bandValue(v, k)),
      showSymbol: false,
      silent: true,
      clip: true,
      lineStyle: { width: 0 },
      areaStyle: { color: POS_COLOR, opacity: BAND_OPACITY[k] },
      z: k + 1,
    });
    series.push({
      type: "line",
      xAxisIndex: i,
      yAxisIndex: i,
      data: seriesValues[i].map((v) => bandValue(-v, k)),
      showSymbol: false,
      silent: true,
      clip: true,
      lineStyle: { width: 0 },
      areaStyle: { color: NEG_COLOR, opacity: BAND_OPACITY[k] },
      z: k + 1,
    });
  }

  graphic.push({
    type: "text",
    left: 16,
    top: rowTop(i) + rowH / 2 - 8,
    style: {
      text: rowNames[i],
      fill: t.inkSoft,
      font: "500 15px sans-serif",
    },
  });
}

// --- Diverging legend bar (top right) ---------------------------------------
const legendW = Math.round(W * 0.16);
const legendX = W - rightMargin - legendW;
const legendY = titleH + Math.round(legendH * 0.35);
graphic.push(
  {
    type: "text",
    left: legendX,
    top: titleH + 2,
    style: {
      text: "Deviation from sector avg (%)",
      fill: t.inkSoft,
      font: "14px sans-serif",
    },
  },
  {
    type: "rect",
    left: legendX,
    top: legendY,
    shape: { width: legendW, height: 12 },
    style: {
      fill: {
        type: "linear",
        x: 0, y: 0, x2: 1, y2: 0,
        colorStops: [
          { offset: 0, color: NEG_COLOR },
          { offset: 0.5, color: t.pageBg },
          { offset: 1, color: POS_COLOR },
        ],
      },
    },
  },
  {
    type: "text",
    left: legendX,
    top: legendY + 17,
    style: { text: `-${K * BAND_H}%`, fill: t.inkSoft, font: "13px sans-serif" },
  },
  {
    type: "text",
    left: legendX + legendW / 2 - 7,
    top: legendY + 17,
    style: { text: "0", fill: t.inkSoft, font: "13px sans-serif" },
  },
  {
    type: "text",
    left: legendX + legendW - 30,
    top: legendY + 17,
    style: { text: `+${K * BAND_H}%`, fill: t.inkSoft, font: "13px sans-serif" },
  },
);

// --- Option -------------------------------------------------------------
chart.setOption({
  animation: false,
  backgroundColor: "transparent",
  title: {
    text: "Sector Return Deviation · horizon-basic · javascript · echarts · anyplot.ai",
    left: "center",
    top: Math.round(titleH * 0.28),
    textStyle: { color: t.ink, fontSize: 26, fontWeight: 500 },
  },
  grid,
  xAxis,
  yAxis,
  series,
  graphic,
});
Runnable source as JSON, for any HTTP client: https://api.anyplot.ai/specs/horizon-basic/echarts/code. Any spec id and library id listed in llms-full.txt fit the same URL shape; every URL below is complete and callable.
{
  "spec_id": "horizon-basic",
  "language": "javascript",
  "library": "echarts",
  "page": "https://anyplot.ai/horizon-basic/javascript/echarts",
  "hub": "https://anyplot.ai/horizon-basic",
  "code_json": "https://api.anyplot.ai/specs/horizon-basic/echarts/code",
  "spec_json": "https://api.anyplot.ai/specs/horizon-basic",
  "render_light_png": "https://storage.googleapis.com/anyplot-images/plots/horizon-basic/javascript/echarts/plot-light.png",
  "render_dark_png": "https://storage.googleapis.com/anyplot-images/plots/horizon-basic/javascript/echarts/plot-dark.png",
  "interactive_light_html": "https://storage.googleapis.com/anyplot-images/plots/horizon-basic/javascript/echarts/plot-light.html",
  "interactive_dark_html": "https://storage.googleapis.com/anyplot-images/plots/horizon-basic/javascript/echarts/plot-dark.html",
  "quality_score": 91.0,
  "license": "MIT",
  "guide": "https://anyplot.ai/llms.txt"
}
Part of Horizon Chart on anyplot.ai.