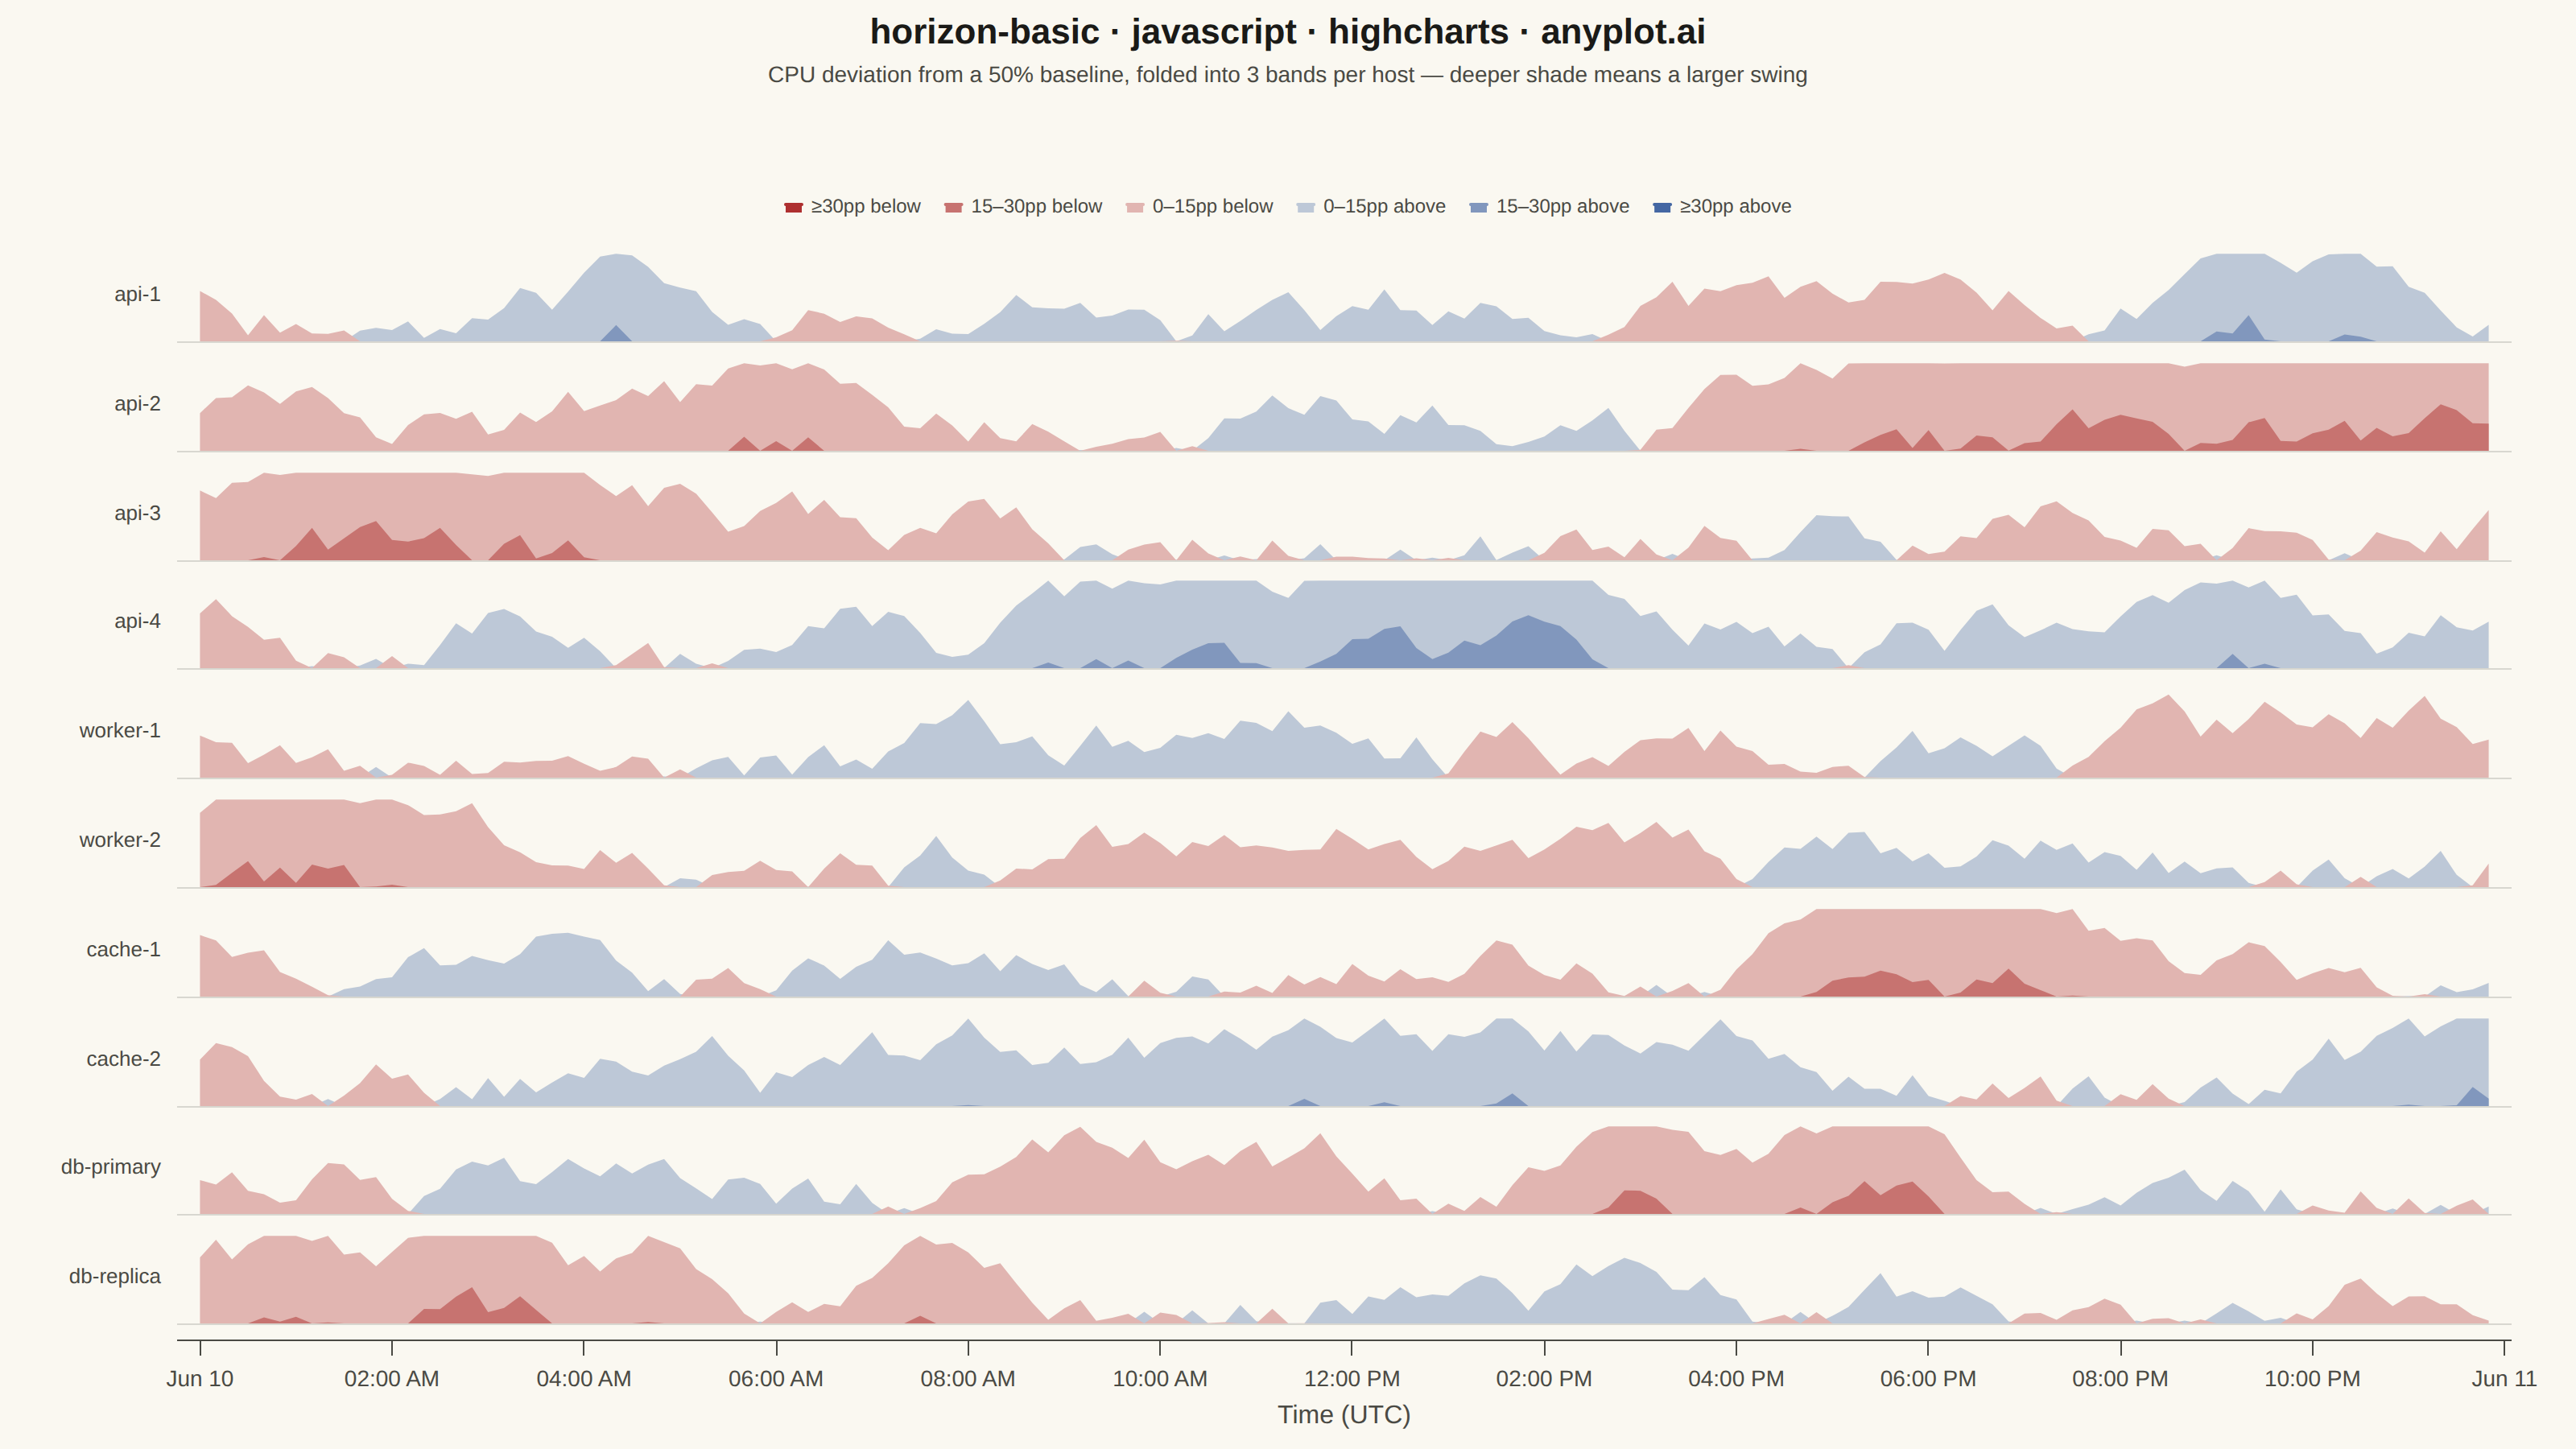
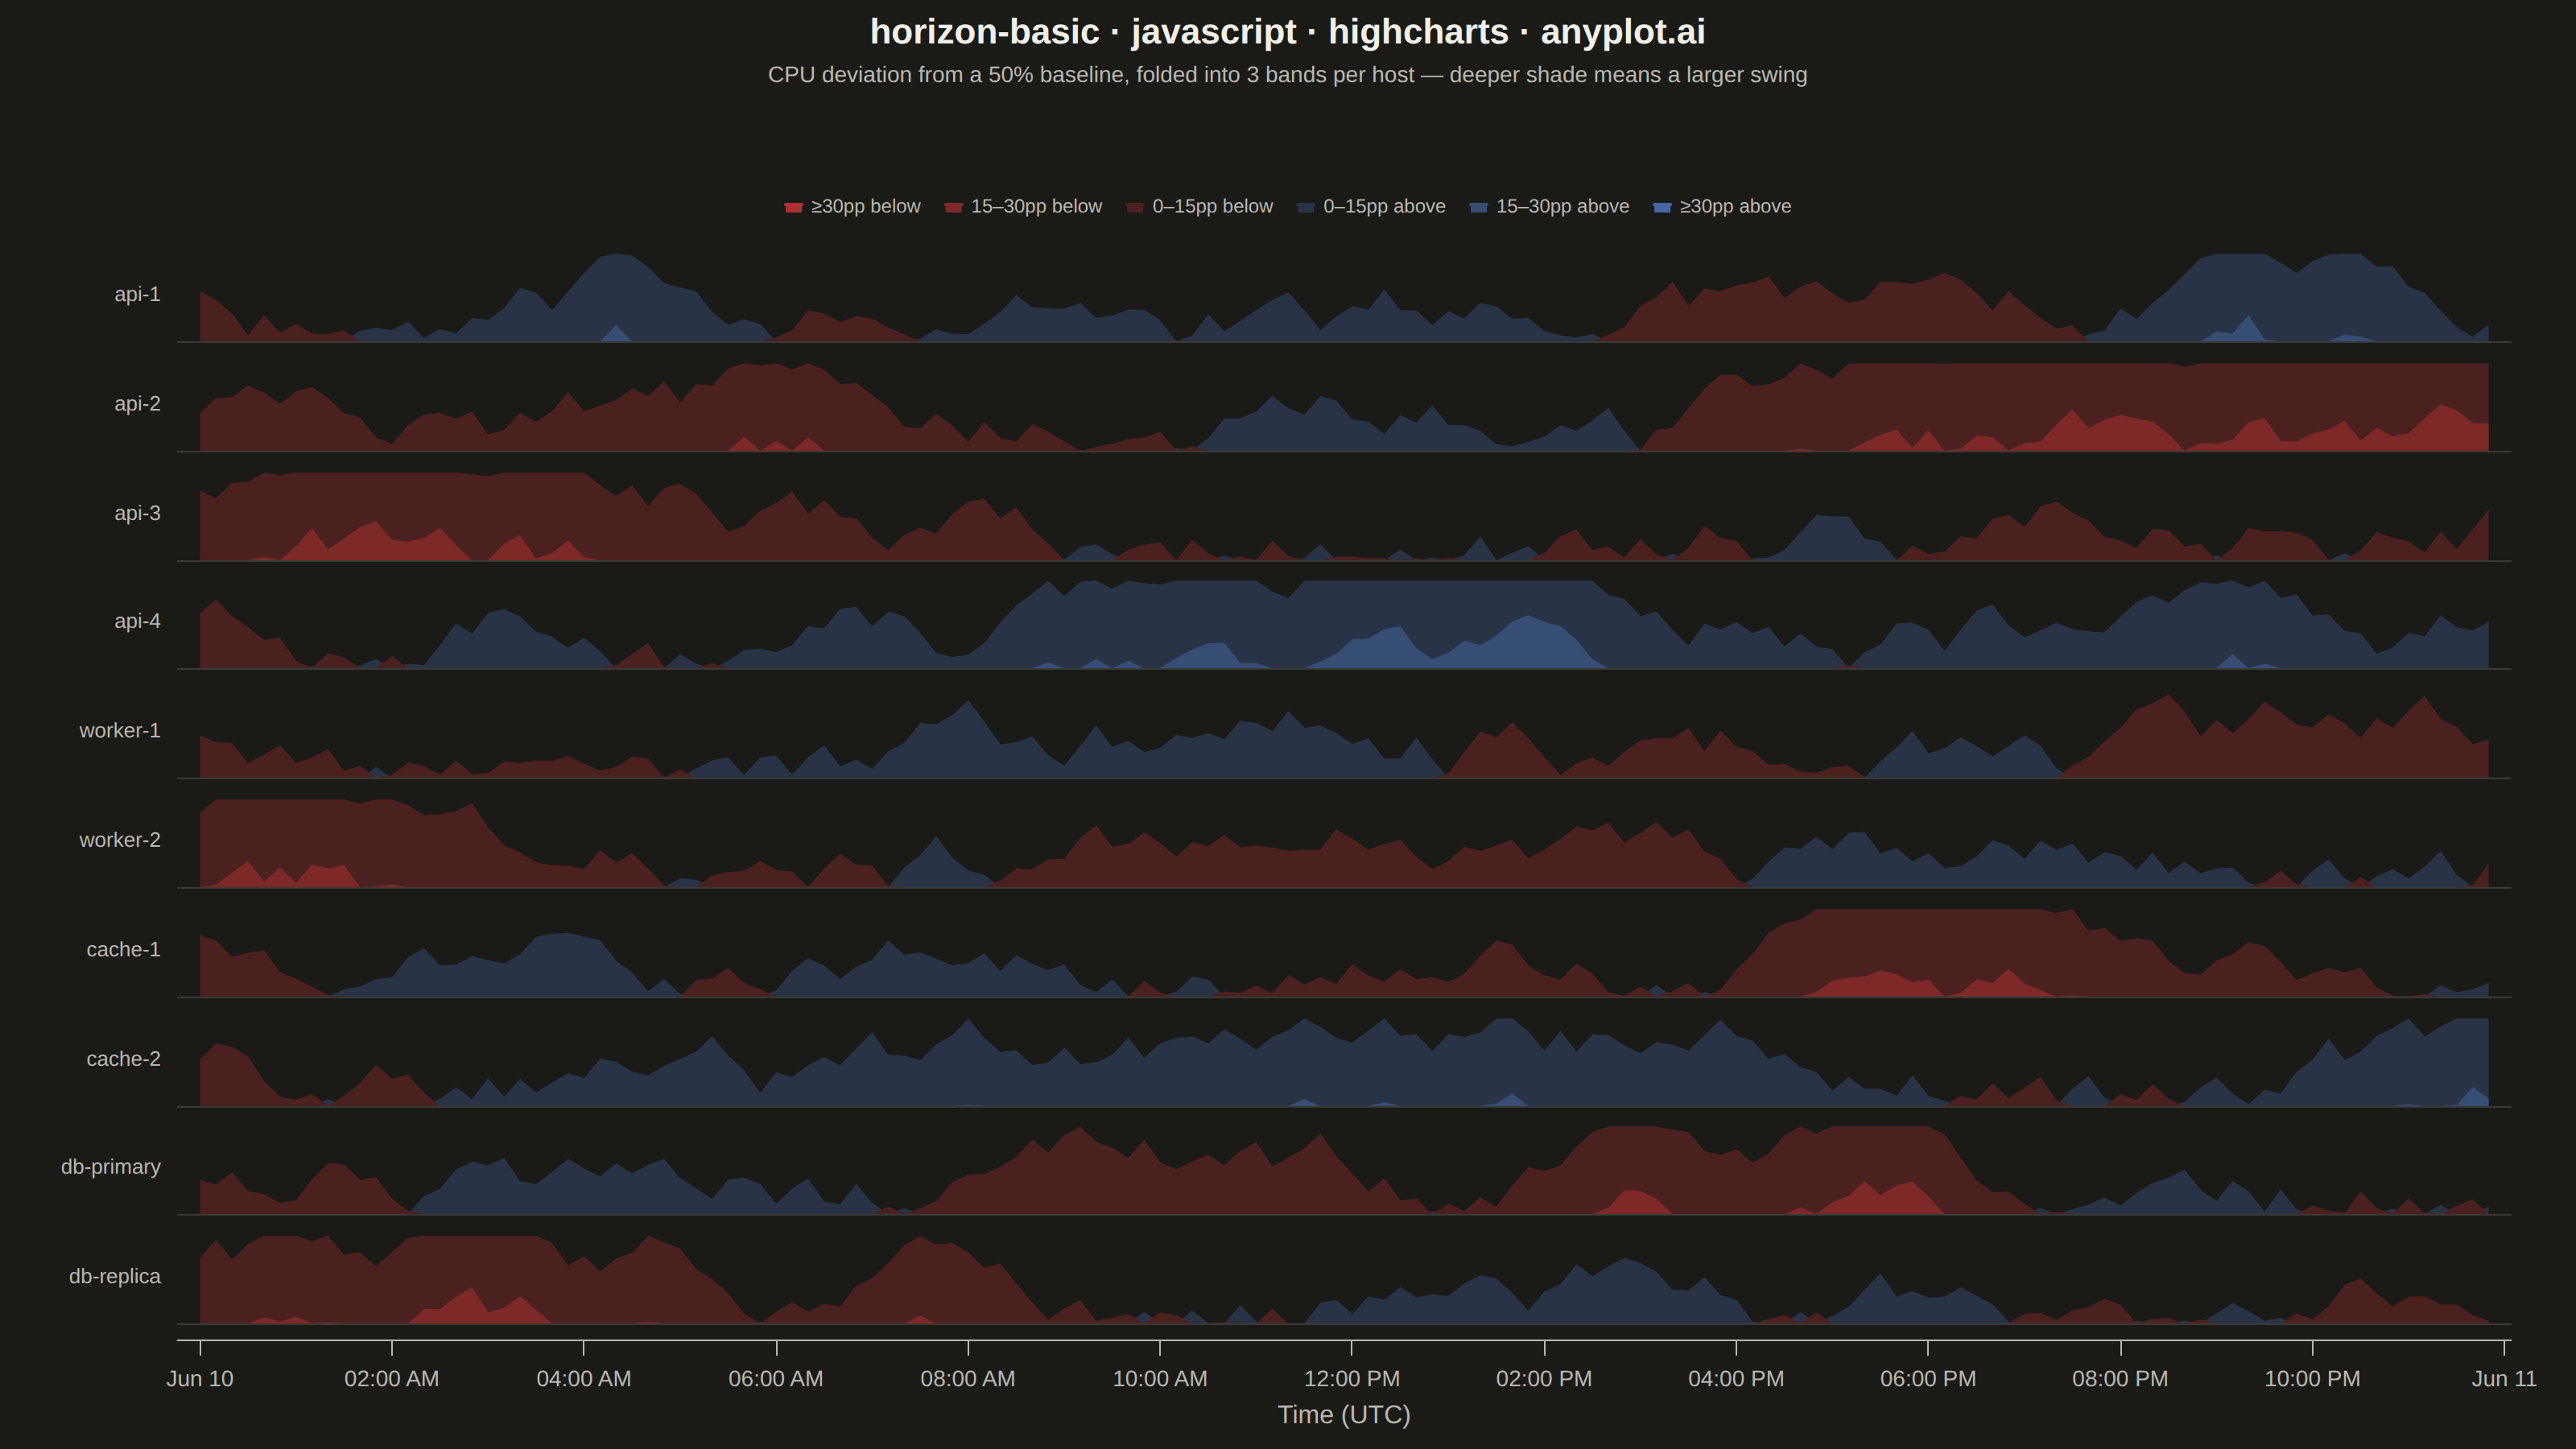
The same plot in 14 other libraries — JavaScript: Chart.js, D3.js, Apache ECharts, MUI X Charts; Python: Altair, Bokeh, lets-plot, Matplotlib, Plotly, plotnine, Pygal, Seaborn; R: ggplot2; Julia: Makie.jl. Compare all 15 side by side: Horizon Chart in Python, R, Julia and JavaScript.
A horizon chart displays many time series compactly by folding values into color-coded bands, preserving local resolution while minimizing vertical space. It divides the y-axis into bands and uses color intensity to encode magnitude, allowing dozens of series to be compared in limited space. This technique is particularly effective when monitoring many metrics simultaneously where traditional line charts would become unreadable.
// anyplot.ai
// horizon-basic: Horizon Chart
// Library: highcharts 12.6.0 | JavaScript 22.23.2
// Quality: 92/100 | Created: 2026-08-18

//# anyplot-orientation: landscape
const t = window.ANYPLOT_TOKENS;

// --- Data: CPU load deviation from a 50% baseline, 10 fleet hosts over 24h --
// deterministic Park-Miller LCG — no seeded RNG in the browser
function makeLcg(seed) {
  let state = seed % 2147483647;
  if (state <= 0) state += 2147483646;
  return function next() {
    state = (state * 16807) % 2147483647;
    return (state - 1) / 2147483646;
  };
}

const HOSTS = ["api-1", "api-2", "api-3", "api-4", "worker-1", "worker-2",
               "cache-1", "cache-2", "db-primary", "db-replica"];
const POINTS = 144; // one reading every 10 minutes across 24h
const STEP_MS = 10 * 60 * 1000;
const START_MS = Date.UTC(2024, 5, 10, 0, 0, 0);
const BAND_HEIGHT = 15; // percentage points of CPU deviation folded per band
const BAND_COUNT = 3; // horizon bands per polarity (mirrored blue/red)

const hostSeries = HOSTS.map((name, hostIndex) => {
  const rng = makeLcg(1000 + hostIndex * 97);
  let level = (rng() - 0.5) * 20;
  const drift = (rng() - 0.5) * 0.4;
  const values = [];
  for (let p = 0; p < POINTS; p += 1) {
    level = (level + drift + (rng() - 0.5) * 8) * 0.96;
    values.push(level);
  }
  return { name, values };
});

// --- Horizon folding: clamp the excess above each band threshold into 0..H -
function foldBand(value, bandIndex, bandHeight) {
  return Math.min(Math.max(value - bandIndex * bandHeight, 0), bandHeight);
}

// --- Band colors: interpolate the Imprint diverging stops (imprint_div) ----
function lerpHex(hexA, hexB, fraction) {
  const a = [1, 3, 5].map((i) => parseInt(hexA.slice(i, i + 2), 16));
  const b = [1, 3, 5].map((i) => parseInt(hexB.slice(i, i + 2), 16));
  const c = a.map((v, i) => Math.round(v + (b[i] - v) * fraction));
  return `#${c.map((v) => v.toString(16).padStart(2, "0")).join("")}`;
}

const midColor = t.div[1];
const positiveColors = Array.from({ length: BAND_COUNT },
  (_, i) => lerpHex(midColor, t.div[2], (i + 1) / BAND_COUNT));
const negativeColors = Array.from({ length: BAND_COUNT },
  (_, i) => lerpHex(midColor, t.div[0], (i + 1) / BAND_COUNT));

// --- Series: 2 x BAND_COUNT opaque area layers per host, stacked on top ----
// so a deeper shade only shows through where the value actually reaches it.
const series = [];
hostSeries.forEach((host, hostIndex) => {
  for (let band = 0; band < BAND_COUNT; band += 1) {
    series.push({
      type: "area",
      yAxis: hostIndex,
      name: `${host.name} +band${band + 1}`,
      color: positiveColors[band],
      fillColor: positiveColors[band],
      fillOpacity: 1,
      lineWidth: 0,
      threshold: 0,
      marker: { enabled: false },
      enableMouseTracking: false,
      showInLegend: false,
      data: host.values.map((v, p) => [START_MS + p * STEP_MS, foldBand(v, band, BAND_HEIGHT)]),
    });
    series.push({
      type: "area",
      yAxis: hostIndex,
      name: `${host.name} -band${band + 1}`,
      color: negativeColors[band],
      fillColor: negativeColors[band],
      fillOpacity: 1,
      lineWidth: 0,
      threshold: 0,
      marker: { enabled: false },
      enableMouseTracking: false,
      showInLegend: false,
      data: host.values.map((v, p) => [START_MS + p * STEP_MS, foldBand(-v, band, BAND_HEIGHT)]),
    });
  }
});

// --- Color key: one legend-only dummy series per band/polarity so the ------
// blue/red-intensity encoding is self-explanatory without reading the subtitle.
const keySeries = [
  { color: negativeColors[2], name: "≥30pp below" },
  { color: negativeColors[1], name: "15–30pp below" },
  { color: negativeColors[0], name: "0–15pp below" },
  { color: positiveColors[0], name: "0–15pp above" },
  { color: positiveColors[1], name: "15–30pp above" },
  { color: positiveColors[2], name: "≥30pp above" },
].map((item) => ({
  type: "area",
  yAxis: 0,
  name: item.name,
  color: item.color,
  fillColor: item.color,
  marker: { enabled: false },
  enableMouseTracking: false,
  showInLegend: true,
  data: [],
}));

// --- Panels: one compact yAxis strip per host, sharing the datetime xAxis --
// Row labels are drawn manually in chart.events.load (below) rather than via
// yAxis.title: Highcharts reserves left-margin space for *every* stacked yAxis
// title as if they were parallel side-by-side axes, ballooning the left gutter
// and forcing later rows' titles increasingly off-canvas once that reservation
// is overridden -- a plain SVG label per row sidesteps that layout entirely.
const rowHeightPct = 100 / HOSTS.length;
const yAxis = HOSTS.map((name, hostIndex) => ({
  top: `${hostIndex * rowHeightPct}%`,
  height: `${rowHeightPct - 1.4}%`,
  min: 0,
  max: BAND_HEIGHT,
  gridLineWidth: 0,
  tickLength: 0,
  lineWidth: 0,
  labels: { enabled: false },
  title: { text: null },
  plotLines: [{ value: 0, color: t.grid, width: 1, zIndex: 5 }],
}));

// --- Chart -------------------------------------------------------------------
Highcharts.chart("container", {
  chart: { backgroundColor: "transparent", animation: false,
           marginLeft: 110, marginRight: 40,
           style: { fontFamily: "inherit" },
           events: {
             load() {
               const chart = this;
               HOSTS.forEach((name, hostIndex) => {
                 const axis = chart.yAxis[hostIndex];
                 chart.renderer.text(name, chart.plotLeft - 10, axis.top + axis.len / 2 + 4)
                   .attr({ align: "right", zIndex: 6 })
                   .css({ color: t.inkSoft, fontSize: "13px", fontWeight: "500" })
                   .add();
               });
             },
           } },
  credits: { enabled: false },
  colors: t.palette,
  title: { text: "horizon-basic · javascript · highcharts · anyplot.ai",
           style: { color: t.ink, fontSize: "22px", fontWeight: "600" } },
  subtitle: { text: "CPU deviation from a 50% baseline, folded into 3 bands per host — deeper shade means a larger swing",
              style: { color: t.inkSoft, fontSize: "14px" } },
  xAxis: {
    type: "datetime",
    lineColor: t.inkSoft, tickColor: t.inkSoft, gridLineWidth: 0,
    labels: { style: { color: t.inkSoft, fontSize: "14px" } },
    title: { text: "Time (UTC)", style: { color: t.inkSoft, fontSize: "16px" } },
  },
  yAxis,
  legend: {
    enabled: true,
    layout: "horizontal",
    align: "center",
    verticalAlign: "top",
    y: 46,
    itemDistance: 14,
    symbolWidth: 12,
    symbolHeight: 12,
    symbolRadius: 2,
    itemStyle: { color: t.inkSoft, fontSize: "12px", fontWeight: "normal" },
  },
  tooltip: { enabled: false },
  plotOptions: { series: { animation: false } },
  series: [...series, ...keySeries],
});
Runnable source as JSON, for any HTTP client: https://api.anyplot.ai/specs/horizon-basic/highcharts/code. Any spec id and library id listed in llms-full.txt fit the same URL shape; every URL below is complete and callable.
{
  "spec_id": "horizon-basic",
  "language": "javascript",
  "library": "highcharts",
  "page": "https://anyplot.ai/horizon-basic/javascript/highcharts",
  "hub": "https://anyplot.ai/horizon-basic",
  "code_json": "https://api.anyplot.ai/specs/horizon-basic/highcharts/code",
  "spec_json": "https://api.anyplot.ai/specs/horizon-basic",
  "render_light_png": "https://storage.googleapis.com/anyplot-images/plots/horizon-basic/javascript/highcharts/plot-light.png",
  "render_dark_png": "https://storage.googleapis.com/anyplot-images/plots/horizon-basic/javascript/highcharts/plot-dark.png",
  "interactive_light_html": "https://storage.googleapis.com/anyplot-images/plots/horizon-basic/javascript/highcharts/plot-light.html",
  "interactive_dark_html": "https://storage.googleapis.com/anyplot-images/plots/horizon-basic/javascript/highcharts/plot-dark.html",
  "quality_score": 92.0,
  "license": "MIT",
  "guide": "https://anyplot.ai/llms.txt"
}
Part of Horizon Chart on anyplot.ai.