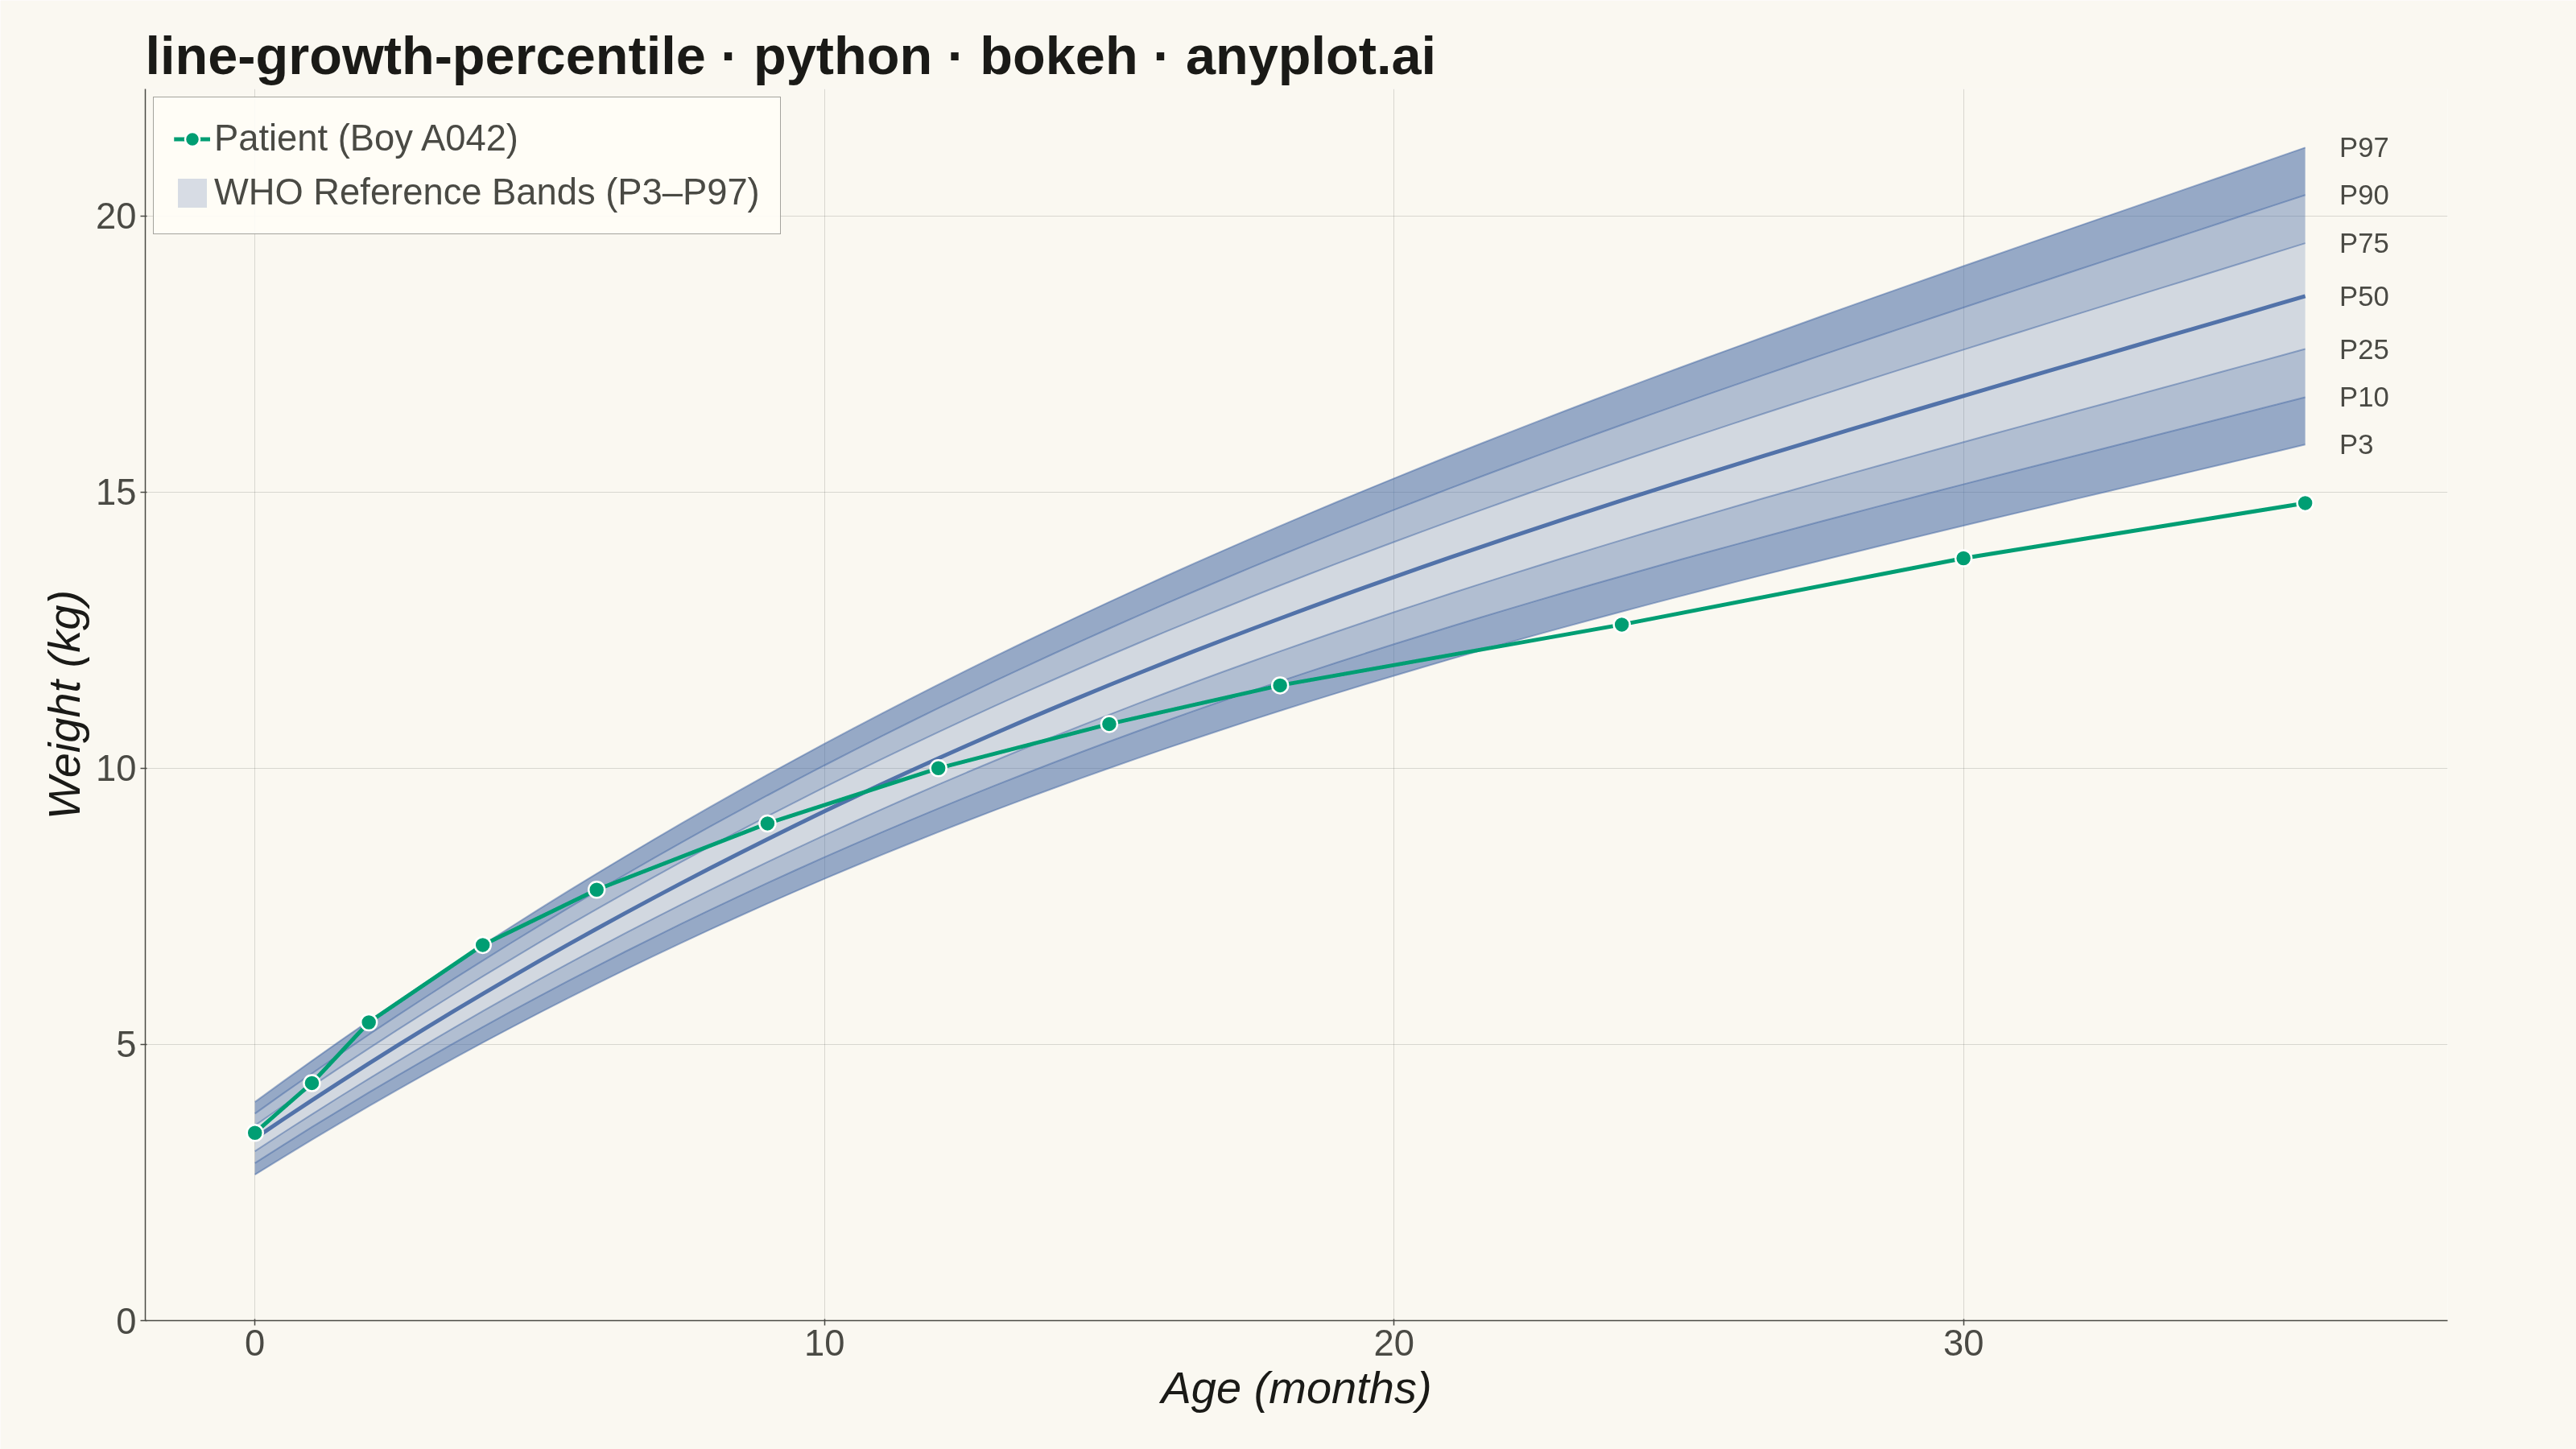
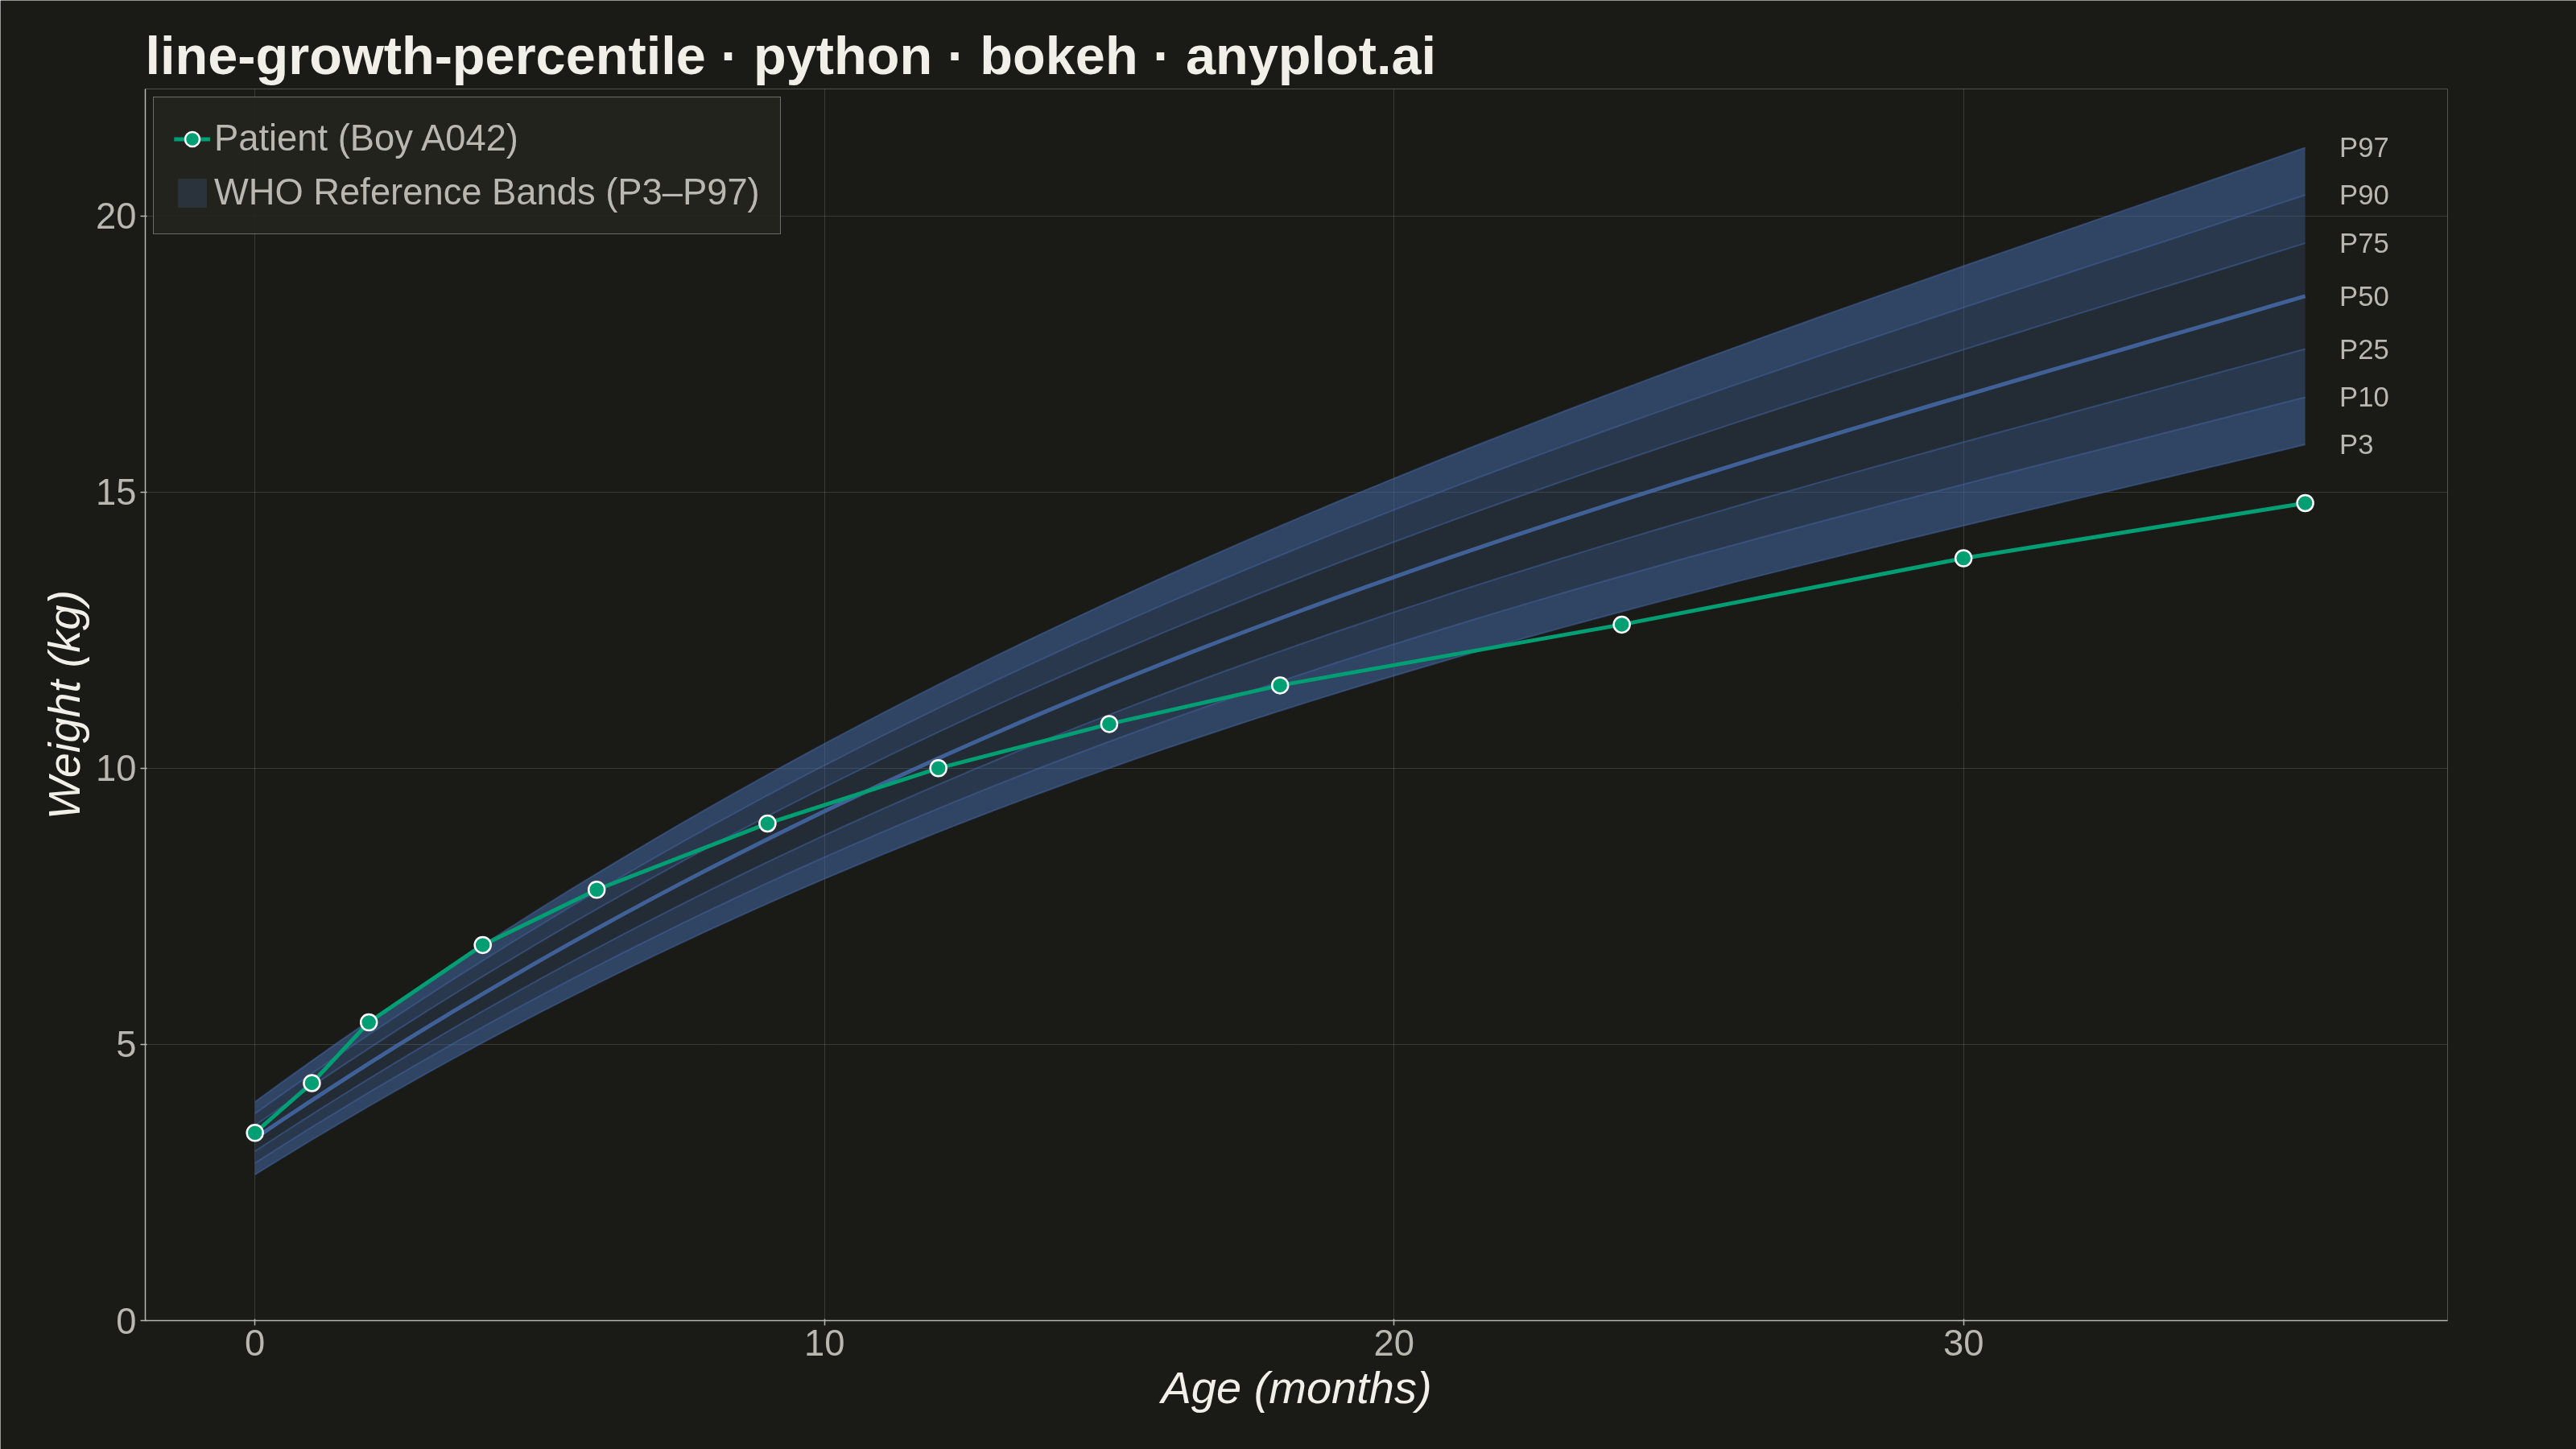
A WHO/CDC-style growth chart displaying smooth percentile curves (3rd, 10th, 25th, 50th, 75th, 90th, 97th) as colored bands, with individual patient data points overlaid and connected by a line. This chart is a standard clinical tool for monitoring child development metrics such as height, weight, or BMI across age. It enables quick visual assessment of whether a child's growth trajectory falls within expected population ranges.
Preview render from the Bokeh implementation.