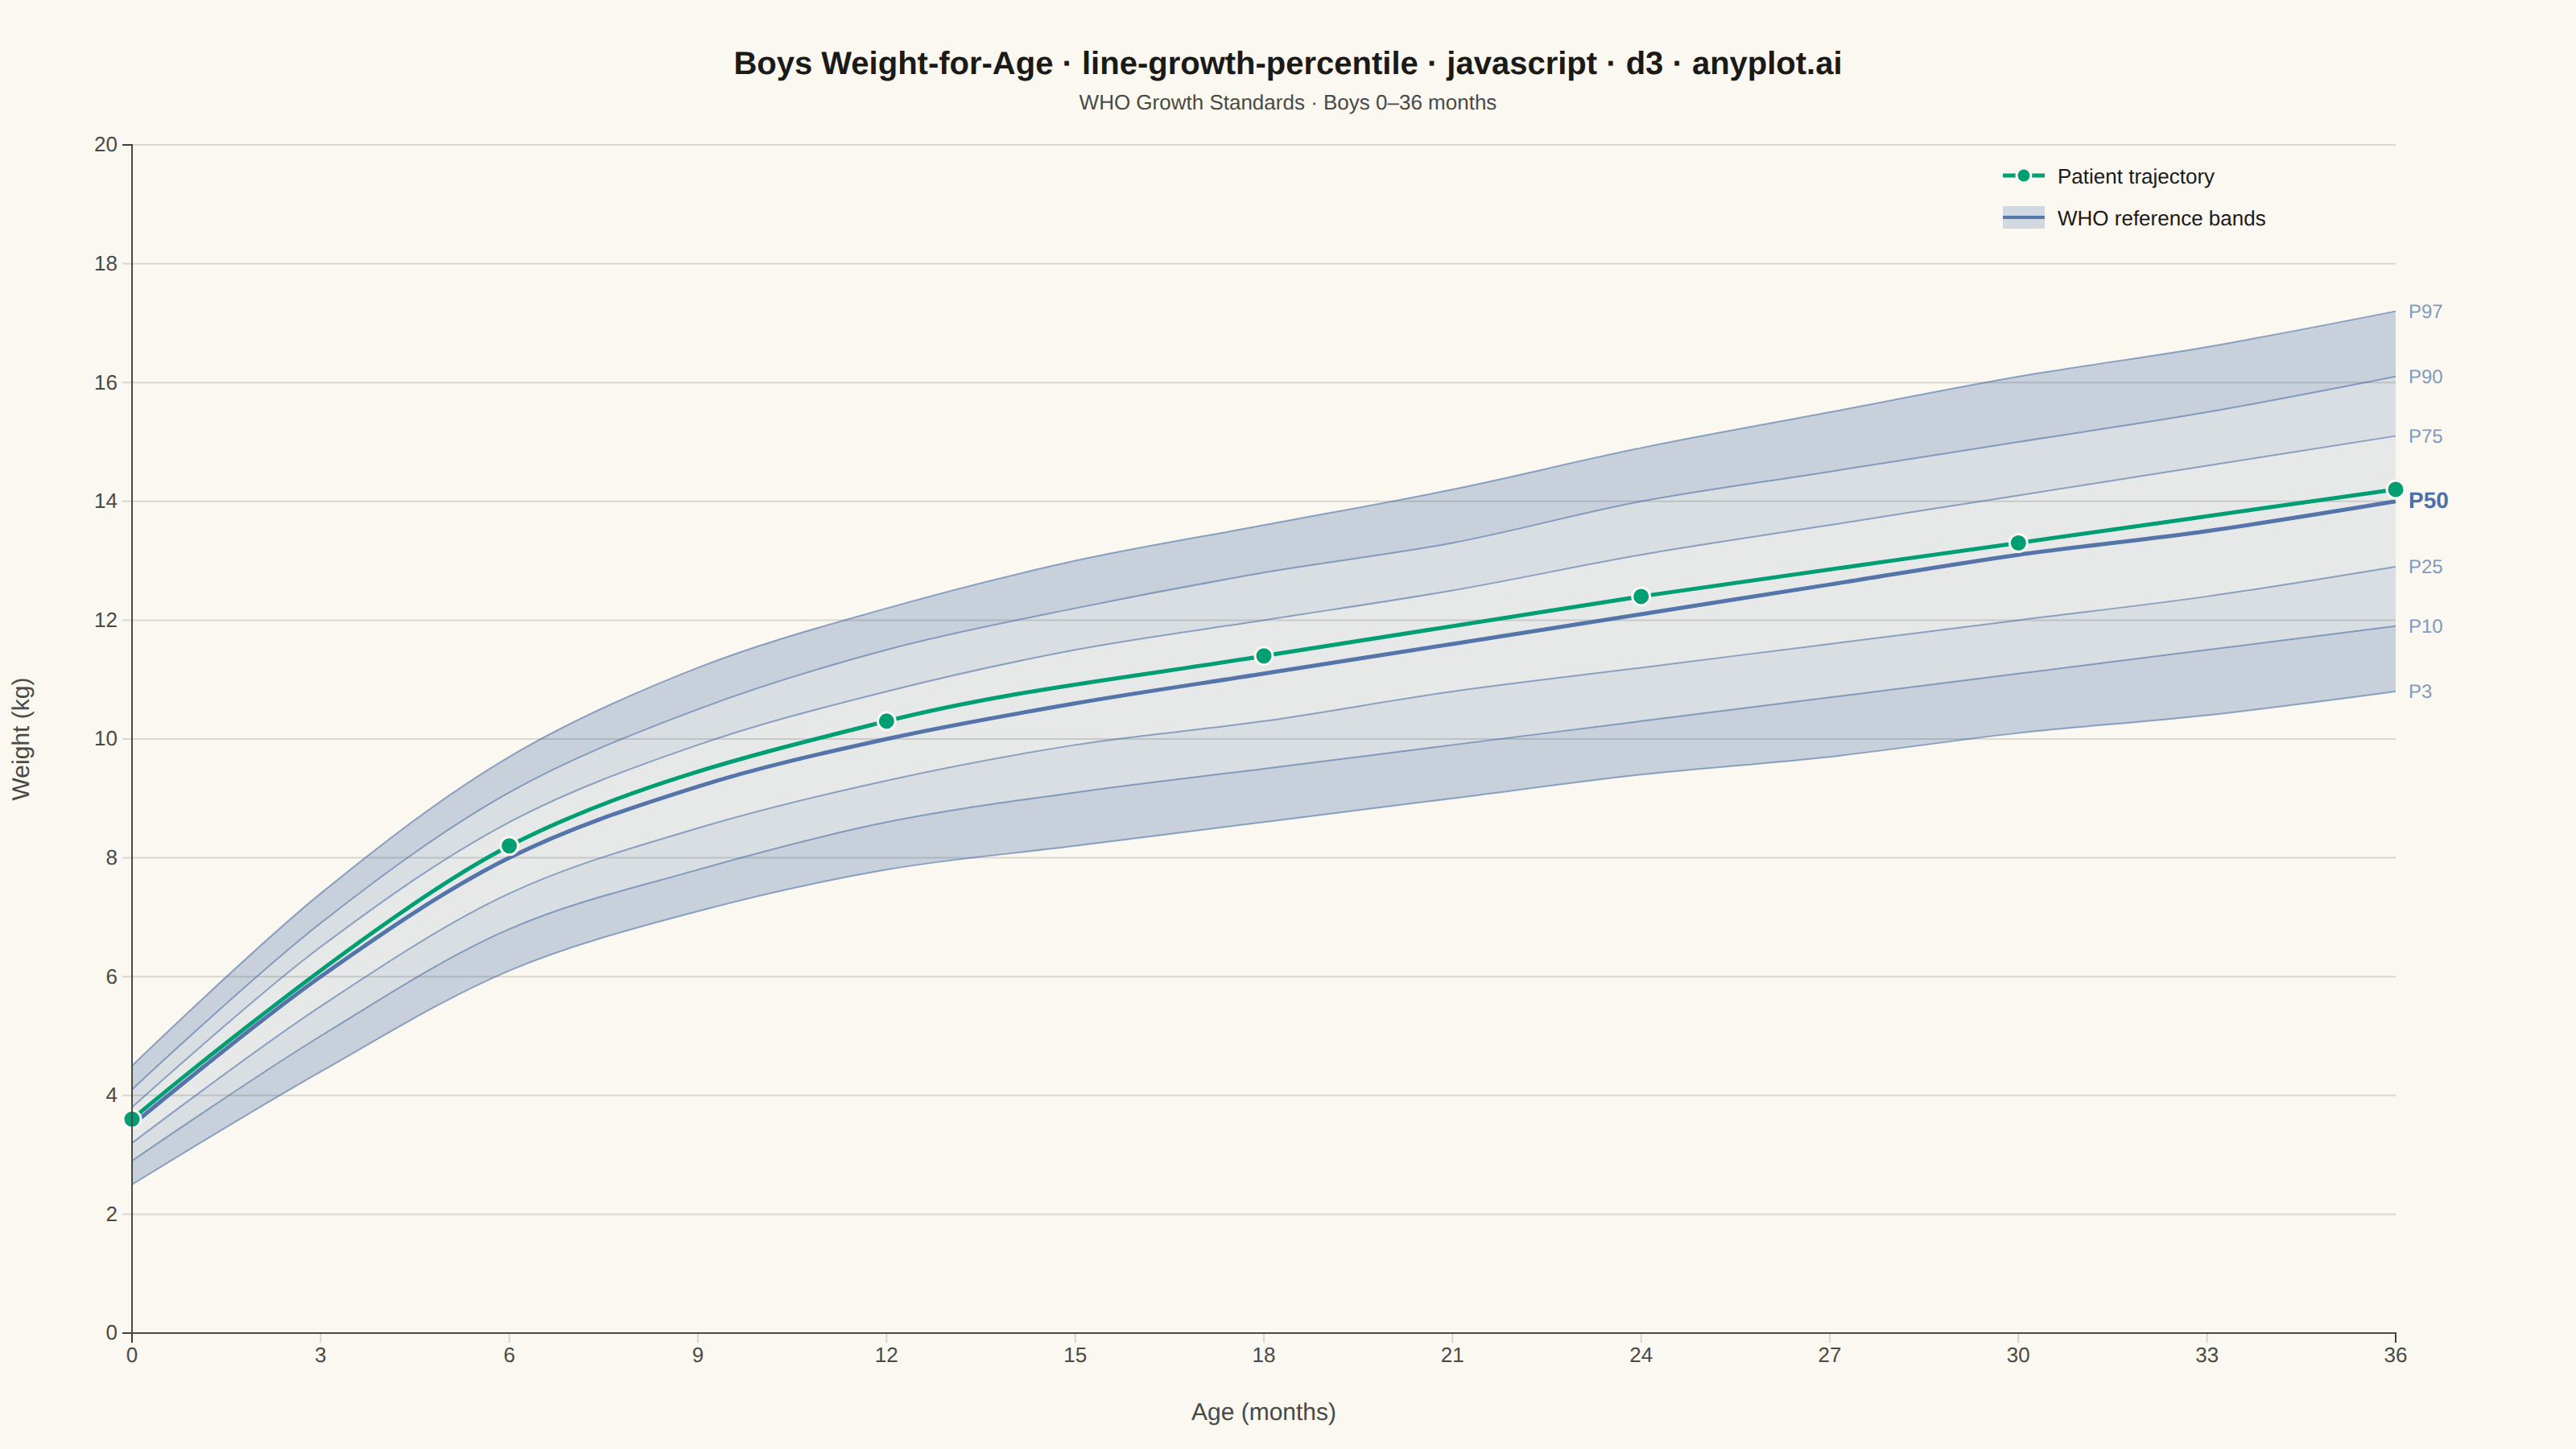
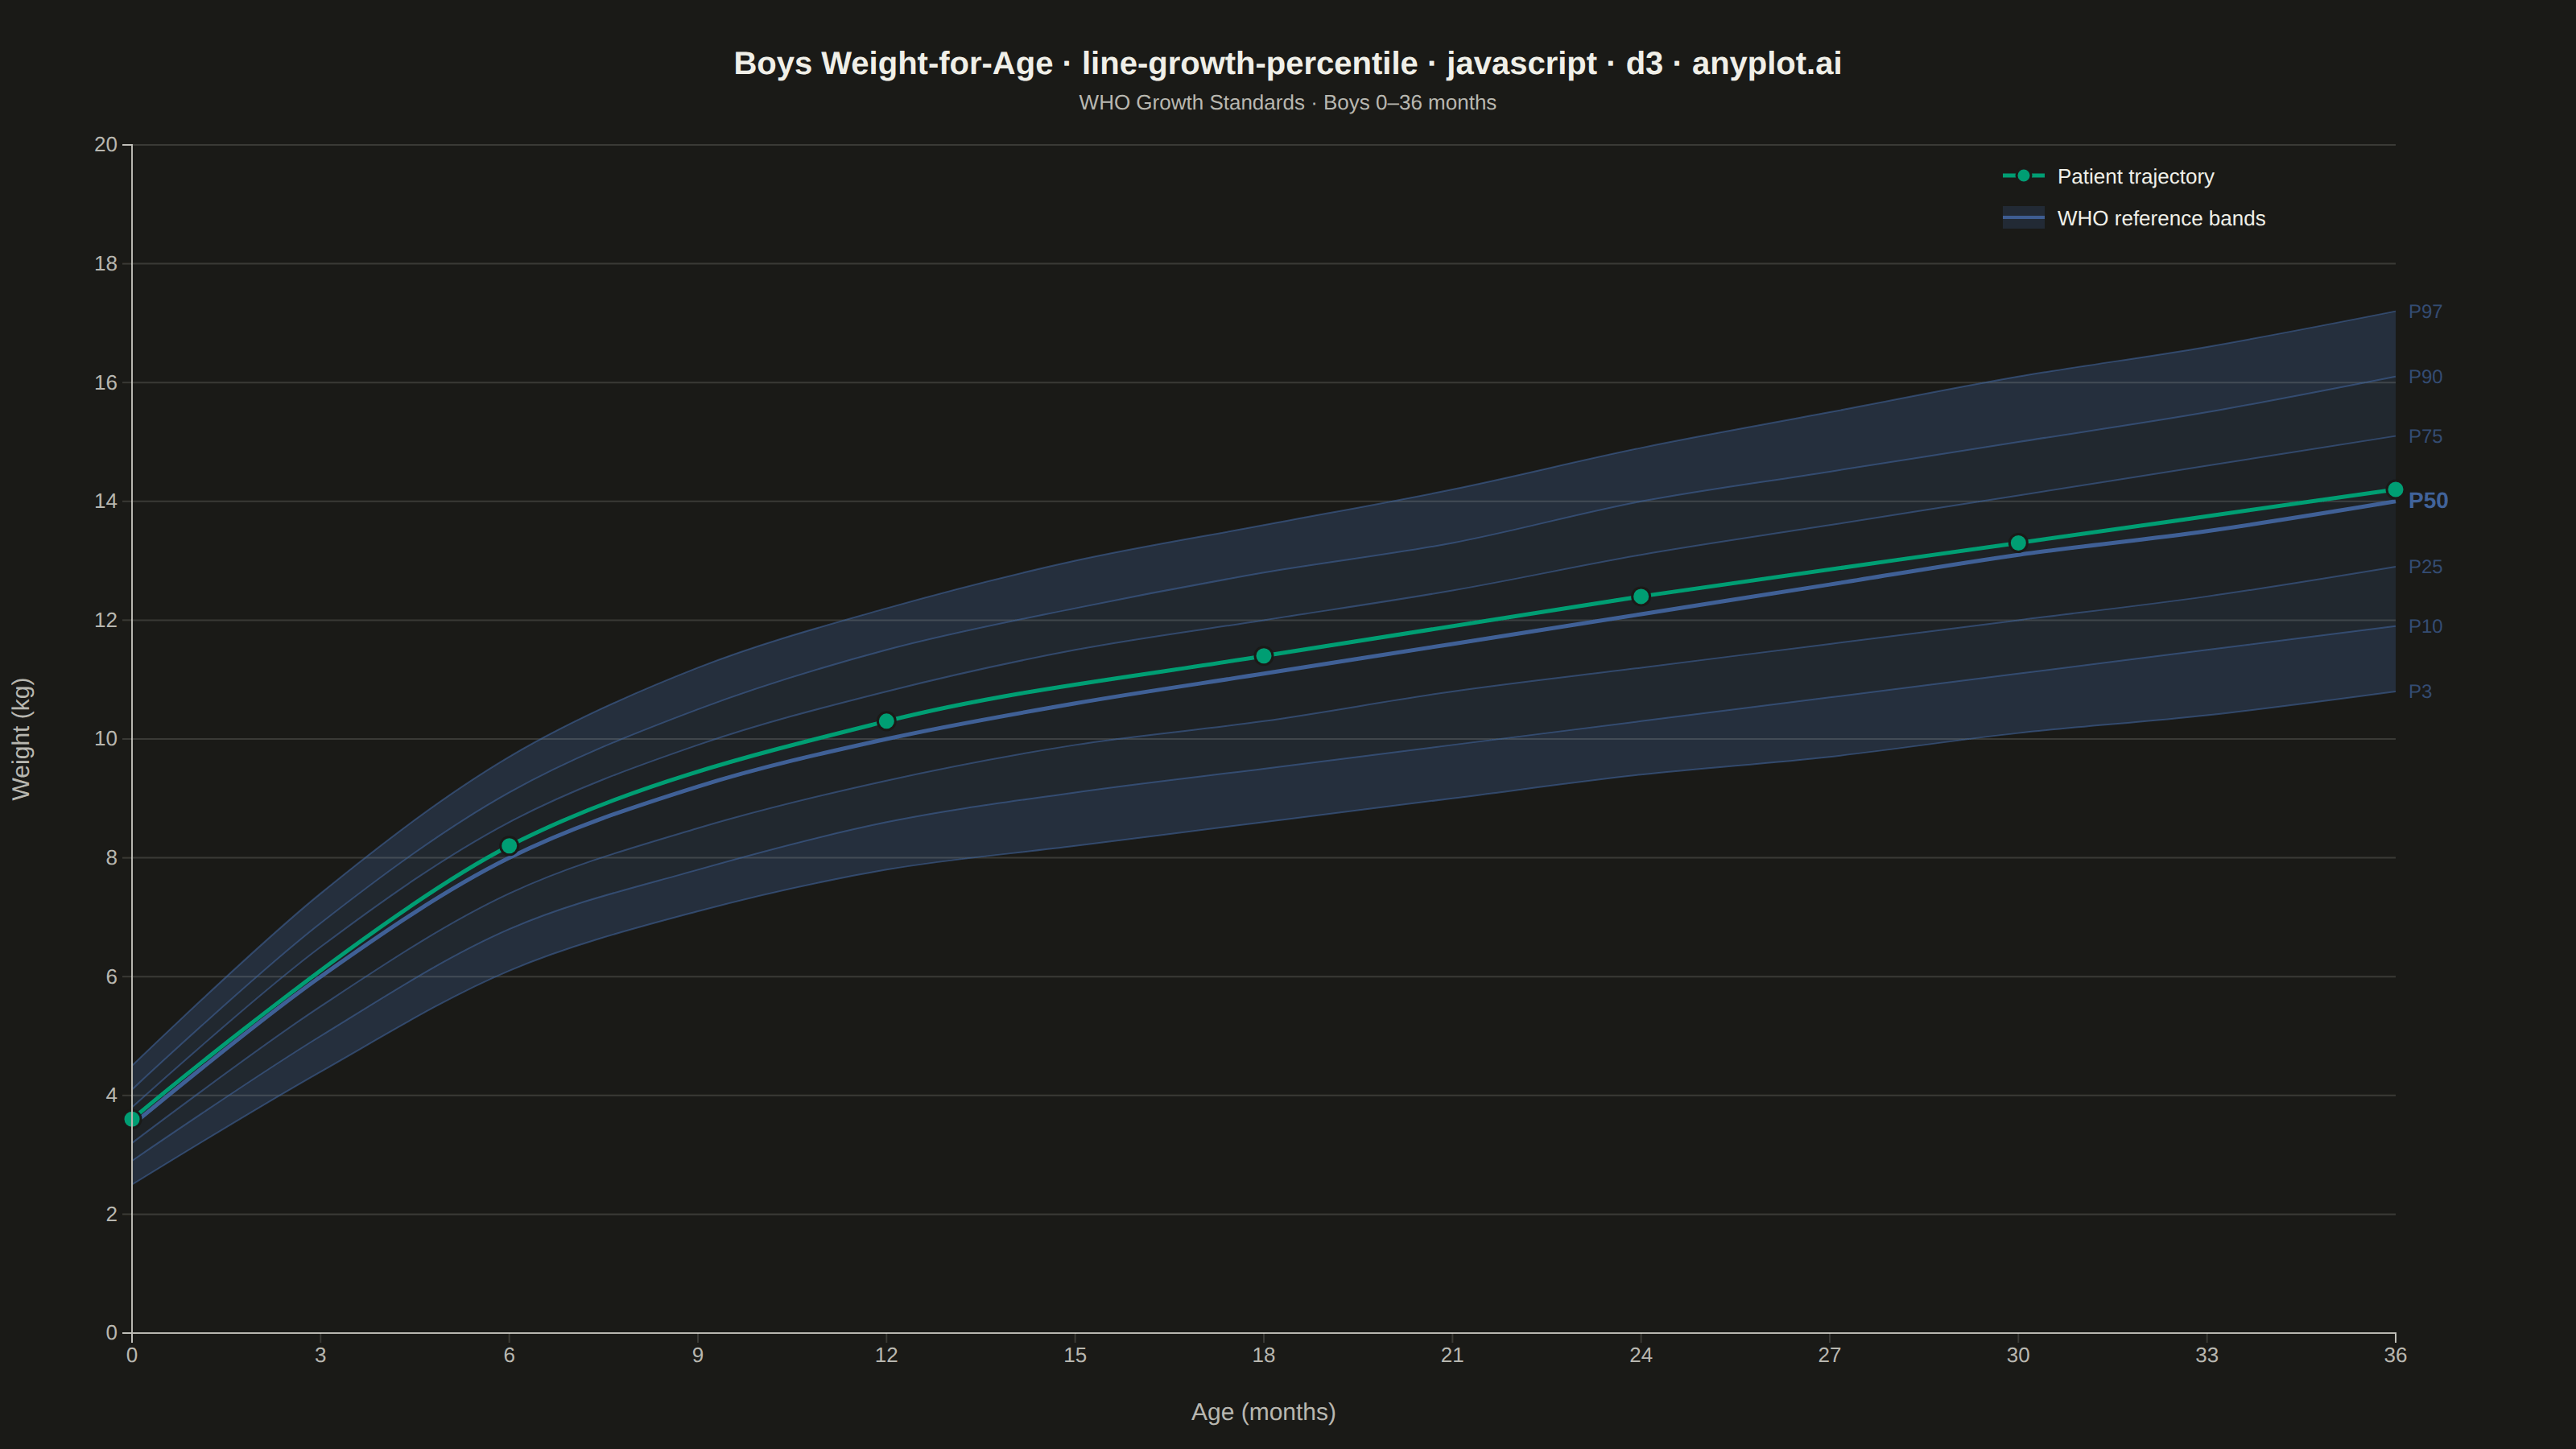
A WHO/CDC-style growth chart displaying smooth percentile curves (3rd, 10th, 25th, 50th, 75th, 90th, 97th) as colored bands, with individual patient data points overlaid and connected by a line. This chart is a standard clinical tool for monitoring child development metrics such as height, weight, or BMI across age. It enables quick visual assessment of whether a child's growth trajectory falls within expected population ranges.
// anyplot.ai
// line-growth-percentile: Pediatric Growth Chart with Percentile Curves
// Library: d3 7.9.0 | JavaScript 22.22.3
// Quality: 90/100 | Created: 2026-06-20

const t = window.ANYPLOT_TOKENS;
const { width, height } = window.ANYPLOT_SIZE;
const margin = { top: 90, right: 112, bottom: 72, left: 82 };
const iw = width - margin.left - margin.right;
const ih = height - margin.top - margin.bottom;

// WHO weight-for-age reference data for boys (0–36 months, approximate)
const refAges = [0, 3, 6, 9, 12, 15, 18, 21, 24, 27, 30, 33, 36];
const pctValues = {
  p3:  [2.5, 4.4, 6.1, 7.1,  7.8,  8.2,  8.6,  9.0,  9.4,  9.7, 10.1, 10.4, 10.8],
  p10: [2.9, 5.0, 6.8, 7.8,  8.6,  9.1,  9.5,  9.9, 10.3, 10.7, 11.1, 11.5, 11.9],
  p25: [3.2, 5.5, 7.4, 8.5,  9.3,  9.9, 10.3, 10.8, 11.2, 11.6, 12.0, 12.4, 12.9],
  p50: [3.5, 6.0, 8.0, 9.2, 10.0, 10.6, 11.1, 11.6, 12.1, 12.6, 13.1, 13.5, 14.0],
  p75: [3.8, 6.5, 8.6, 9.9, 10.8, 11.5, 12.0, 12.5, 13.1, 13.6, 14.1, 14.6, 15.1],
  p90: [4.1, 6.9, 9.1, 10.5, 11.5, 12.2, 12.8, 13.3, 14.0, 14.5, 15.0, 15.5, 16.1],
  p97: [4.5, 7.4, 9.7, 11.2, 12.2, 13.0, 13.6, 14.2, 14.9, 15.5, 16.1, 16.6, 17.2],
};
const refData = refAges.map((age, i) => ({
  age,
  p3: pctValues.p3[i], p10: pctValues.p10[i], p25: pctValues.p25[i],
  p50: pctValues.p50[i], p75: pctValues.p75[i], p90: pctValues.p90[i],
  p97: pctValues.p97[i],
}));

// Individual patient: boy tracking ~65th percentile with slight dip at 18 months
const patientData = [
  { age: 0,  w: 3.6 },
  { age: 6,  w: 8.2 },
  { age: 12, w: 10.3 },
  { age: 18, w: 11.4 },
  { age: 24, w: 12.4 },
  { age: 30, w: 13.3 },
  { age: 36, w: 14.2 },
];

// Scales
const x = d3.scaleLinear().domain([0, 36]).range([0, iw]);
const y = d3.scaleLinear().domain([0, 20]).range([ih, 0]);

// SVG
const svg = d3.select("#container").append("svg")
  .attr("width", width).attr("height", height);
const g = svg.append("g").attr("transform", `translate(${margin.left},${margin.top})`);

// Imprint blue (#4467A3, position 3) for WHO reference bands
const BAND_COL = "#4467A3";

// Filled bands between percentiles — graduated opacity (darker at extremes, lighter near median)
const bands = [
  { lo: "p3",  hi: "p10", opacity: 0.28 },
  { lo: "p10", hi: "p25", opacity: 0.18 },
  { lo: "p25", hi: "p50", opacity: 0.10 },
  { lo: "p50", hi: "p75", opacity: 0.10 },
  { lo: "p75", hi: "p90", opacity: 0.18 },
  { lo: "p90", hi: "p97", opacity: 0.28 },
];

for (const { lo, hi, opacity } of bands) {
  const areaFn = d3.area()
    .x(d => x(d.age))
    .y0(d => y(d[lo]))
    .y1(d => y(d[hi]))
    .curve(d3.curveCatmullRom.alpha(0.5));
  g.append("path").datum(refData)
    .attr("d", areaFn)
    .attr("fill", BAND_COL)
    .attr("opacity", opacity);
}

// Y gridlines
g.selectAll(".ygrid").data(y.ticks(10)).join("line")
  .attr("class", "ygrid")
  .attr("x1", 0).attr("x2", iw)
  .attr("y1", d => y(d)).attr("y2", d => y(d))
  .attr("stroke", t.grid).attr("stroke-width", 1);

// Percentile boundary lines (all except P50)
for (const key of ["p3", "p10", "p25", "p75", "p90", "p97"]) {
  const lineFn = d3.line()
    .x(d => x(d.age))
    .y(d => y(d[key]))
    .curve(d3.curveCatmullRom.alpha(0.5));
  g.append("path").datum(refData)
    .attr("d", lineFn)
    .attr("fill", "none")
    .attr("stroke", BAND_COL)
    .attr("stroke-width", 1)
    .attr("opacity", 0.55);
}

// P50 median line — emphasized with thicker stroke
const p50Fn = d3.line()
  .x(d => x(d.age))
  .y(d => y(d.p50))
  .curve(d3.curveCatmullRom.alpha(0.5));
g.append("path").datum(refData)
  .attr("d", p50Fn)
  .attr("fill", "none")
  .attr("stroke", BAND_COL)
  .attr("stroke-width", 2.5)
  .attr("opacity", 0.9);

// Percentile labels on right margin (anchored at age 36)
const lastRef = refData[refData.length - 1];
const pctLabels = [
  { key: "p3",  label: "P3"  }, { key: "p10", label: "P10" },
  { key: "p25", label: "P25" }, { key: "p50", label: "P50" },
  { key: "p75", label: "P75" }, { key: "p90", label: "P90" },
  { key: "p97", label: "P97" },
];
for (const { key, label } of pctLabels) {
  const isMed = key === "p50";
  svg.append("text")
    .attr("x", margin.left + iw + 8)
    .attr("y", margin.top + y(lastRef[key]) + 4)
    .attr("fill", BAND_COL)
    .attr("opacity", isMed ? 0.95 : 0.65)
    .style("font-size", isMed ? "14px" : "12px")
    .style("font-weight", isMed ? "700" : "400")
    .text(label);
}

// Patient data: line + dots (Imprint green #009E73 — position 1, contrasts with blue bands)
const patLineFn = d3.line()
  .x(d => x(d.age))
  .y(d => y(d.w))
  .curve(d3.curveCatmullRom.alpha(0.5));
g.append("path").datum(patientData)
  .attr("d", patLineFn)
  .attr("fill", "none")
  .attr("stroke", t.palette[0])
  .attr("stroke-width", 2.5);

g.selectAll(".pdot").data(patientData).join("circle")
  .attr("class", "pdot")
  .attr("cx", d => x(d.age))
  .attr("cy", d => y(d.w))
  .attr("r", 5.5)
  .attr("fill", t.palette[0])
  .attr("stroke", t.pageBg)
  .attr("stroke-width", 1.5);

// X axis
const xAxisG = g.append("g")
  .attr("transform", `translate(0,${ih})`)
  .call(d3.axisBottom(x)
    .tickValues([0, 3, 6, 9, 12, 15, 18, 21, 24, 27, 30, 33, 36])
    .tickFormat(d3.format("d")));
xAxisG.selectAll("text").attr("fill", t.inkSoft).style("font-size", "13px");
xAxisG.selectAll("line").attr("stroke", t.grid);
xAxisG.select(".domain").attr("stroke", t.inkSoft);

// Y axis
const yAxisG = g.append("g")
  .call(d3.axisLeft(y).ticks(10));
yAxisG.selectAll("text").attr("fill", t.inkSoft).style("font-size", "13px");
yAxisG.selectAll("line").attr("stroke", t.grid);
yAxisG.select(".domain").attr("stroke", t.inkSoft);

// Axis labels
g.append("text")
  .attr("x", iw / 2).attr("y", ih + 54)
  .attr("text-anchor", "middle")
  .attr("fill", t.inkSoft)
  .style("font-size", "15px")
  .text("Age (months)");

g.append("text")
  .attr("transform", "rotate(-90)")
  .attr("x", -ih / 2).attr("y", -64)
  .attr("text-anchor", "middle")
  .attr("fill", t.inkSoft)
  .style("font-size", "15px")
  .text("Weight (kg)");

// Legend
const lx = iw - 244;
const ly = 12;

g.append("line")
  .attr("x1", lx).attr("y1", ly + 7)
  .attr("x2", lx + 26).attr("y2", ly + 7)
  .attr("stroke", t.palette[0]).attr("stroke-width", 2.5);
g.append("circle")
  .attr("cx", lx + 13).attr("cy", ly + 7).attr("r", 4.5)
  .attr("fill", t.palette[0]).attr("stroke", t.pageBg).attr("stroke-width", 1.5);
g.append("text")
  .attr("x", lx + 34).attr("y", ly + 12)
  .attr("fill", t.ink).style("font-size", "13px")
  .text("Patient trajectory");

g.append("rect")
  .attr("x", lx).attr("y", ly + 26).attr("width", 26).attr("height", 14)
  .attr("fill", BAND_COL).attr("opacity", 0.22);
g.append("line")
  .attr("x1", lx).attr("y1", ly + 33)
  .attr("x2", lx + 26).attr("y2", ly + 33)
  .attr("stroke", BAND_COL).attr("stroke-width", 2.0).attr("opacity", 0.85);
g.append("text")
  .attr("x", lx + 34).attr("y", ly + 38)
  .attr("fill", t.ink).style("font-size", "13px")
  .text("WHO reference bands");

// Title (scaled for length)
const titleStr = "Boys Weight-for-Age · line-growth-percentile · javascript · d3 · anyplot.ai";
const titlePx = Math.max(16, Math.round(22 * 67 / titleStr.length));
svg.append("text")
  .attr("x", width / 2).attr("y", 46)
  .attr("text-anchor", "middle")
  .attr("fill", t.ink)
  .style("font-size", `${titlePx}px`)
  .style("font-weight", "600")
  .text(titleStr);

// Subtitle
svg.append("text")
  .attr("x", width / 2).attr("y", 68)
  .attr("text-anchor", "middle")
  .attr("fill", t.inkSoft)
  .style("font-size", "13px")
  .text("WHO Growth Standards · Boys 0–36 months");
Runnable source as JSON, for any HTTP client: https://api.anyplot.ai/specs/line-growth-percentile/d3/code. Any spec id and library id listed in llms-full.txt fit the same URL shape; every URL below is complete and callable.
{
  "spec_id": "line-growth-percentile",
  "language": "javascript",
  "library": "d3",
  "page": "https://anyplot.ai/line-growth-percentile/javascript/d3",
  "hub": "https://anyplot.ai/line-growth-percentile",
  "code_json": "https://api.anyplot.ai/specs/line-growth-percentile/d3/code",
  "spec_json": "https://api.anyplot.ai/specs/line-growth-percentile",
  "render_light_png": "https://storage.googleapis.com/anyplot-images/plots/line-growth-percentile/javascript/d3/plot-light.png",
  "render_dark_png": "https://storage.googleapis.com/anyplot-images/plots/line-growth-percentile/javascript/d3/plot-dark.png",
  "interactive_light_html": "https://storage.googleapis.com/anyplot-images/plots/line-growth-percentile/javascript/d3/plot-light.html",
  "interactive_dark_html": "https://storage.googleapis.com/anyplot-images/plots/line-growth-percentile/javascript/d3/plot-dark.html",
  "quality_score": 90.0,
  "license": "MIT",
  "guide": "https://anyplot.ai/llms.txt"
}
Part of Pediatric Growth Chart with Percentile Curves on anyplot.ai.