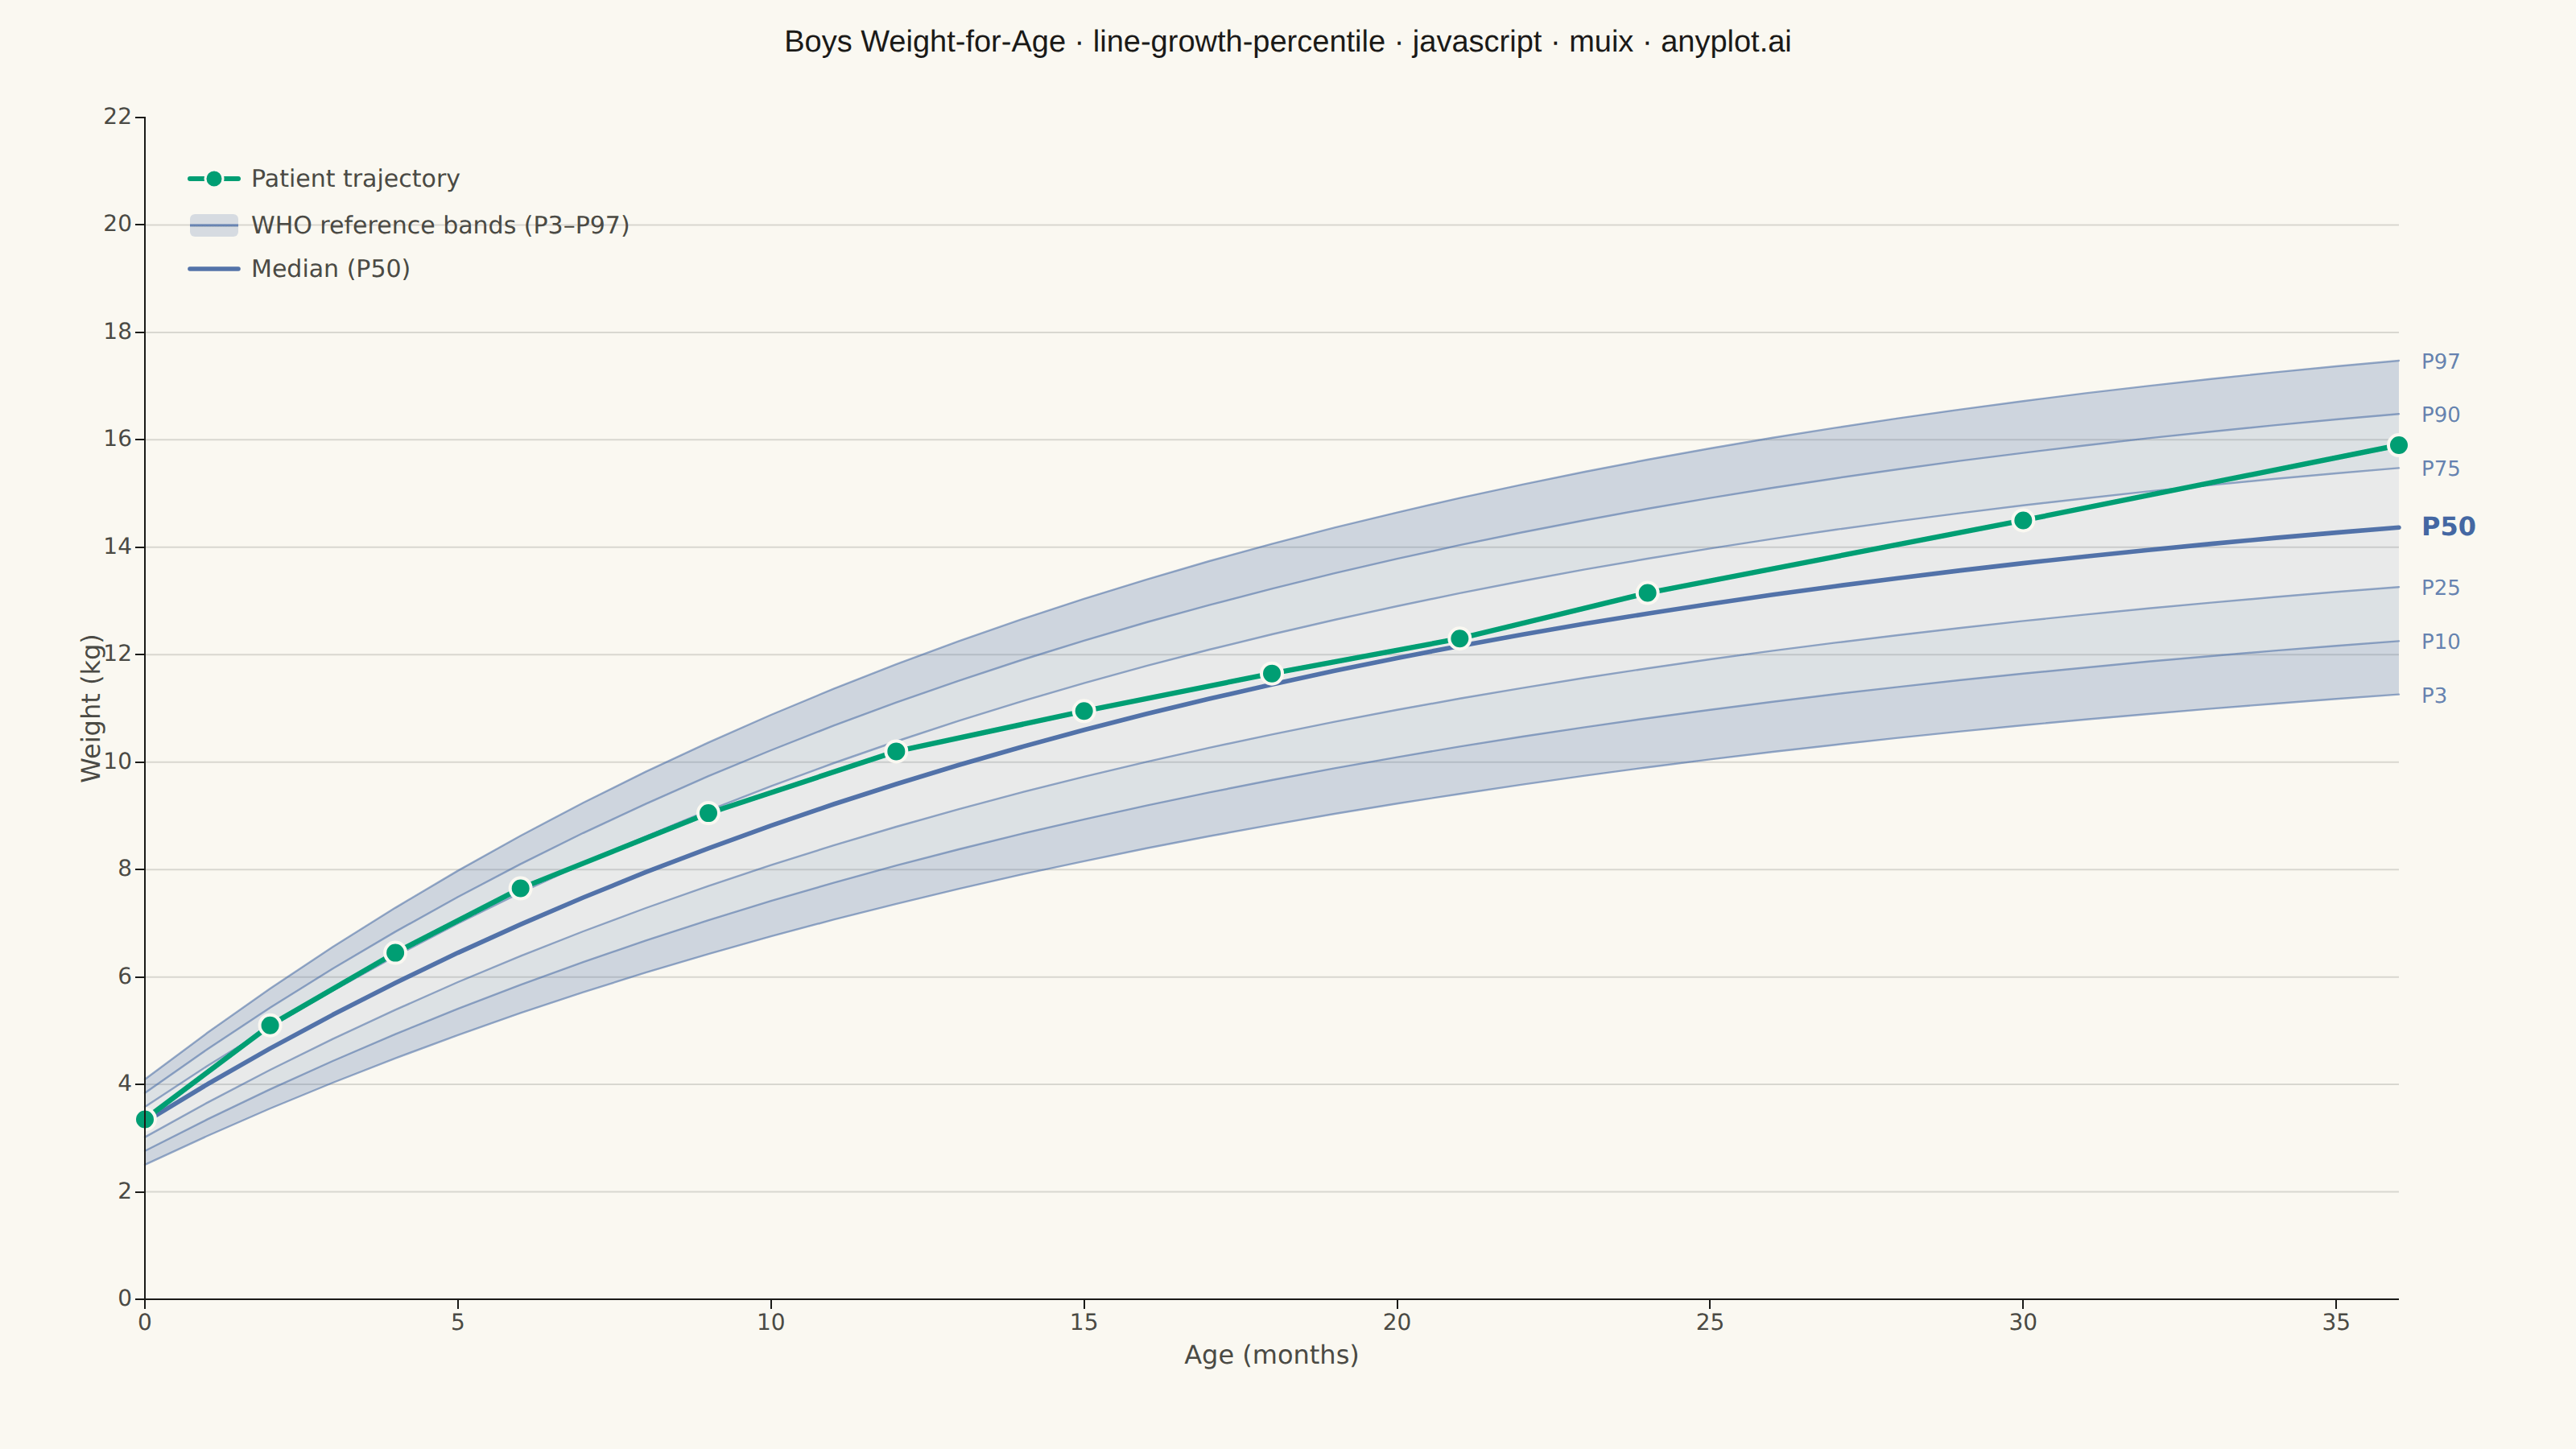
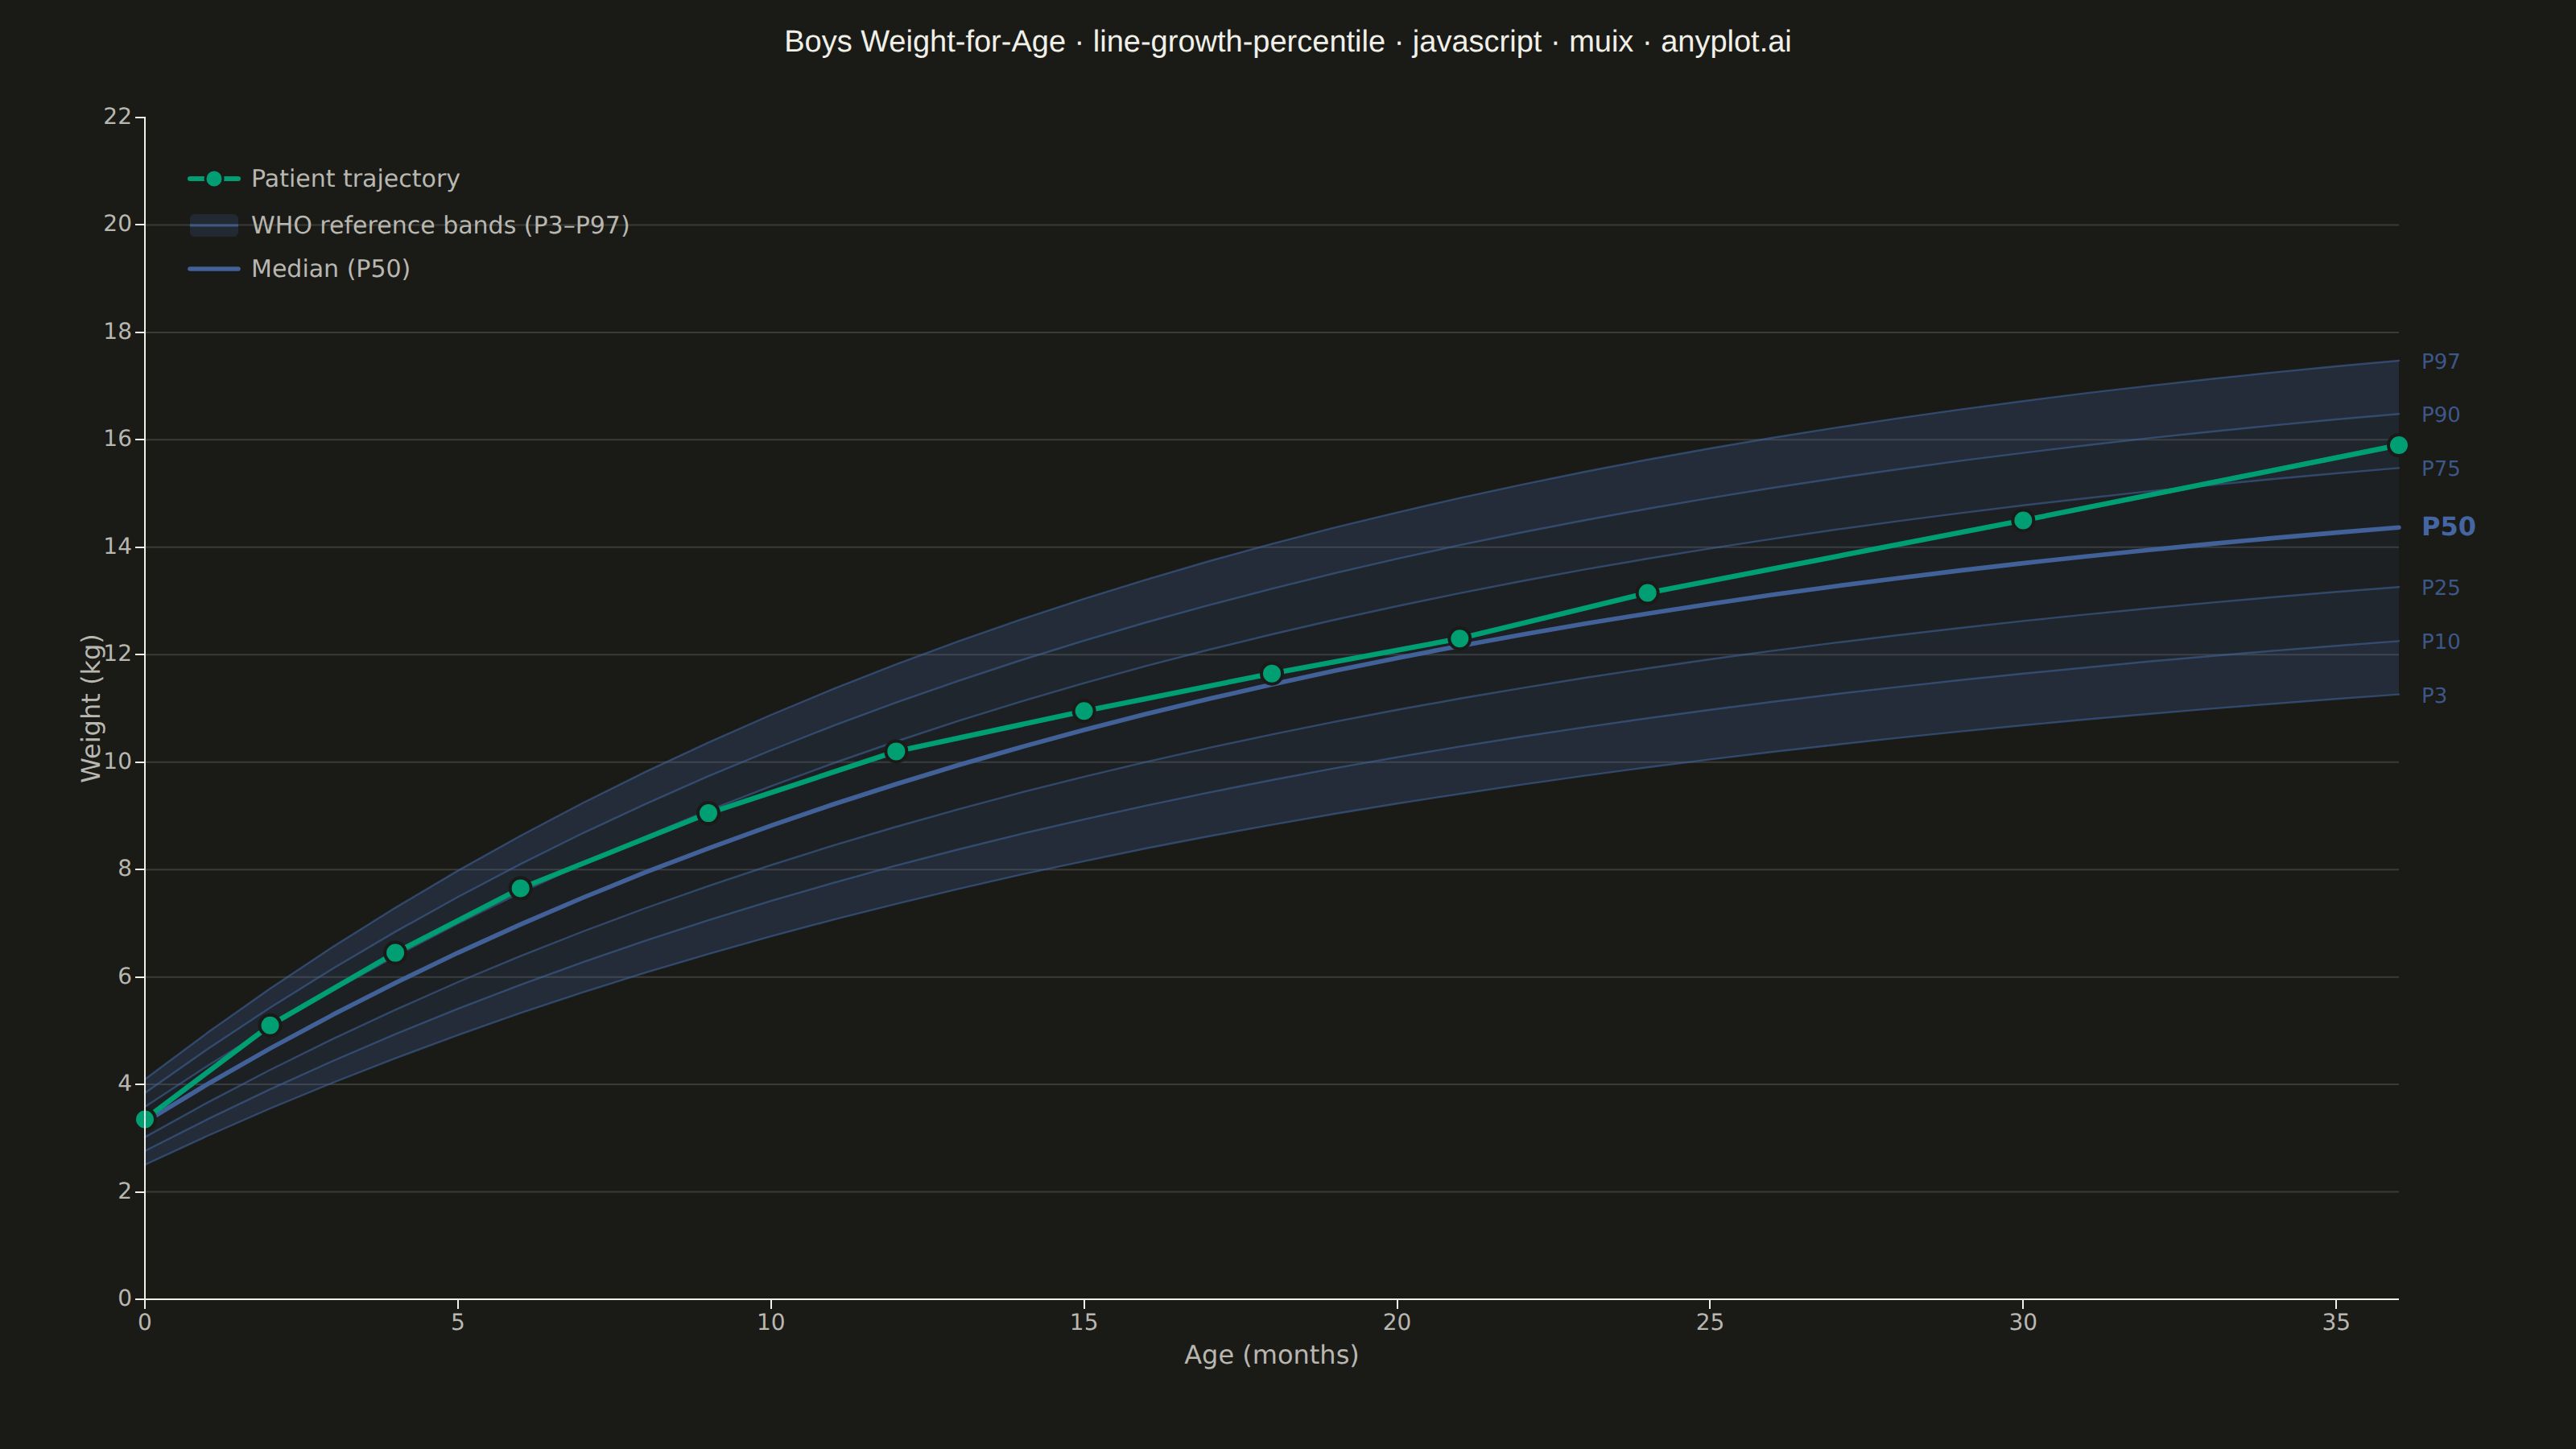
A WHO/CDC-style growth chart displaying smooth percentile curves (3rd, 10th, 25th, 50th, 75th, 90th, 97th) as colored bands, with individual patient data points overlaid and connected by a line. This chart is a standard clinical tool for monitoring child development metrics such as height, weight, or BMI across age. It enables quick visual assessment of whether a child's growth trajectory falls within expected population ranges.
// anyplot.ai
// line-growth-percentile: Pediatric Growth Chart with Percentile Curves
// Library: muix 7.29.1 | JavaScript 22.22.3
// Quality: 90/100 | Created: 2026-06-20
//# anyplot-orientation: landscape
// anyplot.ai
// line-growth-percentile: Pediatric Growth Chart with Percentile Curves
// Library: MUI X Charts | React | Node 22
// License: @mui/x-charts — MIT (community). Pro/Premium are out of scope.
// Quality: pending | Created: 2026-06-20

import { ChartContainer } from "@mui/x-charts/ChartContainer";
import { ChartsXAxis } from "@mui/x-charts/ChartsXAxis";
import { ChartsYAxis } from "@mui/x-charts/ChartsYAxis";
import { useDrawingArea } from "@mui/x-charts/hooks";
import Box from "@mui/material/Box";
import Typography from "@mui/material/Typography";

const t = window.ANYPLOT_TOKENS;
const FONT = "system-ui, -apple-system, sans-serif";
const BLUE = "#4467A3";      // Imprint palette pos 3 — WHO reference band color (boys)
const GREEN = t.palette[0];  // "#009E73" — brand green, first categorical series (patient)

// WHO Boys weight-for-age reference data (0–36 months)
const ages = Array.from({ length: 37 }, (_, i) => i);
const X_MAX = 36;
const Y_MIN = 0;
const Y_MAX = 22;

// Median weight growth model approximating WHO Boys standard
function medianWeight(ageM) {
  return 16 - 12.7 * Math.exp(-0.057 * ageM);
}

// Coefficient of variation (decreasing slightly with age)
function cvFn(ageM) {
  return 0.128 - 0.013 * ageM / 36;
}

// Percentile z-scores and labels (P3 → P97)
const Z_SCORES = [-1.88, -1.28, -0.67, 0, 0.67, 1.28, 1.88];
const P_LABELS = ["P3", "P10", "P25", "P50", "P75", "P90", "P97"];

// Compute all 7 percentile curves (37 age points each)
const pctArrays = Z_SCORES.map((z) =>
  ages.map((a) => medianWeight(a) * (1 + z * cvFn(a)))
);

// Individual patient well-child visit weights (boy tracking slightly above median)
const patientAges    = [0,    2,    4,    6,    9,    12,    15,    18,    21,    24,    30,    36];
const patientWeights = [3.35, 5.10, 6.45, 7.65, 9.05, 10.20, 10.95, 11.65, 12.30, 13.15, 14.50, 15.90];

// Band fill config [lower percentile index, upper index, opacity]
// Outer bands (extreme percentiles) are darker; inner band (P25–P75) is lightest
const BANDS = [
  [0, 1, 0.24],   // P3 → P10  (outer, darkest)
  [1, 2, 0.16],   // P10 → P25 (middle)
  [2, 4, 0.09],   // P25 → P75 (inner, lightest)
  [4, 5, 0.16],   // P75 → P90 (middle)
  [5, 6, 0.24],   // P90 → P97 (outer, darkest)
];

// Horizontal grid tick positions
const Y_GRID = [2, 4, 6, 8, 10, 12, 14, 16, 18, 20];

// Build a closed SVG path for a filled band between two percentile curves
function makeBandPath(lowerArr, upperArr, toX, toY) {
  let d = `M ${toX(0).toFixed(1)} ${toY(upperArr[0]).toFixed(1)}`;
  for (let i = 1; i < ages.length; i++) {
    d += ` L ${toX(i).toFixed(1)} ${toY(upperArr[i]).toFixed(1)}`;
  }
  for (let i = ages.length - 1; i >= 0; i--) {
    d += ` L ${toX(i).toFixed(1)} ${toY(lowerArr[i]).toFixed(1)}`;
  }
  return d + " Z";
}

// Build an open SVG path for a single percentile line
function makeLinePath(arr, toX, toY) {
  return arr
    .map((v, i) => `${i === 0 ? "M" : "L"} ${toX(i).toFixed(1)} ${toY(v).toFixed(1)}`)
    .join(" ");
}

// ---- Custom SVG layers (must run inside ChartContainer context) ----

function GridLayer() {
  const { left, top, width, height } = useDrawingArea();
  const toY = (w) => top + (1 - (w - Y_MIN) / (Y_MAX - Y_MIN)) * height;
  return (
    <g>
      {Y_GRID.map((w) => (
        <line
          key={w}
          x1={left}
          y1={toY(w)}
          x2={left + width}
          y2={toY(w)}
          stroke={t.grid}
          strokeWidth={1}
        />
      ))}
    </g>
  );
}

function PercentileBands() {
  const { left, top, width, height } = useDrawingArea();
  const toX = (i) => left + (i / X_MAX) * width;
  const toY = (w) => top + (1 - (w - Y_MIN) / (Y_MAX - Y_MIN)) * height;
  return (
    <g>
      {BANDS.map(([lo, hi, op], idx) => (
        <path
          key={idx}
          d={makeBandPath(pctArrays[lo], pctArrays[hi], toX, toY)}
          fill={BLUE}
          fillOpacity={op}
          stroke="none"
        />
      ))}
    </g>
  );
}

function PercentileLines() {
  const { left, top, width, height } = useDrawingArea();
  const toX = (i) => left + (i / X_MAX) * width;
  const toY = (w) => top + (1 - (w - Y_MIN) / (Y_MAX - Y_MIN)) * height;
  return (
    <g fill="none">
      {pctArrays.map((arr, i) => {
        const isP50 = i === 3;
        return (
          <path
            key={i}
            d={makeLinePath(arr, toX, toY)}
            stroke={BLUE}
            strokeWidth={isP50 ? 2.8 : 1.2}
            strokeOpacity={isP50 ? 0.92 : 0.55}
            strokeLinecap="round"
            strokeLinejoin="round"
          />
        );
      })}
    </g>
  );
}

function PatientLayer() {
  const { left, top, width, height } = useDrawingArea();
  const toX = (a) => left + (a / X_MAX) * width;
  const toY = (w) => top + (1 - (w - Y_MIN) / (Y_MAX - Y_MIN)) * height;
  const pts = patientAges.map((a, i) => [toX(a), toY(patientWeights[i])]);
  const d = pts
    .map(([x, y], i) => `${i === 0 ? "M" : "L"} ${x.toFixed(1)} ${y.toFixed(1)}`)
    .join(" ");
  return (
    <g>
      <path
        d={d}
        stroke={GREEN}
        strokeWidth={3.2}
        fill="none"
        strokeLinecap="round"
        strokeLinejoin="round"
      />
      {pts.map(([x, y], i) => (
        <circle
          key={i}
          cx={x}
          cy={y}
          r={6.5}
          fill={GREEN}
          stroke={t.pageBg}
          strokeWidth={2}
        />
      ))}
    </g>
  );
}

function PercentileLabels() {
  const { left, top, width, height } = useDrawingArea();
  const toX = (a) => left + (a / X_MAX) * width;
  const toY = (w) => top + (1 - (w - Y_MIN) / (Y_MAX - Y_MIN)) * height;
  const lx = toX(36) + 14;
  return (
    <g fontFamily={FONT}>
      {P_LABELS.map((label, i) => {
        const yPx = toY(pctArrays[i][36]);
        const isP50 = i === 3;
        return (
          <text
            key={i}
            x={lx}
            y={yPx + 5}
            fontSize={isP50 ? 16 : 13}
            fontWeight={isP50 ? "700" : "500"}
            fill={BLUE}
            fillOpacity={isP50 ? 1 : 0.82}
          >
            {label}
          </text>
        );
      })}
    </g>
  );
}

function LegendLayer() {
  const { left, top } = useDrawingArea();
  const lx = left + 28;
  const ly = top + 38;
  return (
    <g fontFamily={FONT} fontSize={15}>
      {/* Patient swatch */}
      <line x1={lx} y1={ly} x2={lx + 30} y2={ly} stroke={GREEN} strokeWidth={3} strokeLinecap="round" />
      <circle cx={lx + 15} cy={ly} r={5.5} fill={GREEN} stroke={t.pageBg} strokeWidth={1.5} />
      <text x={lx + 38} y={ly + 5} fill={t.inkSoft}>
        Patient trajectory
      </text>
      {/* Band swatch */}
      <rect x={lx} y={ly + 22} width={30} height={14} fill={BLUE} fillOpacity={0.20} rx={3} />
      <line
        x1={lx}
        y1={ly + 29}
        x2={lx + 30}
        y2={ly + 29}
        stroke={BLUE}
        strokeWidth={1.5}
        strokeOpacity={0.7}
      />
      <text x={lx + 38} y={ly + 34} fill={t.inkSoft}>
        WHO reference bands (P3–P97)
      </text>
      {/* P50 swatch */}
      <line
        x1={lx}
        y1={ly + 56}
        x2={lx + 30}
        y2={ly + 56}
        stroke={BLUE}
        strokeWidth={2.8}
        strokeOpacity={0.92}
        strokeLinecap="round"
      />
      <text x={lx + 38} y={ly + 61} fill={t.inkSoft}>
        Median (P50)
      </text>
    </g>
  );
}

// Dummy series data to anchor axis scales (all values null — renders nothing)
const anchorSeries = [
  {
    type: "line" as const,
    id: "_anchor",
    data: ages.map(() => null),
    color: "transparent",
    showMark: false,
  },
];

export default function Chart() {
  const { width, height } = window.ANYPLOT_SIZE;
  const TITLE =
    "Boys Weight-for-Age · line-growth-percentile · javascript · muix · anyplot.ai";
  const titleH = 58;

  return (
    <Box
      sx={{
        width,
        height,
        bgcolor: t.pageBg,
        display: "flex",
        flexDirection: "column",
        pt: "16px",
      }}
    >
      <Typography
        sx={{
          color: t.ink,
          fontSize: 19,
          fontWeight: 500,
          textAlign: "center",
          lineHeight: 1.2,
          mb: "6px",
          fontFamily: "inherit",
        }}
      >
        {TITLE}
      </Typography>

      <ChartContainer
        width={width}
        height={height - titleH}
        margin={{ left: 90, right: 110, top: 28, bottom: 80 }}
        series={anchorSeries}
        xAxis={[
          {
            scaleType: "linear",
            min: 0,
            max: X_MAX,
            tickMinStep: 6,
            valueFormatter: (v) => String(v),
          },
        ]}
        yAxis={[
          {
            scaleType: "linear",
            min: Y_MIN,
            max: Y_MAX,
            tickMinStep: 2,
            valueFormatter: (v) => String(v),
          },
        ]}
      >
        <GridLayer />
        <PercentileBands />
        <PercentileLines />
        <PatientLayer />
        <LegendLayer />
        <PercentileLabels />
        <ChartsXAxis
          label="Age (months)"
          tickLabelStyle={{ fontSize: 14, fill: t.inkSoft, fontFamily: FONT }}
          labelStyle={{
            fontSize: 16,
            fontWeight: "500",
            fill: t.inkSoft,
            fontFamily: FONT,
          }}
        />
        <ChartsYAxis
          label="Weight (kg)"
          tickLabelStyle={{ fontSize: 14, fill: t.inkSoft, fontFamily: FONT }}
          labelStyle={{
            fontSize: 16,
            fontWeight: "500",
            fill: t.inkSoft,
            fontFamily: FONT,
          }}
        />
      </ChartContainer>
    </Box>
  );
}
Runnable source as JSON, for any HTTP client: https://api.anyplot.ai/specs/line-growth-percentile/muix/code. Any spec id and library id listed in llms-full.txt fit the same URL shape; every URL below is complete and callable.
{
  "spec_id": "line-growth-percentile",
  "language": "javascript",
  "library": "muix",
  "page": "https://anyplot.ai/line-growth-percentile/javascript/muix",
  "hub": "https://anyplot.ai/line-growth-percentile",
  "code_json": "https://api.anyplot.ai/specs/line-growth-percentile/muix/code",
  "spec_json": "https://api.anyplot.ai/specs/line-growth-percentile",
  "render_light_png": "https://storage.googleapis.com/anyplot-images/plots/line-growth-percentile/javascript/muix/plot-light.png",
  "render_dark_png": "https://storage.googleapis.com/anyplot-images/plots/line-growth-percentile/javascript/muix/plot-dark.png",
  "interactive_light_html": "https://storage.googleapis.com/anyplot-images/plots/line-growth-percentile/javascript/muix/plot-light.html",
  "interactive_dark_html": "https://storage.googleapis.com/anyplot-images/plots/line-growth-percentile/javascript/muix/plot-dark.html",
  "quality_score": 90.0,
  "license": "MIT",
  "guide": "https://anyplot.ai/llms.txt"
}
Part of Pediatric Growth Chart with Percentile Curves on anyplot.ai.