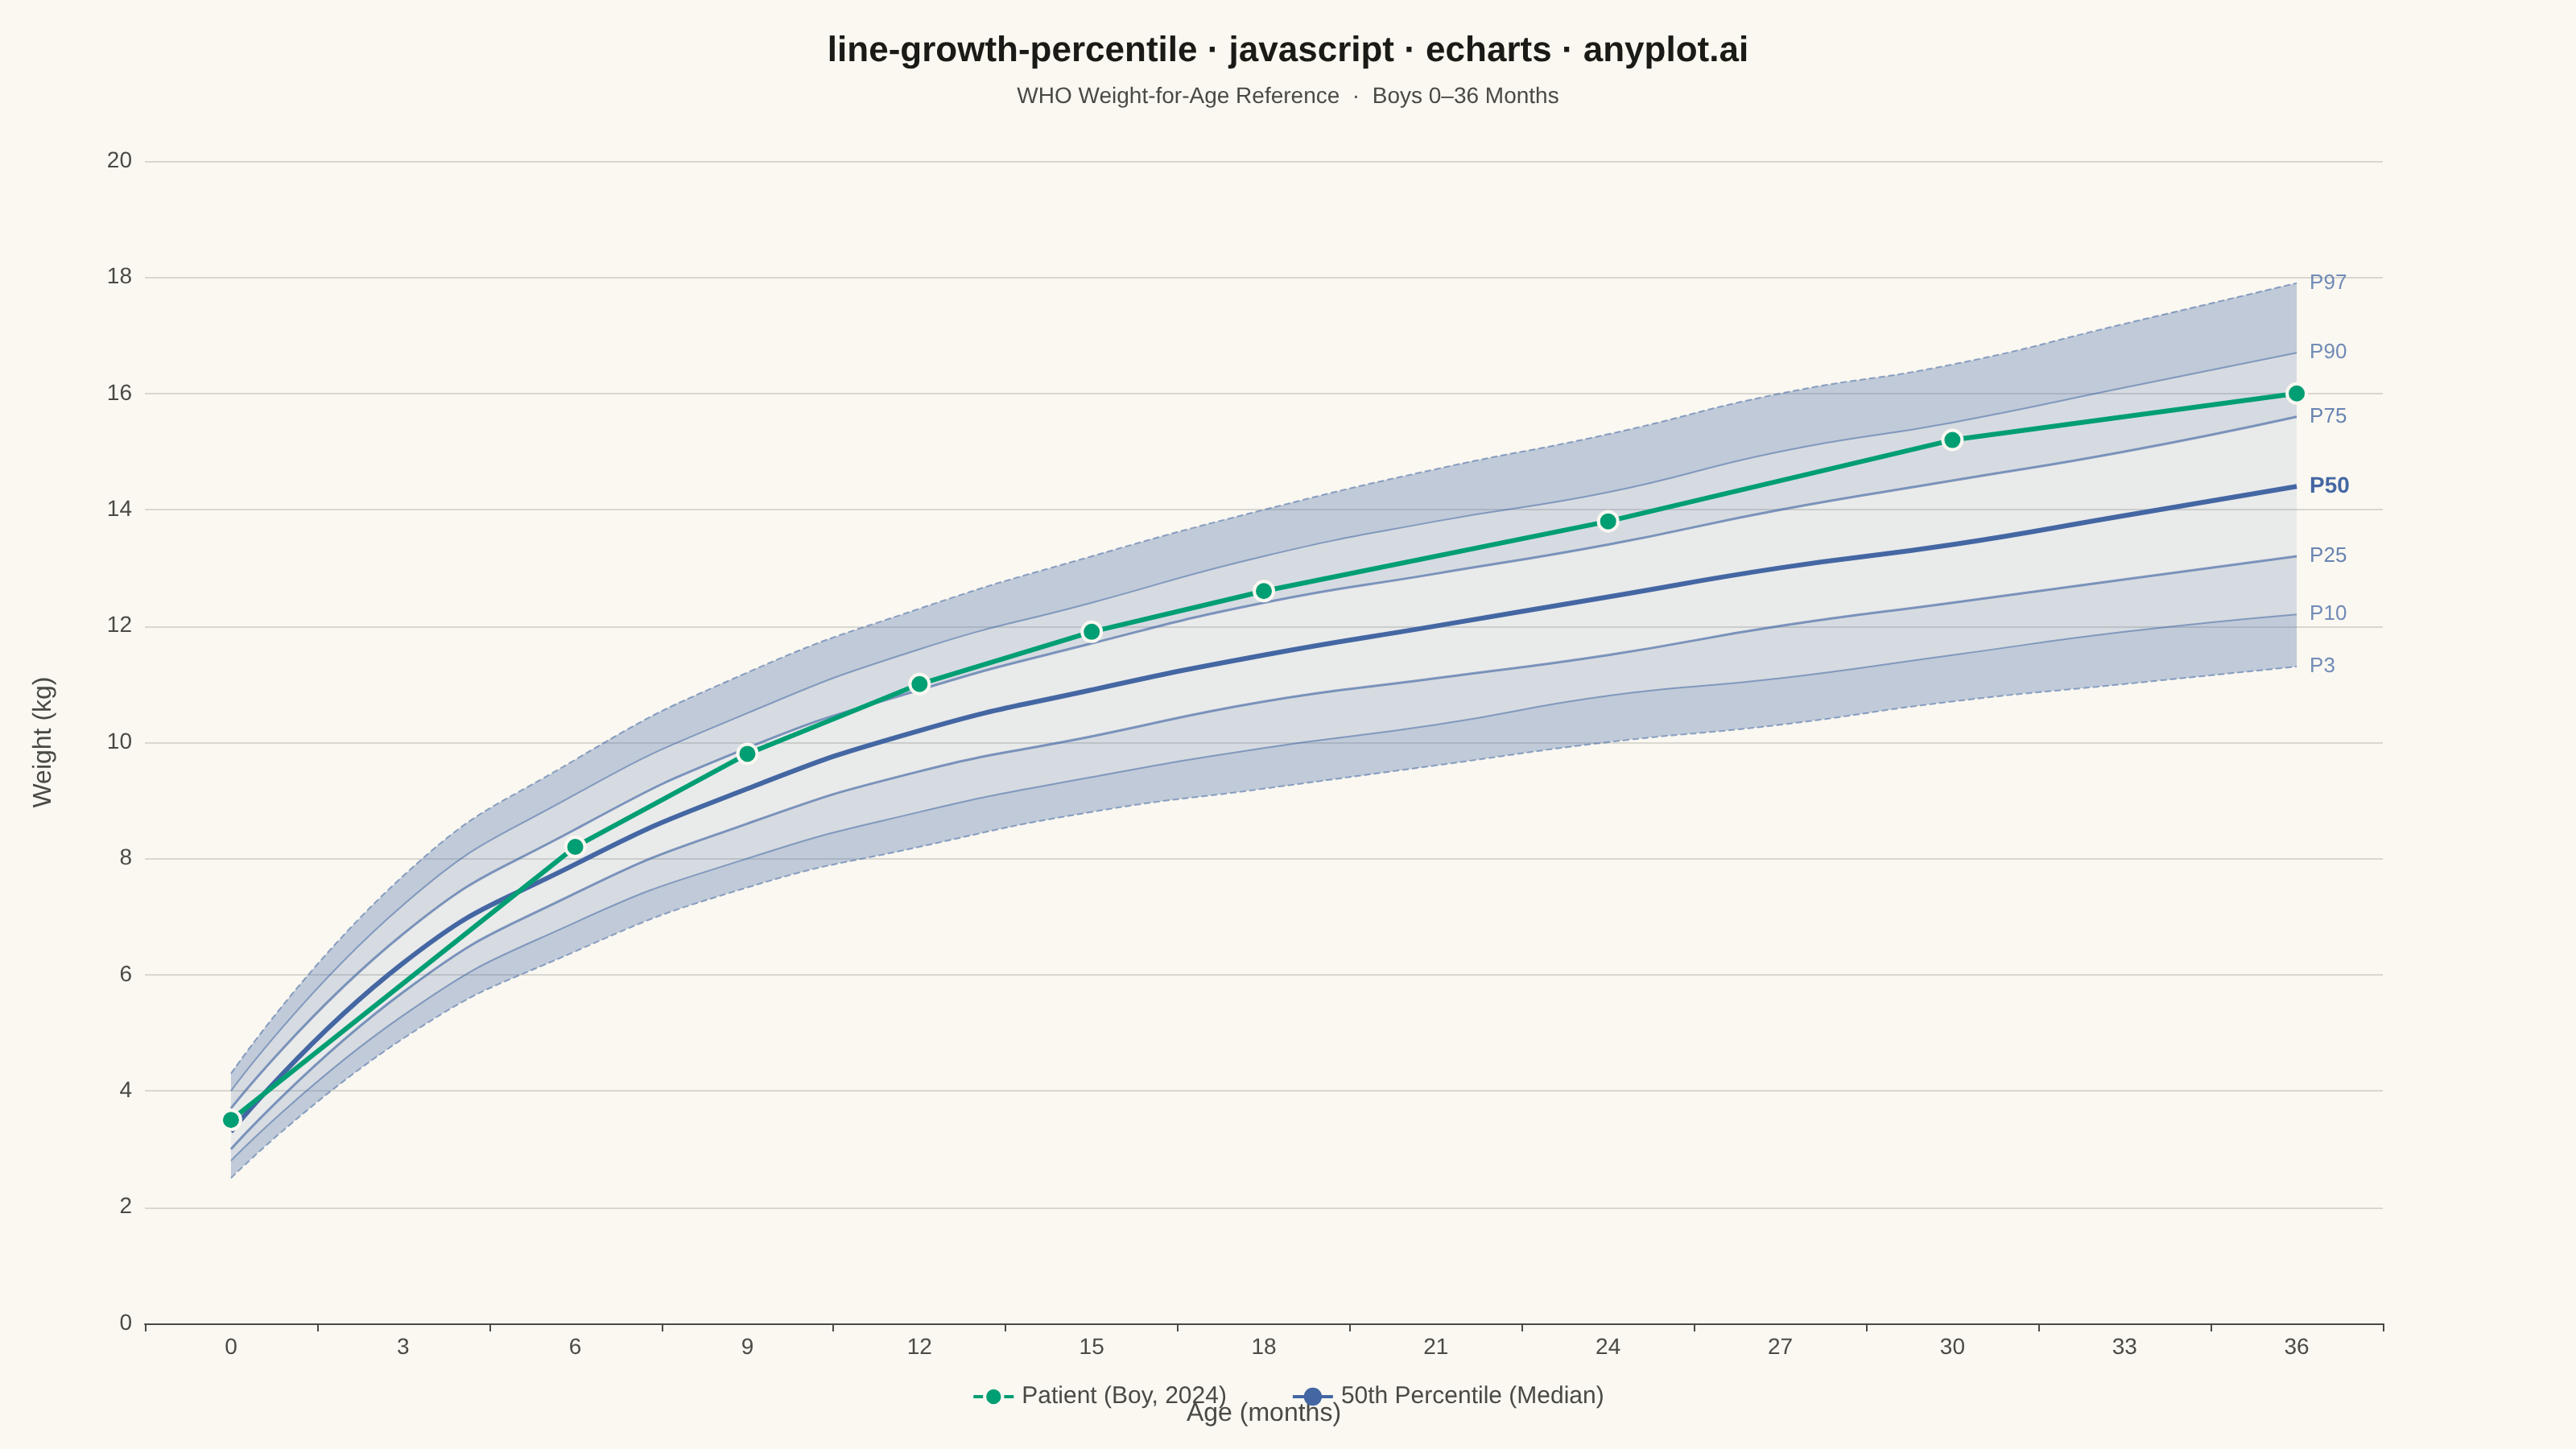
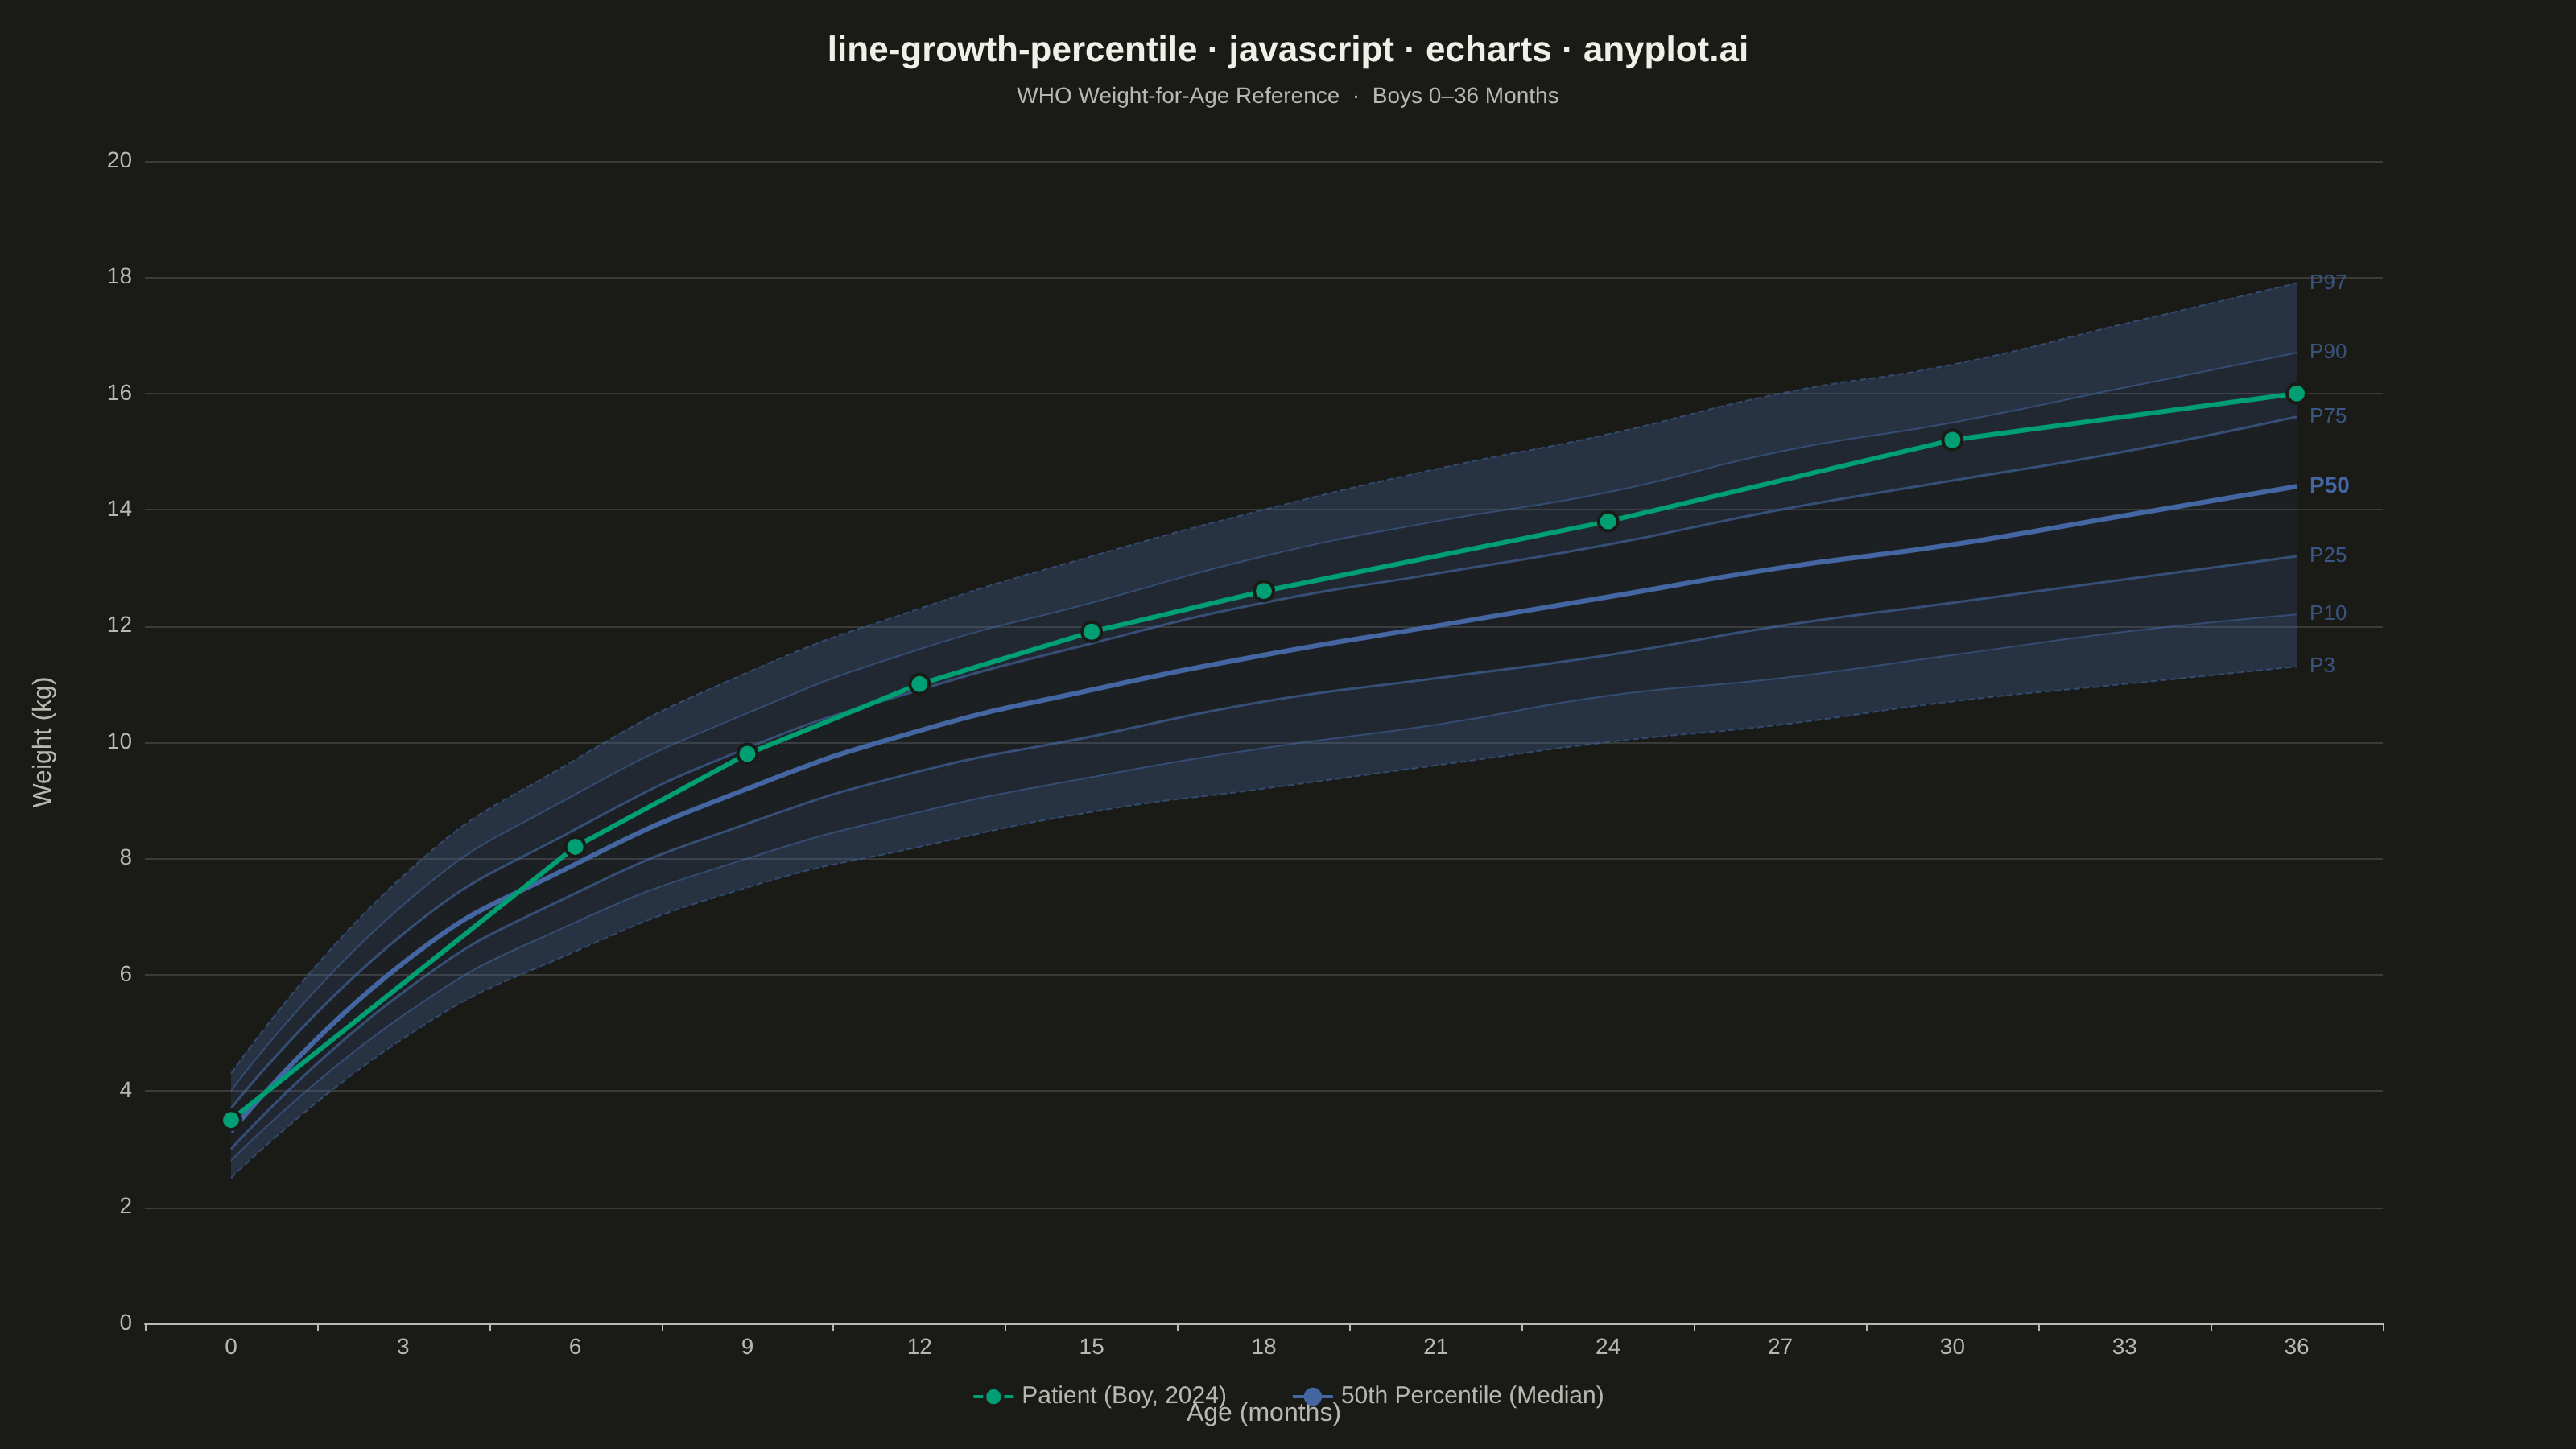
A WHO/CDC-style growth chart displaying smooth percentile curves (3rd, 10th, 25th, 50th, 75th, 90th, 97th) as colored bands, with individual patient data points overlaid and connected by a line. This chart is a standard clinical tool for monitoring child development metrics such as height, weight, or BMI across age. It enables quick visual assessment of whether a child's growth trajectory falls within expected population ranges.
// anyplot.ai
// line-growth-percentile: Pediatric Growth Chart with Percentile Curves
// Library: echarts 5.5.1 | JavaScript 22.22.3
// Quality: 91/100 | Created: 2026-06-20

const t = window.ANYPLOT_TOKENS;

// Reference ages (months) — every 3 months, 0–36
const ages = [0, 3, 6, 9, 12, 15, 18, 21, 24, 27, 30, 33, 36];
const ageLabels = ages.map(String);

// Approximate WHO weight-for-age reference curves for boys (kg)
const refP3  = [2.5, 4.9, 6.4, 7.5, 8.2,  8.8,  9.2,  9.6, 10.0, 10.3, 10.7, 11.0, 11.3];
const refP10 = [2.8, 5.3, 6.9, 8.0, 8.8,  9.4,  9.9, 10.3, 10.8, 11.1, 11.5, 11.9, 12.2];
const refP25 = [3.0, 5.7, 7.4, 8.6, 9.5, 10.1, 10.7, 11.1, 11.5, 12.0, 12.4, 12.8, 13.2];
const refP50 = [3.3, 6.2, 7.9, 9.2, 10.2, 10.9, 11.5, 12.0, 12.5, 13.0, 13.4, 13.9, 14.4];
const refP75 = [3.7, 6.7, 8.5, 9.9, 10.9, 11.7, 12.4, 12.9, 13.4, 14.0, 14.5, 15.0, 15.6];
const refP90 = [4.0, 7.2, 9.1, 10.5, 11.6, 12.4, 13.2, 13.8, 14.3, 15.0, 15.5, 16.1, 16.7];
const refP97 = [4.3, 7.7, 9.7, 11.2, 12.3, 13.2, 14.0, 14.7, 15.3, 16.0, 16.5, 17.2, 17.9];

// Stacking differences (each band = upper minus lower percentile)
const diff = (u, l) => u.map((v, i) => +(v - l[i]).toFixed(2));
const band3_10  = diff(refP10, refP3);
const band10_25 = diff(refP25, refP10);
const band25_75 = diff(refP75, refP25);
const band75_90 = diff(refP90, refP75);
const band90_97 = diff(refP97, refP90);

// Patient measurements aligned to reference age grid (null = no visit that month)
// Boy tracking around the 65th percentile at well-child visits
const patientData = [3.5, null, 8.2, 9.8, 11.0, 11.9, 12.6, null, 13.8, null, 15.2, null, 16.0];

const boyBlue = "#4467A3";

// --- Init -------------------------------------------------------------------
const chart = echarts.init(document.getElementById("container"));

chart.setOption({
  animation: false,
  color: t.palette,
  backgroundColor: "transparent",

  title: {
    text: "line-growth-percentile · javascript · echarts · anyplot.ai",
    subtext: "WHO Weight-for-Age Reference  ·  Boys 0–36 Months",
    left: "center",
    top: 16,
    textStyle: { color: t.ink, fontSize: 22, fontWeight: "bold" },
    subtextStyle: { color: t.inkSoft, fontSize: 14 },
  },

  legend: {
    data: ["Patient (Boy, 2024)", "50th Percentile (Median)"],
    bottom: 20,
    itemGap: 40,
    textStyle: { color: t.inkSoft, fontSize: 15 },
  },

  grid: { left: 90, right: 120, top: 100, bottom: 78 },

  xAxis: {
    type: "category",
    data: ageLabels,
    name: "Age (months)",
    nameLocation: "middle",
    nameGap: 48,
    nameTextStyle: { color: t.inkSoft, fontSize: 16 },
    axisLabel: { color: t.inkSoft, fontSize: 14 },
    axisLine: { lineStyle: { color: t.inkSoft } },
    axisTick: { lineStyle: { color: t.inkSoft } },
    splitLine: { show: false },
  },

  yAxis: {
    type: "value",
    name: "Weight (kg)",
    nameLocation: "middle",
    nameGap: 55,
    nameTextStyle: { color: t.inkSoft, fontSize: 16 },
    min: 0,
    max: 20,
    interval: 2,
    axisLabel: { color: t.inkSoft, fontSize: 14 },
    axisLine: { lineStyle: { color: t.inkSoft } },
    axisTick: { lineStyle: { color: t.inkSoft } },
    splitLine: { lineStyle: { color: t.grid } },
  },

  series: [
    // ── Stacked band fills (bottom to top) ──────────────────────────────────
    // Base: invisible fill from 0 to P3
    {
      type: "line", stack: "perc", silent: true, legendHoverLink: false,
      data: refP3, symbol: "none", smooth: true,
      lineStyle: { opacity: 0 },
      areaStyle: { color: "transparent" },
    },
    // P3–P10 (outer lower band — moderate fill)
    {
      type: "line", stack: "perc", silent: true, legendHoverLink: false,
      data: band3_10, symbol: "none", smooth: true,
      lineStyle: { opacity: 0 },
      areaStyle: { color: "rgba(68,103,163,0.45)" },
    },
    // P10–P25
    {
      type: "line", stack: "perc", silent: true, legendHoverLink: false,
      data: band10_25, symbol: "none", smooth: true,
      lineStyle: { opacity: 0 },
      areaStyle: { color: "rgba(68,103,163,0.28)" },
    },
    // P25–P75 (lightest — the normal range)
    {
      type: "line", stack: "perc", silent: true, legendHoverLink: false,
      data: band25_75, symbol: "none", smooth: true,
      lineStyle: { opacity: 0 },
      areaStyle: { color: "rgba(68,103,163,0.13)" },
    },
    // P75–P90
    {
      type: "line", stack: "perc", silent: true, legendHoverLink: false,
      data: band75_90, symbol: "none", smooth: true,
      lineStyle: { opacity: 0 },
      areaStyle: { color: "rgba(68,103,163,0.28)" },
    },
    // P90–P97 (outer upper band — moderate fill)
    {
      type: "line", stack: "perc", silent: true, legendHoverLink: false,
      data: band90_97, symbol: "none", smooth: true,
      lineStyle: { opacity: 0 },
      areaStyle: { color: "rgba(68,103,163,0.45)" },
    },

    // ── Percentile reference lines ───────────────────────────────────────────
    {
      type: "line", name: "P3", silent: true, legendHoverLink: false,
      data: refP3, symbol: "none", smooth: true,
      lineStyle: { color: boyBlue, width: 1, opacity: 0.55, type: "dashed" },
      endLabel: { show: true, formatter: () => "P3",
                  color: boyBlue, fontSize: 13, opacity: 0.75 },
    },
    {
      type: "line", name: "P10", silent: true, legendHoverLink: false,
      data: refP10, symbol: "none", smooth: true,
      lineStyle: { color: boyBlue, width: 1, opacity: 0.55 },
      endLabel: { show: true, formatter: () => "P10",
                  color: boyBlue, fontSize: 13, opacity: 0.75 },
    },
    {
      type: "line", name: "P25", silent: true, legendHoverLink: false,
      data: refP25, symbol: "none", smooth: true,
      lineStyle: { color: boyBlue, width: 1.5, opacity: 0.65 },
      endLabel: { show: true, formatter: () => "P25",
                  color: boyBlue, fontSize: 13, opacity: 0.8 },
    },
    // P50 median — thicker, shown in legend
    {
      type: "line", name: "50th Percentile (Median)", silent: true,
      data: refP50, symbol: "none", smooth: true,
      lineStyle: { color: boyBlue, width: 3 },
      itemStyle: { color: boyBlue },
      endLabel: { show: true, formatter: () => "P50",
                  color: boyBlue, fontSize: 14, fontWeight: "bold" },
    },
    {
      type: "line", name: "P75", silent: true, legendHoverLink: false,
      data: refP75, symbol: "none", smooth: true,
      lineStyle: { color: boyBlue, width: 1.5, opacity: 0.65 },
      endLabel: { show: true, formatter: () => "P75",
                  color: boyBlue, fontSize: 13, opacity: 0.8 },
    },
    {
      type: "line", name: "P90", silent: true, legendHoverLink: false,
      data: refP90, symbol: "none", smooth: true,
      lineStyle: { color: boyBlue, width: 1, opacity: 0.55 },
      endLabel: { show: true, formatter: () => "P90",
                  color: boyBlue, fontSize: 13, opacity: 0.75 },
    },
    {
      type: "line", name: "P97", silent: true, legendHoverLink: false,
      data: refP97, symbol: "none", smooth: true,
      lineStyle: { color: boyBlue, width: 1, opacity: 0.55, type: "dashed" },
      endLabel: { show: true, formatter: () => "P97",
                  color: boyBlue, fontSize: 13, opacity: 0.75 },
    },

    // ── Patient trajectory — Imprint position 1 (always first categorical) ──
    {
      type: "line",
      name: "Patient (Boy, 2024)",
      data: patientData,
      connectNulls: true,
      symbol: "circle",
      symbolSize: 12,
      lineStyle: { color: t.palette[0], width: 3 },
      itemStyle: {
        color: t.palette[0],
        borderColor: t.pageBg,
        borderWidth: 2,
      },
    },
  ],
});
Runnable source as JSON, for any HTTP client: https://api.anyplot.ai/specs/line-growth-percentile/echarts/code. Any spec id and library id listed in llms-full.txt fit the same URL shape; every URL below is complete and callable.
{
  "spec_id": "line-growth-percentile",
  "language": "javascript",
  "library": "echarts",
  "page": "https://anyplot.ai/line-growth-percentile/javascript/echarts",
  "hub": "https://anyplot.ai/line-growth-percentile",
  "code_json": "https://api.anyplot.ai/specs/line-growth-percentile/echarts/code",
  "spec_json": "https://api.anyplot.ai/specs/line-growth-percentile",
  "render_light_png": "https://storage.googleapis.com/anyplot-images/plots/line-growth-percentile/javascript/echarts/plot-light.png",
  "render_dark_png": "https://storage.googleapis.com/anyplot-images/plots/line-growth-percentile/javascript/echarts/plot-dark.png",
  "interactive_light_html": "https://storage.googleapis.com/anyplot-images/plots/line-growth-percentile/javascript/echarts/plot-light.html",
  "interactive_dark_html": "https://storage.googleapis.com/anyplot-images/plots/line-growth-percentile/javascript/echarts/plot-dark.html",
  "quality_score": 91.0,
  "license": "MIT",
  "guide": "https://anyplot.ai/llms.txt"
}
Part of Pediatric Growth Chart with Percentile Curves on anyplot.ai.