The same plot in 14 other libraries — JavaScript: D3.js, Apache ECharts, Highcharts, MUI X Charts; Python: Altair, Bokeh, lets-plot, Matplotlib, Plotly, plotnine, Pygal, Seaborn; R: ggplot2; Julia: Makie.jl. Compare all 15 side by side: Clustered Marker Map in Python, R, Julia and JavaScript.
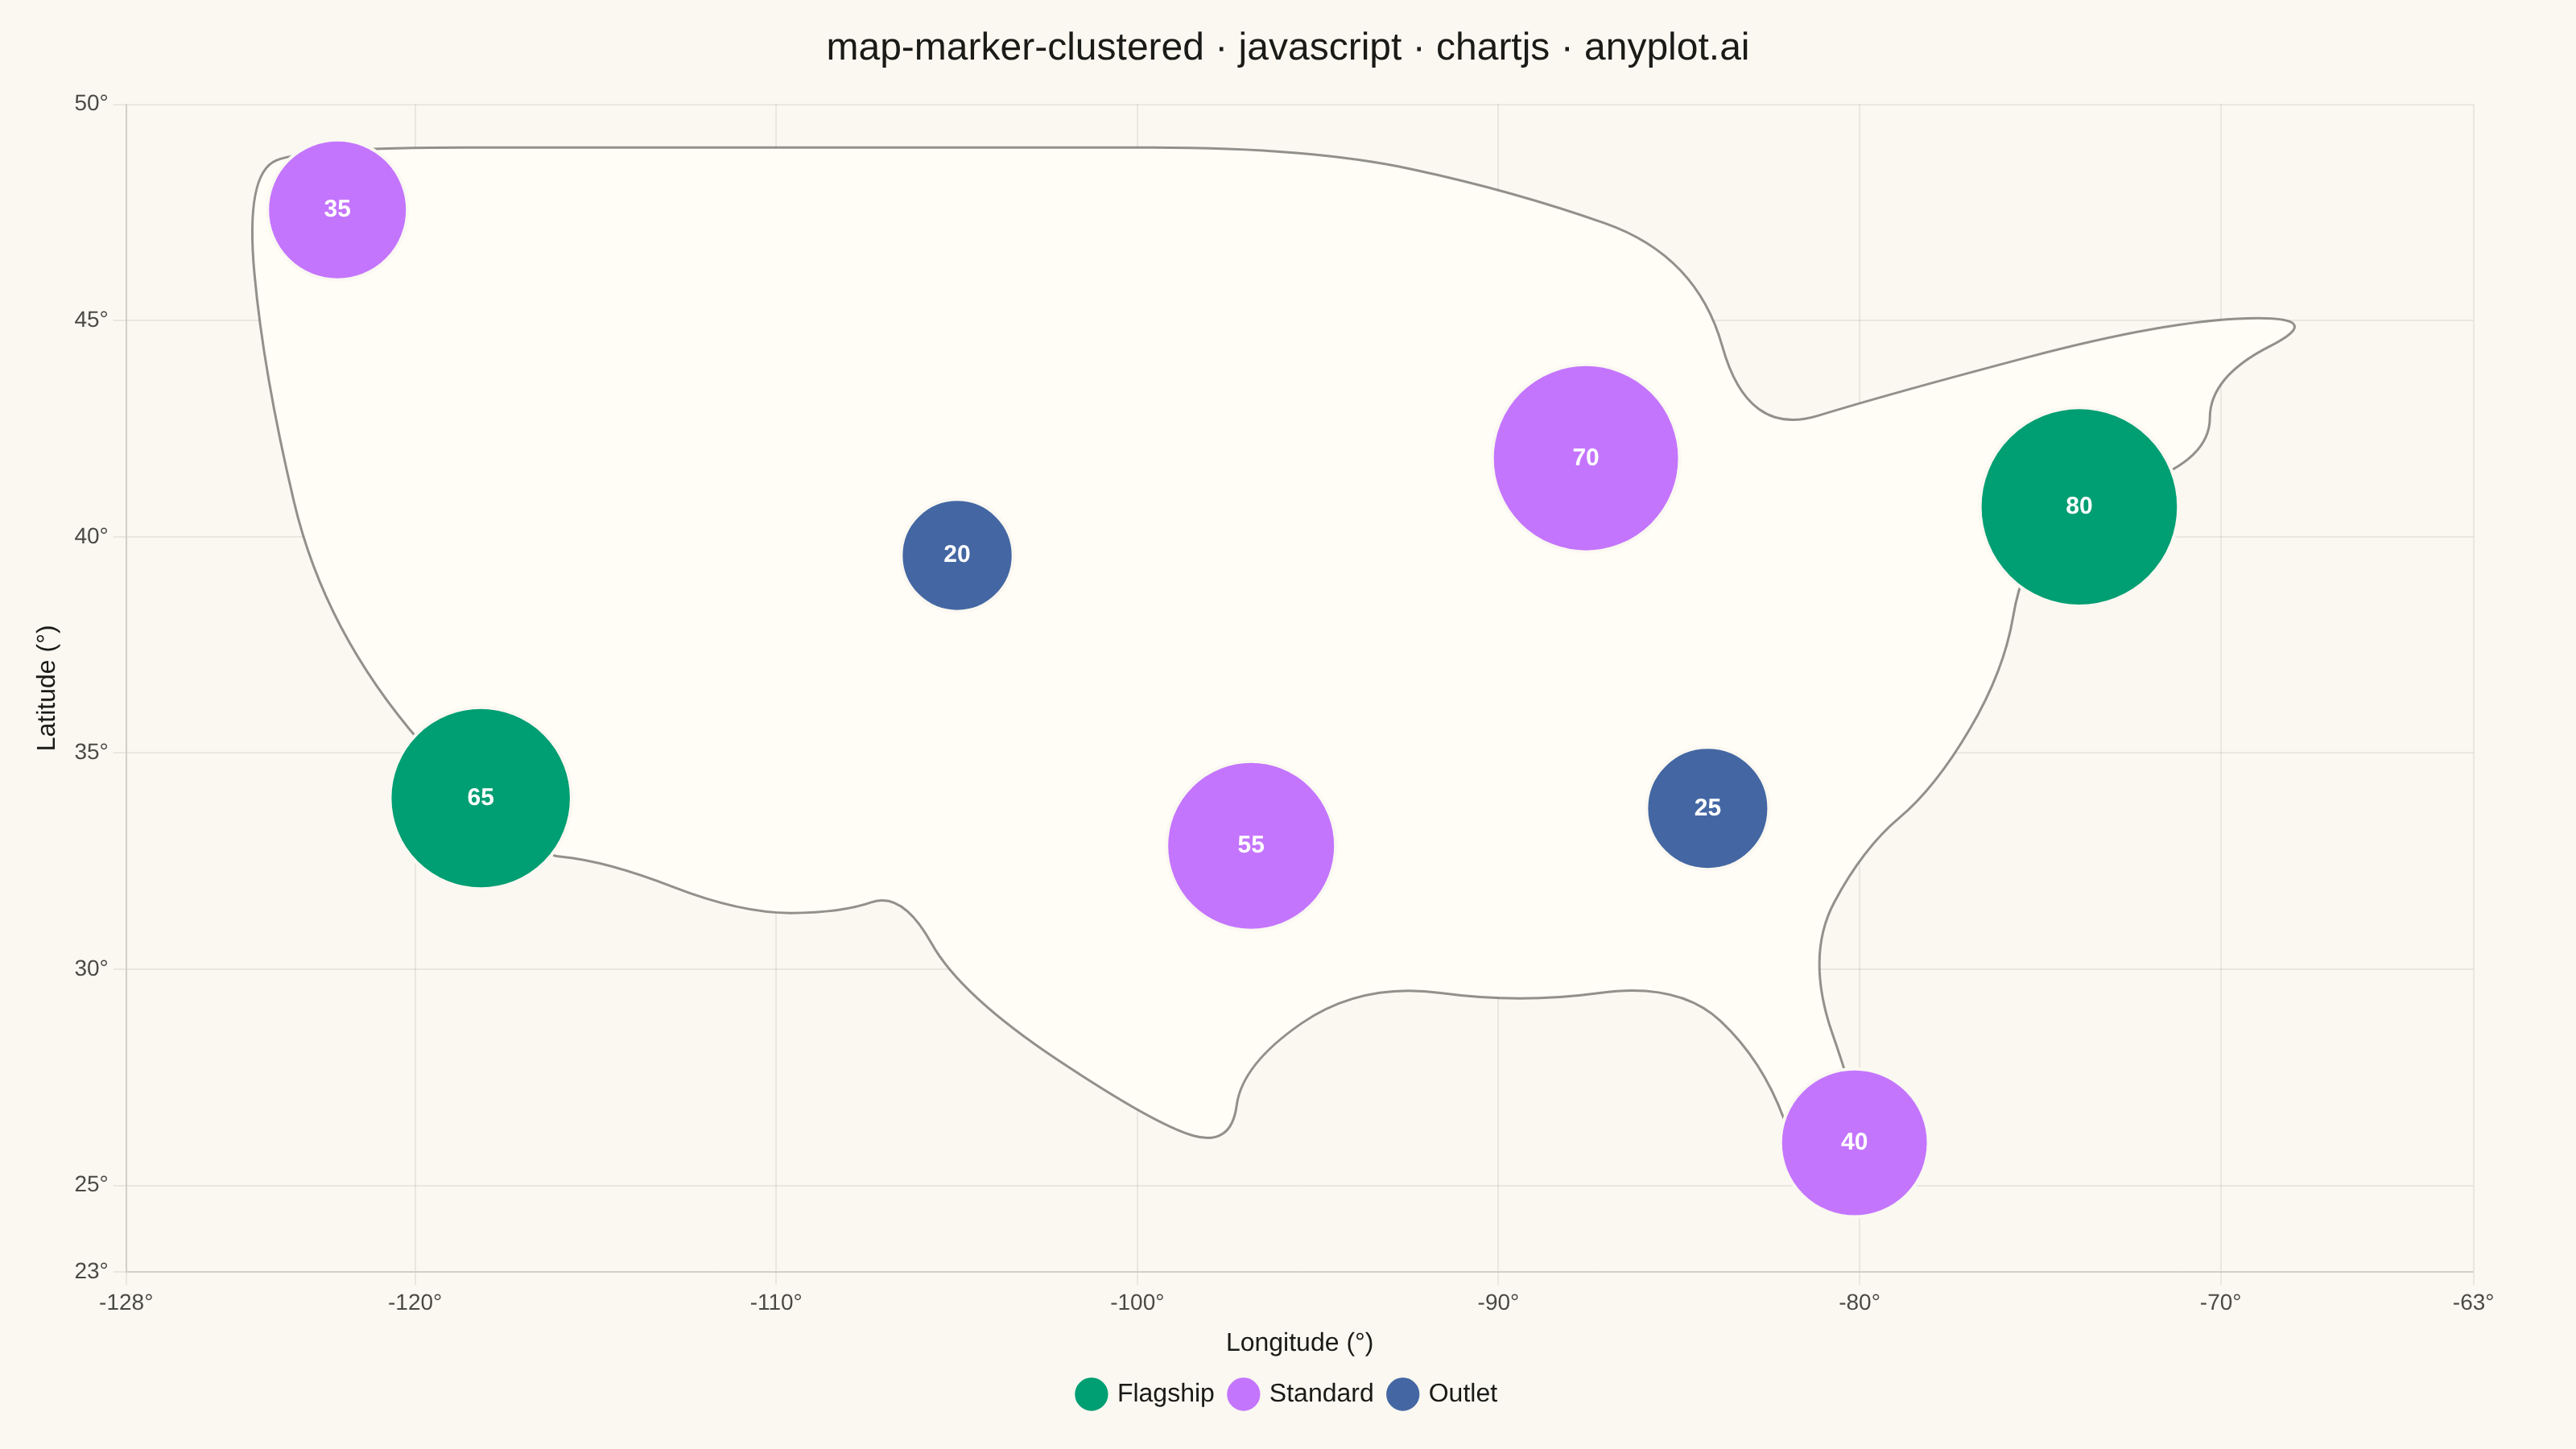
A geographic map that dynamically clusters nearby markers based on the current zoom level. At lower zoom levels, clusters aggregate multiple points into a single marker displaying the count, while zooming in progressively expands clusters to reveal individual markers. This visualization is essential for efficiently displaying large geographic datasets without visual clutter, enabling users to see both the overall distribution and specific locations through interactive exploration.
// anyplot.ai
// map-marker-clustered: Clustered Marker Map
// Library: chartjs 4.4.7 | JavaScript 22.23.2
// Quality: 82/100 | Created: 2026-09-02

const t = window.ANYPLOT_TOKENS;
const CATEGORIES = ["Flagship", "Standard", "Outlet"];

// --- Deterministic PRNG (browser has no seeded Math.random) ----------------
function makeLcg(seed) {
  let state = seed >>> 0;
  return function rand() {
    state = (1103515245 * state + 12345) >>> 0;
    return state / 4294967296;
  };
}
function gaussian(rand) {
  const u1 = Math.max(rand(), 1e-9);
  const u2 = rand();
  return Math.sqrt(-2 * Math.log(u1)) * Math.cos(2 * Math.PI * u2);
}
function pickCategory(rand, weights) {
  const r = rand();
  if (r < weights[0]) return "Flagship";
  if (r < weights[0] + weights[1]) return "Standard";
  return "Outlet";
}

// --- Data: individual store locations around metro hubs --------------------
// Each hub carries its own Flagship/Standard/Outlet mix, so different regions
// have a different dominant store type on the clustered map.
const rand = makeLcg(42);
const HUBS = [
  { lon: -122.3, lat: 47.6, weights: [0.1, 0.75, 0.15], count: 35 }, // Seattle — Standard-heavy
  { lon: -118.2, lat: 34.0, weights: [0.55, 0.35, 0.1], count: 65 }, // Los Angeles — Flagship-heavy
  { lon: -104.9, lat: 39.7, weights: [0.05, 0.35, 0.6], count: 20 }, // Denver — Outlet-heavy
  { lon: -96.8, lat: 32.8, weights: [0.1, 0.7, 0.2], count: 55 }, // Dallas — Standard-heavy
  { lon: -87.6, lat: 41.9, weights: [0.15, 0.65, 0.2], count: 70 }, // Chicago — Standard-heavy
  { lon: -84.4, lat: 33.7, weights: [0.05, 0.35, 0.6], count: 25 }, // Atlanta — Outlet-heavy
  { lon: -74.0, lat: 40.7, weights: [0.6, 0.35, 0.05], count: 80 }, // New York — Flagship-heavy
  { lon: -80.2, lat: 25.8, weights: [0.15, 0.6, 0.25], count: 40 }, // Miami — Standard-heavy
];

const stores = [];
HUBS.forEach((hub) => {
  for (let i = 0; i < hub.count; i += 1) {
    stores.push({
      lon: hub.lon + gaussian(rand) * 0.55,
      lat: hub.lat + gaussian(rand) * 0.45,
      category: pickCategory(rand, hub.weights),
    });
  }
});

// --- Cluster a set of stores by greedy nearest-centroid grouping -----------
// A point joins the closest existing cluster within `radius`, else it seeds a
// new one — the same distance-based grouping marker-cluster libraries use.
// Re-run at a tighter radius (and over a narrower point subset) on click to
// drive zoom-level-dependent re-clustering.
const CLUSTER_RADIUS_DEG = 3.5;
const MIN_CLUSTER_RADIUS_DEG = 0.05;
const radiusFor = (count) => Math.min(70, Math.max(10, 8 + 6 * Math.sqrt(count)));

function buildClusters(points, radius) {
  const rawClusters = [];
  points.forEach((store) => {
    let nearest = null;
    let nearestDist = Infinity;
    rawClusters.forEach((cluster) => {
      const dLon = store.lon - cluster.lonSum / cluster.count;
      const dLat = store.lat - cluster.latSum / cluster.count;
      const dist = Math.sqrt(dLon * dLon + dLat * dLat);
      if (dist < radius && dist < nearestDist) {
        nearestDist = dist;
        nearest = cluster;
      }
    });
    if (!nearest) {
      nearest = { lonSum: 0, latSum: 0, count: 0, byCategory: {}, members: [] };
      rawClusters.push(nearest);
    }
    nearest.lonSum += store.lon;
    nearest.latSum += store.lat;
    nearest.count += 1;
    nearest.byCategory[store.category] = (nearest.byCategory[store.category] || 0) + 1;
    nearest.members.push(store);
  });

  return rawClusters.map((cell) => {
    const dominant = CATEGORIES.reduce(
      (best, cat) => ((cell.byCategory[cat] || 0) > (cell.byCategory[best] || 0) ? cat : best),
      CATEGORIES[0],
    );
    return {
      x: cell.lonSum / cell.count,
      y: cell.latSum / cell.count,
      r: radiusFor(cell.count),
      count: cell.count,
      category: dominant,
      members: cell.members,
    };
  });
}

function datasetsFor(clusterList) {
  return CATEGORIES.map((category, i) => ({
    label: category,
    data: clusterList.filter((c) => c.category === category),
    backgroundColor: t.palette[i],
    borderColor: t.pageBg,
    borderWidth: 2,
  }));
}

// --- Simplified contiguous-US outline for geographic context ---------------
const US_OUTLINE = [
  [-124.7, 48.4], [-124.2, 43.8], [-122.5, 37.8], [-117.2, 32.7],
  [-114.7, 32.5], [-111.0, 31.3], [-108.2, 31.3], [-106.5, 31.8],
  [-104.9, 29.4], [-99.5, 26.4], [-97.4, 25.9], [-97.1, 27.8],
  [-93.8, 29.7], [-89.4, 29.2], [-85.0, 29.7], [-82.7, 27.9],
  [-81.5, 25.2], [-80.1, 25.8], [-80.0, 26.7], [-81.5, 30.3],
  [-79.9, 32.8], [-77.9, 34.2], [-76.0, 36.9], [-75.5, 39.4],
  [-74.0, 40.7], [-70.3, 41.8], [-70.3, 43.7], [-67.0, 45.1],
  [-71.5, 45.0], [-79.2, 43.3], [-83.1, 42.3], [-84.5, 46.5],
  [-89.6, 48.0], [-95.2, 49.0], [-104.0, 49.0], [-114.0, 49.0],
  [-123.0, 49.0],
];

const FULL_BOUNDS = { xMin: -128, xMax: -63, yMin: 23, yMax: 50 };

function boundsForMembers(members) {
  const lons = members.map((m) => m.lon);
  const lats = members.map((m) => m.lat);
  const spreadLon = Math.max(...lons) - Math.min(...lons);
  const spreadLat = Math.max(...lats) - Math.min(...lats);
  const padLon = Math.max(0.6, spreadLon * 0.4);
  const padLat = Math.max(0.6, spreadLat * 0.4);
  return {
    xMin: Math.min(...lons) - padLon,
    xMax: Math.max(...lons) + padLon,
    yMin: Math.min(...lats) - padLat,
    yMax: Math.max(...lats) + padLat,
  };
}

// --- Interaction state (hover spider lines, click-to-expand drill-down) ----
let hoveredCluster = null;
let currentRadius = CLUSTER_RADIUS_DEG;

function applyView(chart, points, radius, bounds) {
  const clusters = buildClusters(points, radius);
  chart.data.datasets.forEach((ds, i) => {
    ds.data = clusters.filter((c) => c.category === CATEGORIES[i]);
  });
  chart.options.scales.x.min = bounds.xMin;
  chart.options.scales.x.max = bounds.xMax;
  chart.options.scales.y.min = bounds.yMin;
  chart.options.scales.y.max = bounds.yMax;
  // Static PNG render happens before any user interaction, so re-enabling
  // animation here (initial chart creation keeps `animation: false`) only
  // affects the interactive HTML — it drives the smooth zoom transition.
  chart.options.animation = { duration: 450, easing: "easeInOutQuad" };
  chart.update();
}

const basemapPlugin = {
  id: "basemapOutline",
  beforeDatasetsDraw(chart) {
    const { ctx, scales } = chart;
    const pts = US_OUTLINE.map(([lon, lat]) => [
      scales.x.getPixelForValue(lon),
      scales.y.getPixelForValue(lat),
    ]);
    ctx.save();
    ctx.beginPath();
    const start = pts[pts.length - 1];
    ctx.moveTo((start[0] + pts[0][0]) / 2, (start[1] + pts[0][1]) / 2);
    // Quadratic-through-midpoints smoothing: rounds every vertex into a curve
    // instead of a hard corner, so the coastline reads as a basemap outline
    // rather than a jagged straight-segment polygon.
    for (let i = 0; i < pts.length; i += 1) {
      const curr = pts[i];
      const next = pts[(i + 1) % pts.length];
      const midX = (curr[0] + next[0]) / 2;
      const midY = (curr[1] + next[1]) / 2;
      ctx.quadraticCurveTo(curr[0], curr[1], midX, midY);
    }
    ctx.closePath();
    ctx.fillStyle = t.elevatedBg;
    ctx.fill();
    ctx.globalAlpha = 0.6;
    ctx.strokeStyle = t.inkSoft;
    ctx.lineWidth = 1.5;
    ctx.stroke();
    ctx.restore();
  },
};

const clusterCountPlugin = {
  id: "clusterCount",
  afterDatasetsDraw(chart) {
    const { ctx, scales } = chart;
    ctx.save();
    ctx.font = "600 15px sans-serif";
    ctx.fillStyle = "#FFFFFF";
    ctx.textAlign = "center";
    ctx.textBaseline = "middle";
    chart.data.datasets.forEach((dataset) => {
      dataset.data.forEach((point) => {
        if (point.count <= 1) return; // a lone expanded marker needs no count badge
        const px = scales.x.getPixelForValue(point.x);
        const py = scales.y.getPixelForValue(point.y);
        ctx.fillText(String(point.count), px, py);
      });
    });
    ctx.restore();
  },
};

const spiderLinesPlugin = {
  id: "spiderLines",
  afterDatasetsDraw(chart) {
    if (!hoveredCluster || hoveredCluster.count <= 1) return;
    const { ctx, scales } = chart;
    const cx = scales.x.getPixelForValue(hoveredCluster.x);
    const cy = scales.y.getPixelForValue(hoveredCluster.y);
    ctx.save();
    ctx.strokeStyle = t.inkSoft;
    ctx.globalAlpha = 0.5;
    ctx.lineWidth = 1;
    hoveredCluster.members.forEach((member) => {
      const mx = scales.x.getPixelForValue(member.lon);
      const my = scales.y.getPixelForValue(member.lat);
      ctx.beginPath();
      ctx.moveTo(cx, cy);
      ctx.lineTo(mx, my);
      ctx.stroke();
    });
    ctx.restore();
  },
};

// --- Mount -------------------------------------------------------------
const canvas = document.createElement("canvas");
document.getElementById("container").appendChild(canvas);

// --- Chart ---------------------------------------------------------------
new Chart(canvas, {
  type: "bubble",
  data: { datasets: datasetsFor(buildClusters(stores, CLUSTER_RADIUS_DEG)) },
  plugins: [basemapPlugin, clusterCountPlugin, spiderLinesPlugin],
  options: {
    responsive: true,
    maintainAspectRatio: false,
    animation: false,
    layout: { padding: 16 },
    interaction: { mode: "nearest", intersect: true },
    onClick(event, elements, chart) {
      if (!elements.length) {
        if (currentRadius !== CLUSTER_RADIUS_DEG) {
          currentRadius = CLUSTER_RADIUS_DEG;
          hoveredCluster = null;
          applyView(chart, stores, currentRadius, FULL_BOUNDS);
        }
        return;
      }
      const el = elements[0];
      const cluster = chart.data.datasets[el.datasetIndex].data[el.index];
      if (cluster.count <= 1 || currentRadius <= MIN_CLUSTER_RADIUS_DEG) return;
      currentRadius = Math.max(MIN_CLUSTER_RADIUS_DEG, currentRadius / 3);
      hoveredCluster = null;
      applyView(chart, cluster.members, currentRadius, boundsForMembers(cluster.members));
    },
    onHover(event, elements, chart) {
      const el = elements[0];
      const cluster = el ? chart.data.datasets[el.datasetIndex].data[el.index] : null;
      const next = cluster && cluster.count > 1 ? cluster : null;
      chart.canvas.style.cursor = cluster && cluster.count > 1 ? "pointer" : "default";
      if (next !== hoveredCluster) {
        hoveredCluster = next;
        chart.draw();
      }
    },
    plugins: {
      title: {
        display: true,
        text: "map-marker-clustered · javascript · chartjs · anyplot.ai",
        color: t.ink,
        font: { size: 24, weight: "500" },
        padding: { bottom: 20 },
      },
      legend: {
        position: "bottom",
        labels: { color: t.ink, font: { size: 16 }, usePointStyle: true, pointStyle: "circle" },
      },
      tooltip: {
        callbacks: {
          label: (ctx) => {
            const point = ctx.raw;
            const noun = point.count === 1 ? "store" : "stores";
            const hint = point.count > 1 ? " — click to expand" : "";
            return `${ctx.dataset.label}: ${point.count} ${noun}${hint}`;
          },
        },
      },
    },
    scales: {
      x: {
        type: "linear",
        min: FULL_BOUNDS.xMin,
        max: FULL_BOUNDS.xMax,
        title: { display: true, text: "Longitude (°)", color: t.ink, font: { size: 16 } },
        ticks: { color: t.inkSoft, font: { size: 14 }, callback: (v) => `${v}°` },
        grid: { color: t.grid, lineWidth: 0.5 },
      },
      y: {
        type: "linear",
        min: FULL_BOUNDS.yMin,
        max: FULL_BOUNDS.yMax,
        title: { display: true, text: "Latitude (°)", color: t.ink, font: { size: 16 } },
        ticks: { color: t.inkSoft, font: { size: 14 }, callback: (v) => `${v}°` },
        grid: { color: t.grid, lineWidth: 0.5 },
      },
    },
  },
});
Runnable source as JSON, for any HTTP client: https://api.anyplot.ai/specs/map-marker-clustered/chartjs/code. Any spec id and library id listed in llms-full.txt fit the same URL shape; every URL below is complete and callable.
{
  "spec_id": "map-marker-clustered",
  "language": "javascript",
  "library": "chartjs",
  "page": "https://anyplot.ai/map-marker-clustered/javascript/chartjs",
  "hub": "https://anyplot.ai/map-marker-clustered",
  "code_json": "https://api.anyplot.ai/specs/map-marker-clustered/chartjs/code",
  "spec_json": "https://api.anyplot.ai/specs/map-marker-clustered",
  "render_light_png": "https://storage.googleapis.com/anyplot-images/plots/map-marker-clustered/javascript/chartjs/plot-light.png",
  "render_dark_png": "https://storage.googleapis.com/anyplot-images/plots/map-marker-clustered/javascript/chartjs/plot-dark.png",
  "interactive_light_html": "https://storage.googleapis.com/anyplot-images/plots/map-marker-clustered/javascript/chartjs/plot-light.html",
  "interactive_dark_html": "https://storage.googleapis.com/anyplot-images/plots/map-marker-clustered/javascript/chartjs/plot-dark.html",
  "quality_score": 82.0,
  "license": "MIT",
  "guide": "https://anyplot.ai/llms.txt"
}
Part of Clustered Marker Map on anyplot.ai.