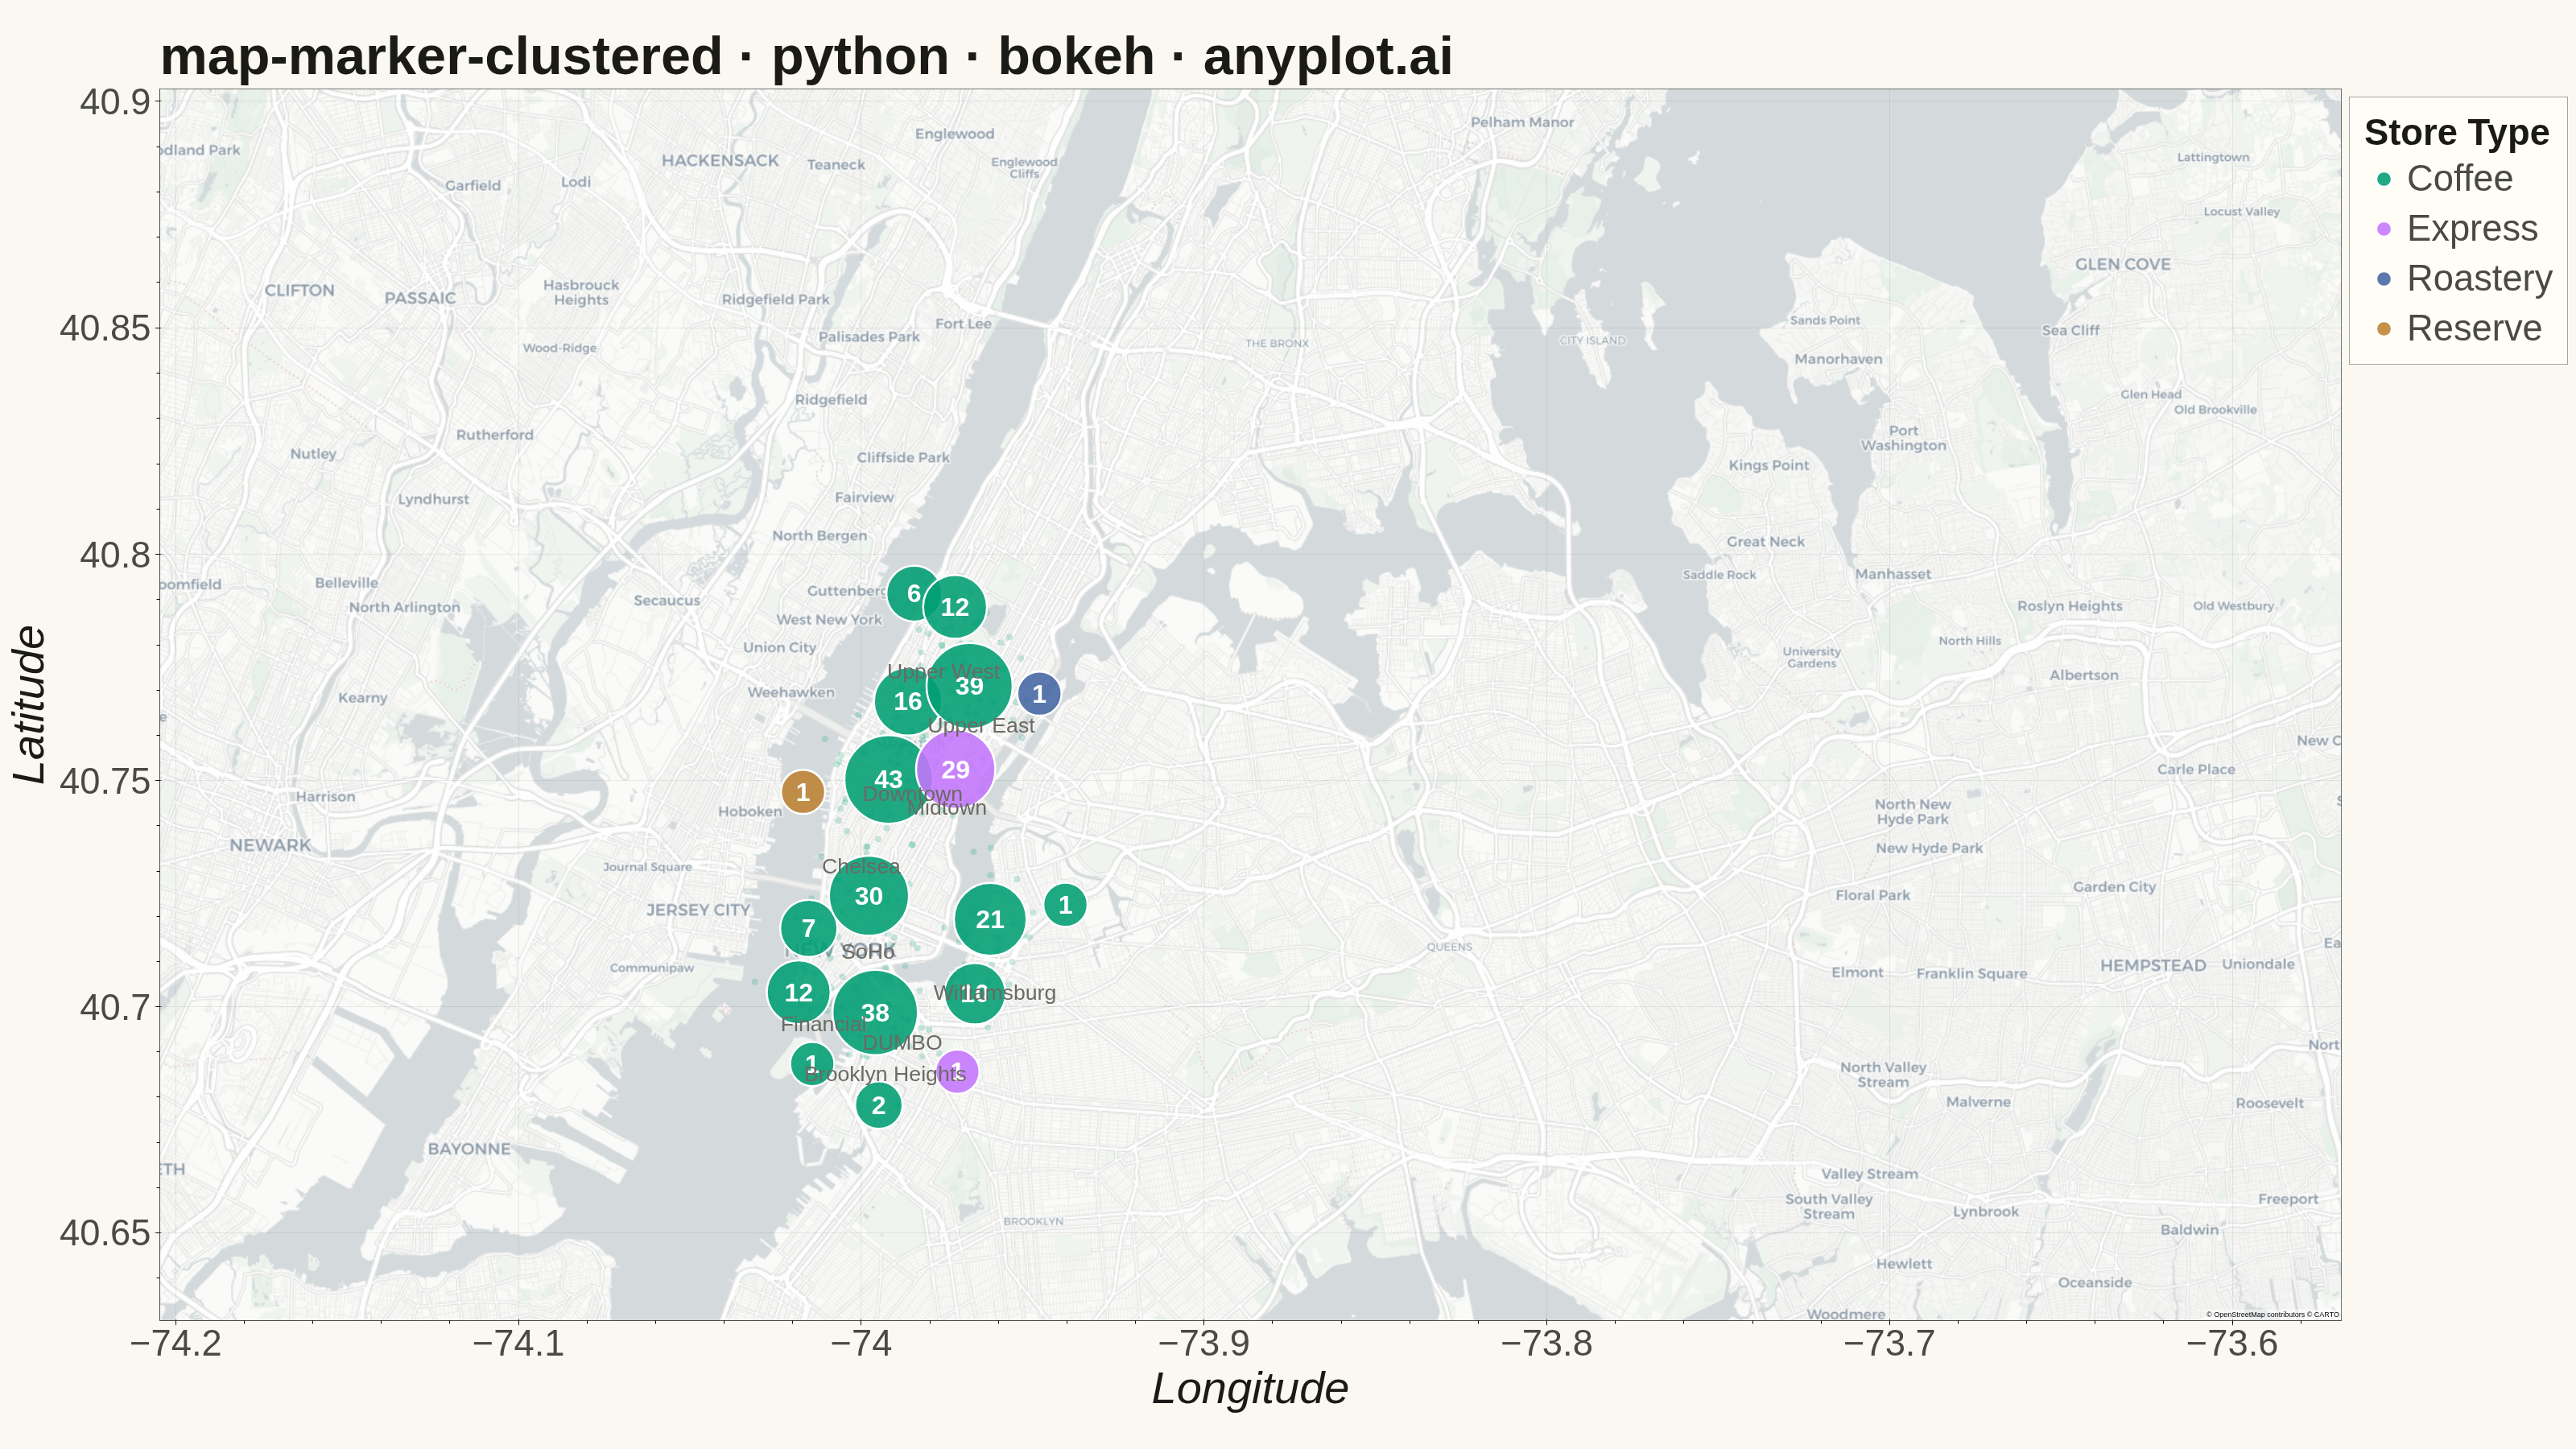
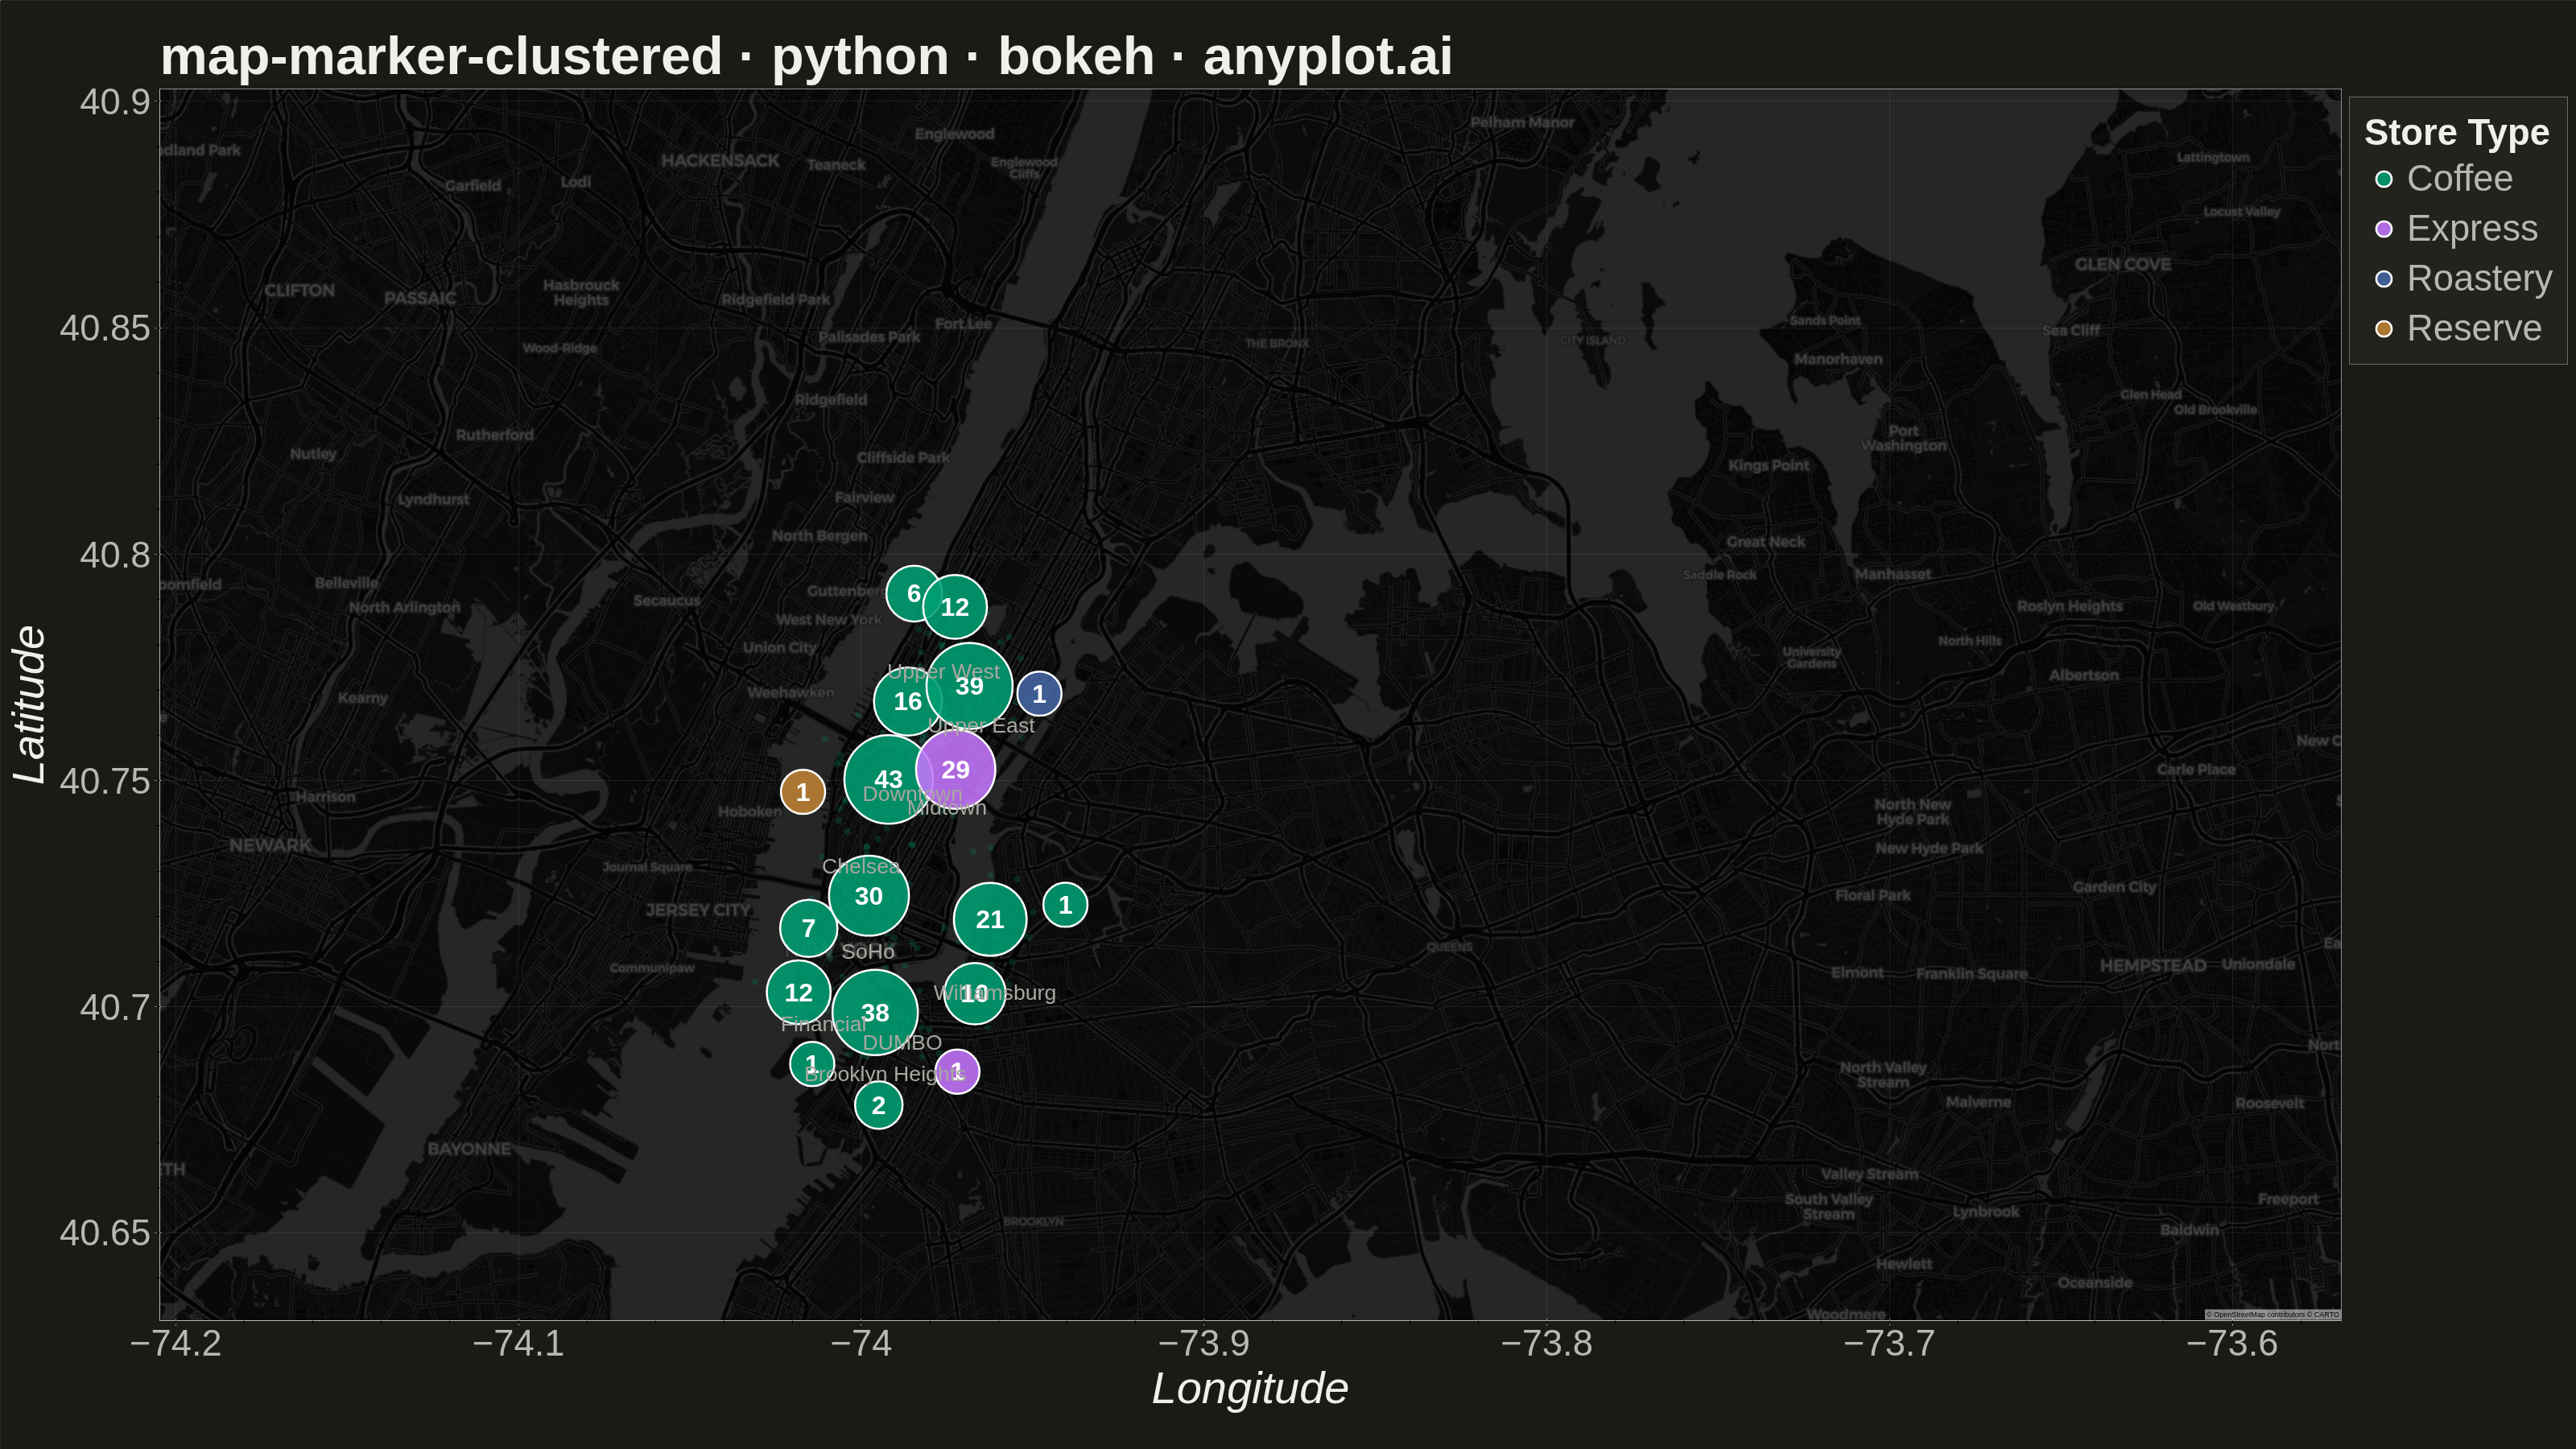
A geographic map that dynamically clusters nearby markers based on the current zoom level. At lower zoom levels, clusters aggregate multiple points into a single marker displaying the count, while zooming in progressively expands clusters to reveal individual markers. This visualization is essential for efficiently displaying large geographic datasets without visual clutter, enabling users to see both the overall distribution and specific locations through interactive exploration.
""" anyplot.ai
map-marker-clustered: Clustered Marker Map
Library: bokeh 3.9.0 | Python 3.13.13
Quality: 86/100 | Updated: 2026-05-23
"""

import os
import sys


# Remove the script's own directory from sys.path so "import bokeh" finds the
# installed package instead of this file (also named bokeh.py).
_this_dir = os.path.dirname(os.path.abspath(__file__))
sys.path = [p for p in sys.path if os.path.abspath(p) != _this_dir]

import time
from pathlib import Path

import numpy as np
from bokeh.io import output_file, save
from bokeh.models import ColumnDataSource, LabelSet, Legend, LegendItem, WMTSTileSource
from bokeh.plotting import figure
from selenium import webdriver
from selenium.webdriver.chrome.options import Options


THEME = os.getenv("ANYPLOT_THEME", "light")

PAGE_BG = "#FAF8F1" if THEME == "light" else "#1A1A17"
ELEVATED_BG = "#FFFDF6" if THEME == "light" else "#242420"
INK = "#1A1A17" if THEME == "light" else "#F0EFE8"
INK_SOFT = "#4A4A44" if THEME == "light" else "#B8B7B0"
INK_MUTED = "#6B6A63" if THEME == "light" else "#A8A79F"

# Map background — placeholder color visible before tiles load
MAP_BG = "#E8EEF2" if THEME == "light" else "#1C2E35"

# Tile basemap — CartoDB Positron (light) or Dark Matter (dark)
TILE_URL = (
    "https://a.basemaps.cartocdn.com/light_all/{Z}/{X}/{Y}.png"
    if THEME == "light"
    else "https://a.basemaps.cartocdn.com/dark_all/{Z}/{X}/{Y}.png"
)

# Imprint palette — canonical imprint slot order (green, lavender, blue, ochre)
IMPRINT = ["#009E73", "#C475FD", "#4467A3", "#BD8233"]

# Data — coffee shop chain locations across NYC neighborhoods
np.random.seed(42)

neighborhoods = [
    {"name": "Downtown", "lat": 40.758, "lon": -73.985, "stores": 45},
    {"name": "Midtown", "lat": 40.755, "lon": -73.975, "stores": 35},
    {"name": "Upper East", "lat": 40.773, "lon": -73.965, "stores": 28},
    {"name": "Upper West", "lat": 40.785, "lon": -73.976, "stores": 22},
    {"name": "Chelsea", "lat": 40.742, "lon": -74.000, "stores": 18},
    {"name": "SoHo", "lat": 40.723, "lon": -73.998, "stores": 25},
    {"name": "Financial", "lat": 40.707, "lon": -74.011, "stores": 32},
    {"name": "Brooklyn Heights", "lat": 40.696, "lon": -73.993, "stores": 20},
    {"name": "Williamsburg", "lat": 40.714, "lon": -73.961, "stores": 30},
    {"name": "DUMBO", "lat": 40.703, "lon": -73.988, "stores": 15},
]

categories = ["Coffee", "Express", "Roastery", "Reserve"]
category_weights = [0.5, 0.3, 0.15, 0.05]
category_colors = dict(zip(categories, IMPRINT, strict=False))

all_lats, all_lons, all_categories = [], [], []

for hood in neighborhoods:
    n = hood["stores"]
    all_lats.extend(hood["lat"] + np.random.normal(0, 0.008, n))
    all_lons.extend(hood["lon"] + np.random.normal(0, 0.008, n))
    all_categories.extend(np.random.choice(categories, n, p=category_weights))

lats = np.array(all_lats)
lons = np.array(all_lons)
store_categories = np.array(all_categories)

# Convert lat/lon → Web Mercator (inline)
k = 6378137
mercator_x = lons * (k * np.pi / 180.0)
mercator_y = np.log(np.tan((90 + lats) * np.pi / 360.0)) * k

# Grid-based clustering — 3500m cells reduce overlap in dense areas
grid_size = 3500  # metres
grid_xi = np.floor(mercator_x / grid_size).astype(int)
grid_yi = np.floor(mercator_y / grid_size).astype(int)
cluster_ids = grid_xi * 10000 + grid_yi
unique_clusters = np.unique(cluster_ids)

cluster_cx, cluster_cy, cluster_counts, cluster_dominant = [], [], [], []
for cid in unique_clusters:
    mask = cluster_ids == cid
    cluster_cx.append(mercator_x[mask].mean())
    cluster_cy.append(mercator_y[mask].mean())
    cluster_counts.append(mask.sum())
    cats = store_categories[mask]
    unique_c, counts_c = np.unique(cats, return_counts=True)
    cluster_dominant.append(unique_c[counts_c.argmax()])

cluster_cx = np.array(cluster_cx)
cluster_cy = np.array(cluster_cy)
cluster_counts = np.array(cluster_counts)

# Scale marker size by cluster count
min_sz, max_sz = 45, 110
norm = (cluster_counts - cluster_counts.min() + 1) / (cluster_counts.max() - cluster_counts.min() + 1)
cluster_sizes = min_sz + np.sqrt(norm) * (max_sz - min_sz)

# Build figure — landscape 3200×1800, no toolbar for PNG accuracy
p = figure(
    width=3200,
    height=1800,
    x_range=(-8242000, -8208000),
    y_range=(4958000, 4998000),
    x_axis_type="mercator",
    y_axis_type="mercator",
    title="map-marker-clustered · python · bokeh · anyplot.ai",
    toolbar_location=None,
    tooltips=[("Stores", "@count"), ("Dominant Type", "@category")],
    min_border_bottom=160,
    min_border_left=180,
    min_border_top=110,
    min_border_right=50,
)

# Tile basemap — adds streets/boundaries geographic context
p.add_tile(WMTSTileSource(url=TILE_URL, attribution="© OpenStreetMap contributors © CARTO"))

# Faint individual store markers
individual_source = ColumnDataSource(data={"x": mercator_x, "y": mercator_y, "category": store_categories})
p.scatter(
    x="x", y="y", source=individual_source, size=8, fill_color=IMPRINT[0], fill_alpha=0.20, line_color=None
)

# Per-category cluster renderers for legend (all 4 categories always present)
legend_items = []
for cat, color in category_colors.items():
    cat_mask = np.array([d == cat for d in cluster_dominant])
    if cat_mask.any():
        src = ColumnDataSource(
            data={
                "x": cluster_cx[cat_mask],
                "y": cluster_cy[cat_mask],
                "size": cluster_sizes[cat_mask],
                "count": cluster_counts[cat_mask],
                "count_label": [str(c) for c in cluster_counts[cat_mask]],
                "category": [cat] * int(cat_mask.sum()),
            }
        )
        renderer = p.scatter(
            x="x", y="y", source=src, size="size", fill_color=color, fill_alpha=0.88, line_color="white", line_width=2.5
        )
    else:
        # Off-screen phantom point so the legend glyph renders with the right color
        src = ColumnDataSource(
            data={"x": [-9.9e8], "y": [-9.9e8], "size": [80.0], "count": [0], "count_label": [""], "category": [cat]}
        )
        renderer = p.scatter(
            x="x", y="y", source=src, size="size", fill_color=color, fill_alpha=0.88, line_color="white", line_width=2.5
        )
    legend_items.append(LegendItem(label=cat, renderers=[renderer]))

# Cluster count labels
cluster_source = ColumnDataSource(
    data={
        "x": cluster_cx,
        "y": cluster_cy,
        "count": cluster_counts,
        "size": cluster_sizes,
        "count_label": [str(c) for c in cluster_counts],
        "category": cluster_dominant,
    }
)
p.add_layout(
    LabelSet(
        x="x",
        y="y",
        text="count_label",
        source=cluster_source,
        text_font_size="24pt",
        text_font_style="bold",
        text_color="white",
        text_align="center",
        text_baseline="middle",
    )
)

# Neighborhood name labels
hood_labels_source = ColumnDataSource(
    data={
        "x": [hood["lon"] * (k * np.pi / 180.0) for hood in neighborhoods],
        "y": [np.log(np.tan((90 + hood["lat"]) * np.pi / 360.0)) * k - 1200 for hood in neighborhoods],
        "name": [hood["name"] for hood in neighborhoods],
    }
)
p.add_layout(
    LabelSet(
        x="x",
        y="y",
        text="name",
        source=hood_labels_source,
        text_font_size="20pt",
        text_color=INK_MUTED,
        text_align="center",
        text_baseline="top",
    )
)

# Legend
legend = Legend(
    items=legend_items,
    location="top_left",
    title="Store Type",
    title_text_font_size="34pt",
    title_text_font_style="bold",
    title_text_color=INK,
    label_text_font_size="34pt",
    label_text_color=INK_SOFT,
    glyph_height=48,
    glyph_width=48,
    spacing=10,
    padding=18,
    background_fill_color=ELEVATED_BG,
    background_fill_alpha=0.92,
    border_line_color=INK_SOFT,
    border_line_width=1,
)
p.add_layout(legend, "right")

# Typography
p.title.text_font_size = "50pt"
p.title.text_color = INK

p.xaxis.axis_label = "Longitude"
p.yaxis.axis_label = "Latitude"
p.xaxis.axis_label_text_font_size = "42pt"
p.yaxis.axis_label_text_font_size = "42pt"
p.xaxis.axis_label_text_color = INK
p.yaxis.axis_label_text_color = INK
p.xaxis.major_label_text_font_size = "34pt"
p.yaxis.major_label_text_font_size = "34pt"
p.xaxis.major_label_text_color = INK_SOFT
p.yaxis.major_label_text_color = INK_SOFT

p.xaxis.axis_line_color = INK_SOFT
p.yaxis.axis_line_color = INK_SOFT
p.xaxis.major_tick_line_color = INK_SOFT
p.yaxis.major_tick_line_color = INK_SOFT

p.xgrid.grid_line_color = INK
p.ygrid.grid_line_color = INK
p.xgrid.grid_line_alpha = 0.08
p.ygrid.grid_line_alpha = 0.08

# Theme-adaptive background (tile placeholder + border area)
p.background_fill_color = MAP_BG
p.border_fill_color = PAGE_BG
p.outline_line_color = INK_SOFT
p.outline_line_width = 1

# Save HTML (interactive artifact)
html_path = f"plot-{THEME}.html"
output_file(html_path, title="map-marker-clustered · python · bokeh · anyplot.ai")
save(p)

# Screenshot via headless Chrome (Selenium 4 / Selenium Manager)
# Bokeh 3.9.0 adds a Notifications bar (~139 px) above the figure in the HTML
# page even when toolbar_location=None. Use element screenshot to capture just
# the figure div at its declared 3200×1800 size.
W, H = 3200, 1800
opts = Options()
for arg in (
    "--headless=new",
    "--no-sandbox",
    "--disable-dev-shm-usage",
    "--disable-gpu",
    f"--window-size={W},{H + 200}",  # extra vertical space so figure isn't clipped
    "--hide-scrollbars",
    "--force-device-scale-factor=1",
):
    opts.add_argument(arg)

from selenium.webdriver.common.by import By


driver = webdriver.Chrome(options=opts)
driver.set_window_size(W, H + 200)
driver.get(f"file://{Path(html_path).resolve()}")
time.sleep(5)  # extended wait for tile layer to load

# Try to screenshot just the Bokeh figure element to avoid the notifications bar
try:
    fig_elem = driver.find_element(By.CSS_SELECTOR, ".bk-Figure")
    fig_elem.screenshot(f"plot-{THEME}.png")
except Exception:
    driver.save_screenshot(f"plot-{THEME}.png")

driver.quit()
Runnable source as JSON, for any HTTP client: https://api.anyplot.ai/specs/map-marker-clustered/bokeh/code. Any spec id and library id listed in llms-full.txt fit the same URL shape; every URL below is complete and callable.
{
  "spec_id": "map-marker-clustered",
  "language": "python",
  "library": "bokeh",
  "page": "https://anyplot.ai/map-marker-clustered/python/bokeh",
  "hub": "https://anyplot.ai/map-marker-clustered",
  "code_json": "https://api.anyplot.ai/specs/map-marker-clustered/bokeh/code",
  "spec_json": "https://api.anyplot.ai/specs/map-marker-clustered",
  "render_light_png": "https://storage.googleapis.com/anyplot-images/plots/map-marker-clustered/python/bokeh/plot-light.png",
  "render_dark_png": "https://storage.googleapis.com/anyplot-images/plots/map-marker-clustered/python/bokeh/plot-dark.png",
  "interactive_light_html": "https://storage.googleapis.com/anyplot-images/plots/map-marker-clustered/python/bokeh/plot-light.html",
  "interactive_dark_html": "https://storage.googleapis.com/anyplot-images/plots/map-marker-clustered/python/bokeh/plot-dark.html",
  "quality_score": 86.0,
  "license": "MIT",
  "guide": "https://anyplot.ai/llms.txt"
}
Part of Clustered Marker Map on anyplot.ai.