The same plot in 14 other libraries — JavaScript: Chart.js, D3.js, Highcharts, MUI X Charts; Python: Altair, Bokeh, lets-plot, Matplotlib, Plotly, plotnine, Pygal, Seaborn; R: ggplot2; Julia: Makie.jl. Compare all 15 side by side: Clustered Marker Map in Python, R, Julia and JavaScript.
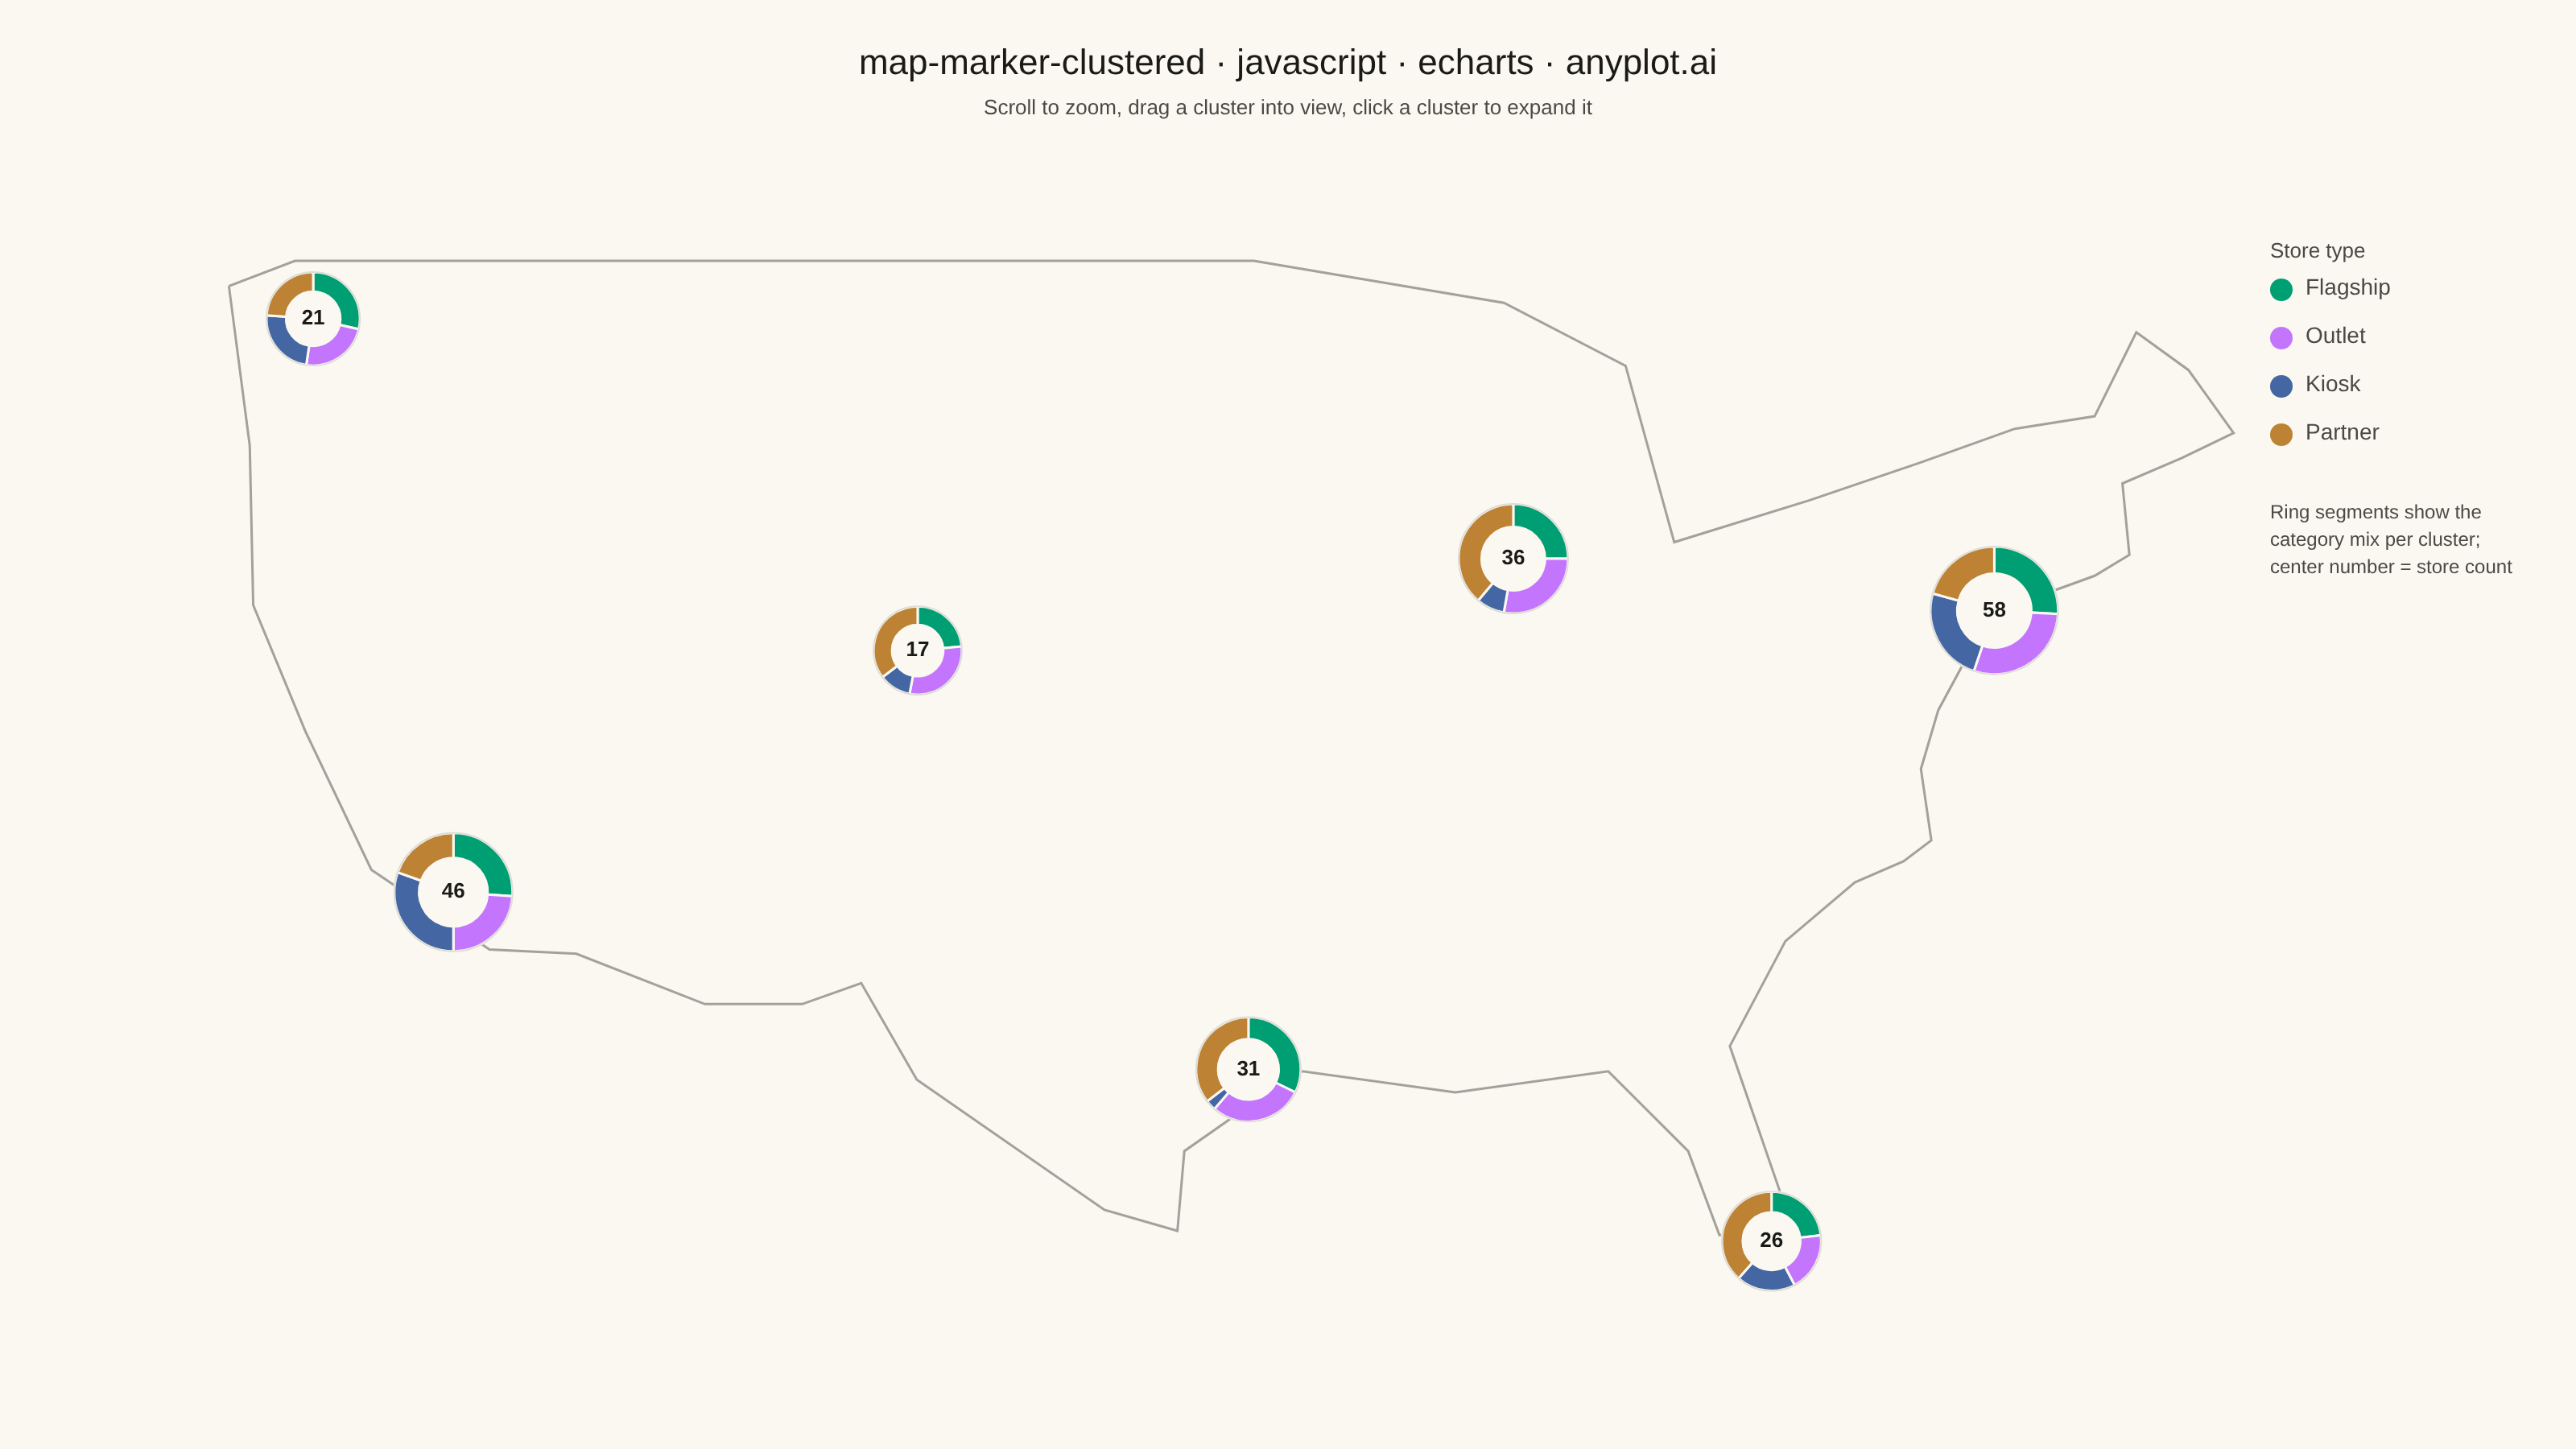
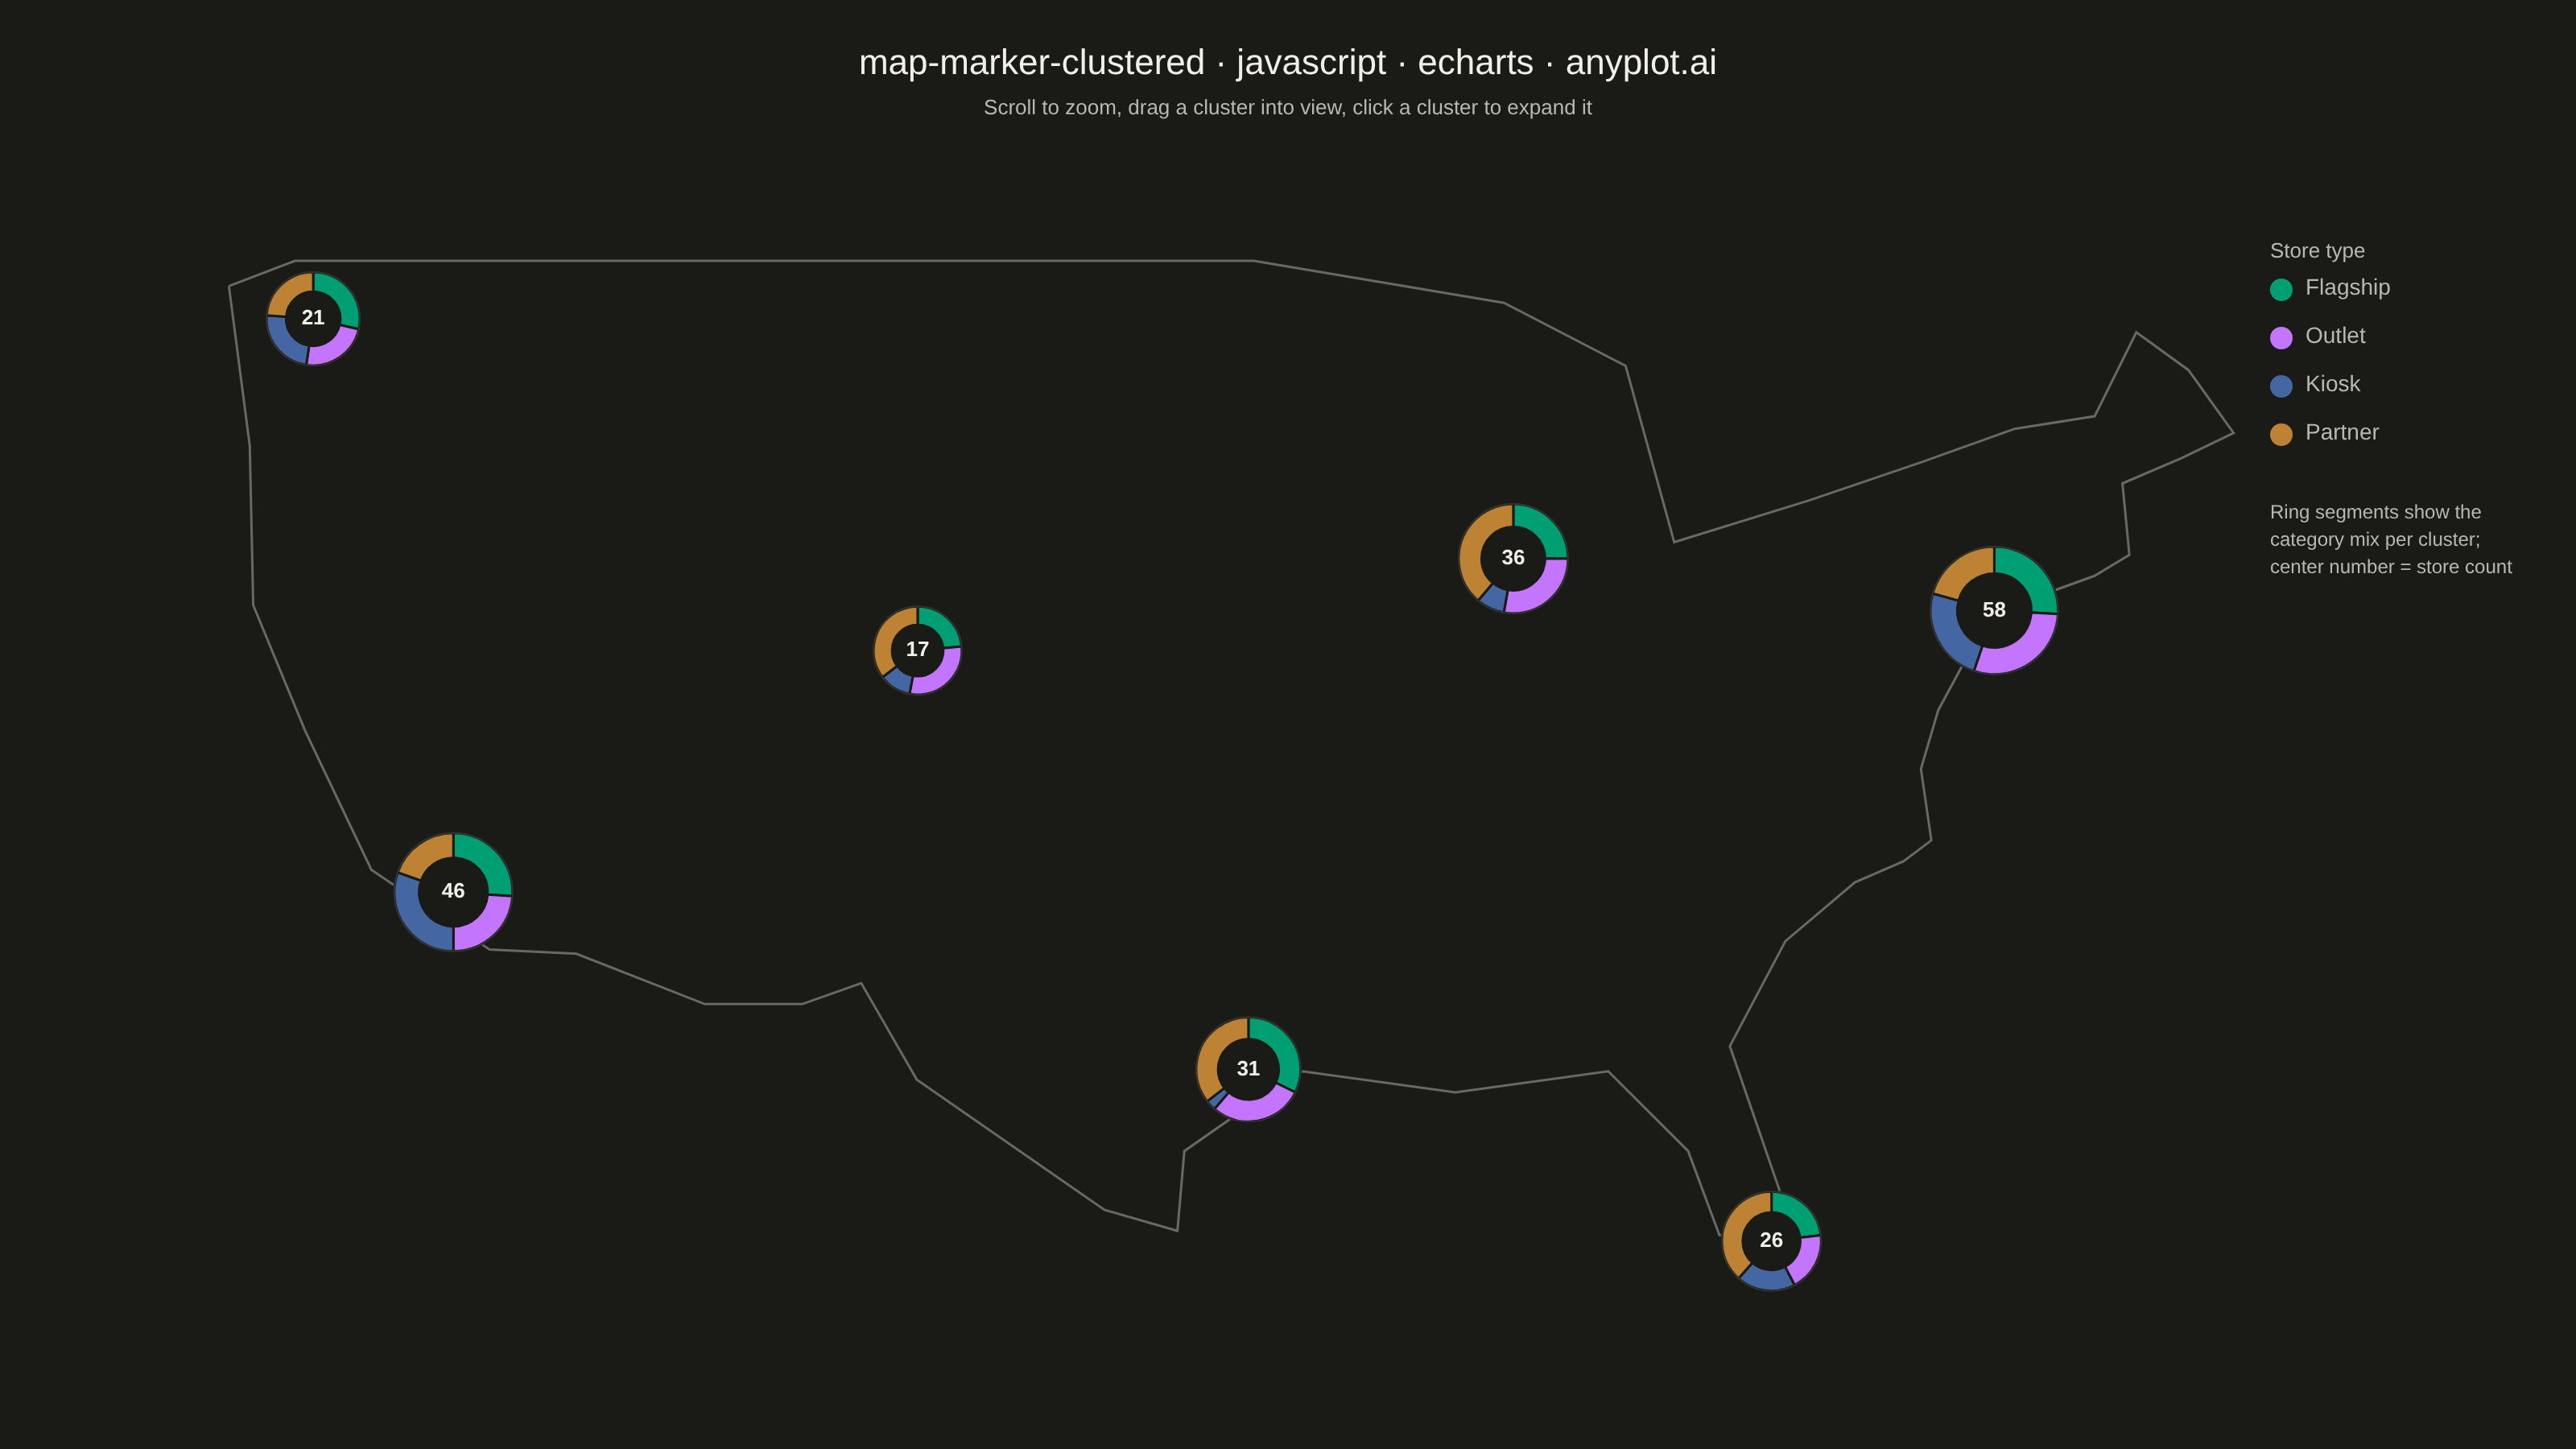
A geographic map that dynamically clusters nearby markers based on the current zoom level. At lower zoom levels, clusters aggregate multiple points into a single marker displaying the count, while zooming in progressively expands clusters to reveal individual markers. This visualization is essential for efficiently displaying large geographic datasets without visual clutter, enabling users to see both the overall distribution and specific locations through interactive exploration.
// anyplot.ai
// map-marker-clustered: Clustered Marker Map
// Library: echarts 6.1.0 | JavaScript 22.23.2
// Quality: 94/100 | Created: 2026-09-02
//# anyplot-orientation: landscape

const t = window.ANYPLOT_TOKENS;
const size = window.ANYPLOT_SIZE;

// --- Data: retail store locations around U.S. metro areas -------------------
// Small fixed-seed LCG (no seeded Math.random in the browser).
let seed = 42;
function rand() {
  seed = (seed * 1103515245 + 12345) & 0x7fffffff;
  return seed / 0x7fffffff;
}

const CATEGORIES = [
  { name: "Flagship", color: t.palette[0] },
  { name: "Outlet", color: t.palette[1] },
  { name: "Kiosk", color: t.palette[2] },
  { name: "Partner", color: t.palette[3] },
];

const METROS = [
  { name: "New York", lon: -74.0, lat: 40.71, n: 58, spread: 1.3 },
  { name: "Los Angeles", lon: -118.24, lat: 34.05, n: 46, spread: 1.15 },
  { name: "Chicago", lon: -87.63, lat: 41.88, n: 36, spread: 1.0 },
  { name: "Houston", lon: -95.37, lat: 29.76, n: 31, spread: 1.05 },
  { name: "Miami", lon: -80.19, lat: 25.76, n: 26, spread: 0.85 },
  { name: "Seattle", lon: -122.33, lat: 47.61, n: 21, spread: 0.75 },
  { name: "Denver", lon: -104.99, lat: 39.74, n: 17, spread: 0.8 },
];

const stores = [];
for (const metro of METROS) {
  for (let i = 0; i < metro.n; i++) {
    const angle = rand() * Math.PI * 2;
    const r = Math.pow(rand(), 0.5) * metro.spread;
    stores.push({
      lon: metro.lon + Math.cos(angle) * r,
      lat: metro.lat + Math.sin(angle) * r * 0.65,
      category: CATEGORIES[Math.floor(rand() * CATEGORIES.length)],
    });
  }
}

// Equirectangular projection, latitude-corrected — the simplest stand-in for
// the Web Mercator projection real slippy-map tiles use.
const meanLatRad = (stores.reduce((s, p) => s + p.lat, 0) / stores.length) * (Math.PI / 180);
const lonScale = Math.cos(meanLatRad);
const project = (lon, lat) => [lon * lonScale, lat];
for (const p of stores) [p.x, p.y] = project(p.lon, p.lat);

const xs = stores.map((p) => p.x);
const ys = stores.map((p) => p.y);
const padX = (Math.max(...xs) - Math.min(...xs)) * 0.1;
const padY = (Math.max(...ys) - Math.min(...ys)) * 0.1;
const FULL_X_MIN = Math.min(...xs) - padX;
const FULL_X_MAX = Math.max(...xs) + padX;
const FULL_Y_MIN = Math.min(...ys) - padY;
const FULL_Y_MAX = Math.max(...ys) + padY;

// Simplified continental-U.S. coastline/border outline — hardcoded, low-fidelity
// but geographically real, gives the marker map its basemap context offline
// (the render harness is sandboxed with no fetch/CDN, so no live tile provider).
const US_OUTLINE_LONLAT = [
  [-124.7, 48.4], [-124.1, 44.6], [-124.0, 40.8], [-122.5, 37.8], [-120.6, 34.5],
  [-117.2, 32.6], [-114.7, 32.5], [-111.0, 31.3], [-108.2, 31.3], [-106.5, 31.8],
  [-104.9, 29.5], [-99.5, 26.4], [-97.4, 25.9], [-97.2, 27.8], [-95.3, 28.9],
  [-93.8, 29.7], [-89.4, 29.2], [-85.0, 29.7], [-82.7, 27.8], [-81.8, 25.8],
  [-80.2, 25.8], [-80.0, 26.7], [-81.5, 30.3], [-79.9, 32.8], [-77.9, 34.2],
  [-76.5, 34.7], [-75.7, 35.2], [-76.0, 36.9], [-75.5, 38.3], [-74.0, 40.6],
  [-71.0, 41.5], [-70.0, 42.0], [-70.2, 43.7], [-68.5, 44.3], [-67.0, 44.9],
  [-68.3, 46.4], [-69.8, 47.3], [-71.0, 45.3], [-73.3, 45.0], [-76.0, 44.2],
  [-79.2, 43.3], [-83.1, 42.3], [-84.5, 46.5], [-88.0, 48.0],
  [-95.2, 49.0], [-104.0, 49.0], [-110.0, 49.0], [-116.0, 49.0], [-122.8, 49.0],
  [-124.7, 48.4],
];
const usOutline = US_OUTLINE_LONLAT.map(([lon, lat]) => project(lon, lat));

// --- Layout -------------------------------------------------------------
const GRID = { left: 70, top: 130, right: 230, bottom: 60 };

// --- Screen-space proximity clustering -------------------------------------
// Union-find single-linkage merge: any two points closer than CELL_PX (in
// screen pixels, at the *current* zoom window) join the same cluster. This
// chains an entire metro area into one cluster regardless of where its points
// happen to fall relative to a fixed grid line — unlike naive grid-bucket
// clustering, adjacency near a cell boundary no longer splits one visual
// blob into several overlapping circles. Threshold is fixed in CSS px, but
// the data-space distance it covers grows or shrinks with the current zoom
// window, so zooming in naturally splits clusters apart and zooming out
// re-merges them.
const CELL_PX = 56;

function clusterStores(xMin, xMax, yMin, yMax) {
  const pxPerX = (size.width - GRID.left - GRID.right) / (xMax - xMin);
  const pxPerY = (size.height - GRID.top - GRID.bottom) / (yMax - yMin);
  const visible = stores.filter((p) => p.x >= xMin && p.x <= xMax && p.y >= yMin && p.y <= yMax);
  const px = visible.map((p) => (p.x - xMin) * pxPerX);
  const py = visible.map((p) => (p.y - yMin) * pxPerY);

  const parent = visible.map((_, i) => i);
  function find(i) {
    while (parent[i] !== i) {
      parent[i] = parent[parent[i]];
      i = parent[i];
    }
    return i;
  }
  const thresh2 = CELL_PX * CELL_PX;
  for (let i = 0; i < visible.length; i++) {
    for (let j = i + 1; j < visible.length; j++) {
      const dx = px[i] - px[j];
      const dy = py[i] - py[j];
      if (dx * dx + dy * dy <= thresh2) {
        const ri = find(i);
        const rj = find(j);
        if (ri !== rj) parent[ri] = rj;
      }
    }
  }

  const groups = new Map();
  visible.forEach((p, i) => {
    const root = find(i);
    if (!groups.has(root)) groups.set(root, []);
    groups.get(root).push(p);
  });

  const clusters = [];
  const singles = [];
  for (const members of groups.values()) {
    if (members.length === 1) {
      singles.push(members[0]);
      continue;
    }
    const counts = new Map();
    for (const m of members) counts.set(m.category.name, (counts.get(m.category.name) || 0) + 1);
    // Canonical CATEGORIES order (not sorted by count) so a cluster's ring
    // always draws the same category in the same angular slot — comparing
    // the color mix across clusters at a glance doesn't require re-reading
    // each one from scratch.
    const segments = CATEGORIES.map((cat) => ({
      name: cat.name,
      color: cat.color,
      count: counts.get(cat.name) || 0,
    })).filter((s) => s.count > 0);
    clusters.push({
      x: members.reduce((s, m) => s + m.x, 0) / members.length,
      y: members.reduce((s, m) => s + m.y, 0) / members.length,
      count: members.length,
      segments,
      breakdown: [...segments].sort((a, b) => b.count - a.count).map((s) => [s.name, s.count]),
    });
  }
  return { clusters, singles };
}

const clusterSize = (count) => 26 + Math.sqrt(count) * 7;

function seriesFor(xMin, xMax, yMin, yMax) {
  const { clusters, singles } = clusterStores(xMin, xMax, yMin, yMax);
  return [
    {
      name: "Coastline",
      type: "custom",
      coordinateSystem: "cartesian2d",
      renderItem(params, api) {
        const points = usOutline.map((c) => api.coord(c));
        return {
          type: "polyline",
          shape: { points },
          style: { stroke: t.inkSoft, lineWidth: 1.5, fill: "none", opacity: 0.5 },
        };
      },
      data: [0],
      silent: true,
      z: 0,
    },
    {
      name: "Stores",
      type: "scatter",
      coordinateSystem: "cartesian2d",
      data: singles.map((p) => ({
        value: [p.x, p.y],
        category: p.category.name,
        itemStyle: { color: p.category.color },
      })),
      encode: { x: 0, y: 1 },
      symbolSize: 12,
      itemStyle: { borderColor: t.pageBg, borderWidth: 1.5, opacity: 0.9 },
      z: 2,
    },
    {
      // Donut-ring glyph: each cluster's category mix is drawn directly as
      // ring segments (canonical category order, so the same type always
      // lands in the same angular slot across clusters) instead of a single
      // dominant-color dot — the breakdown reads at a glance, no hover
      // needed. The hole is punched to the page background so the count
      // label stays legible regardless of which colors sit in the ring.
      name: "Clusters",
      type: "custom",
      coordinateSystem: "cartesian2d",
      renderItem(params, api) {
        const [cx, cy] = api.coord([api.value(0), api.value(1)]);
        const c = clusters[params.dataIndex];
        const outerR = clusterSize(c.count) / 2;
        const innerR = outerR * 0.58;
        const children = [
          { type: "circle", shape: { cx, cy, r: innerR }, style: { fill: t.pageBg } },
        ];
        let angle = -Math.PI / 2;
        for (const seg of c.segments) {
          const sweep = (seg.count / c.count) * Math.PI * 2;
          children.push({
            type: "sector",
            shape: { cx, cy, r: outerR, r0: innerR, startAngle: angle, endAngle: angle + sweep, clockwise: true },
            style: { fill: seg.color, stroke: t.pageBg, lineWidth: 1.5 },
          });
          angle += sweep;
        }
        children.push({
          type: "circle",
          shape: { cx, cy, r: outerR },
          style: { stroke: t.ink, lineWidth: 1, opacity: 0.12, fill: "none" },
        });
        children.push({
          type: "text",
          style: {
            x: cx,
            y: cy,
            text: String(c.count),
            fill: t.ink,
            fontSize: 13,
            fontWeight: "bold",
            align: "center",
            verticalAlign: "middle",
          },
        });
        return { type: "group", children };
      },
      data: clusters.map((c) => ({ value: [c.x, c.y], count: c.count, breakdown: c.breakdown })),
      encode: { x: 0, y: 1 },
      cursor: "pointer",
      z: 3,
    },
  ];
}

// --- Category color key (fixed screen-space graphic, stacked top-to-bottom) -
// A manual key rather than the `legend` component: legend swatches derive
// their color from a matching series name, but "Flagship"/"Outlet"/etc. are
// per-point categories split across the "Stores" and "Clusters" series, not
// series of their own — a plain `legend.data` list has nothing to bind to.
const KEY_X = size.width - GRID.right + 40;
const keyGraphics = [
  {
    type: "text",
    left: KEY_X,
    top: 150,
    style: { text: "Store type", fill: t.inkSoft, fontSize: 13, fontWeight: 500 },
  },
];
CATEGORIES.forEach((cat, i) => {
  const cy = 180 + i * 30;
  keyGraphics.push({
    type: "circle",
    shape: { cx: KEY_X + 7, cy, r: 7 },
    style: { fill: cat.color },
  });
  keyGraphics.push({
    type: "text",
    left: KEY_X + 22,
    top: cy - 8,
    style: { text: cat.name, fill: t.inkSoft, fontSize: 14 },
  });
});
keyGraphics.push({
  type: "text",
  left: KEY_X,
  top: 180 + CATEGORIES.length * 30 + 10,
  style: {
    text: "Ring segments show the\ncategory mix per cluster;\ncenter number = store count",
    fill: t.inkSoft,
    fontSize: 12,
    lineHeight: 17,
  },
});

// --- Init -----------------------------------------------------------------
const chart = echarts.init(document.getElementById("container"));
const title = "map-marker-clustered · javascript · echarts · anyplot.ai";

chart.setOption({
  animation: false,
  backgroundColor: "transparent",
  title: {
    text: title,
    subtext: "Scroll to zoom, drag a cluster into view, click a cluster to expand it",
    left: "center",
    top: 24,
    textStyle: { color: t.ink, fontSize: 22, fontWeight: 500 },
    subtextStyle: { color: t.inkSoft, fontSize: 13 },
  },
  graphic: keyGraphics,
  tooltip: {
    trigger: "item",
    formatter(params) {
      if (params.seriesName === "Clusters") {
        const lines = params.data.breakdown.map(([name, n]) => `${name}: ${n}`);
        return `${params.data.count} stores<br/>${lines.join("<br/>")}`;
      }
      if (params.seriesName === "Stores") return `${params.data.category} store`;
      return "";
    },
  },
  grid: GRID,
  xAxis: {
    type: "value",
    min: FULL_X_MIN,
    max: FULL_X_MAX,
    show: false,
  },
  yAxis: {
    type: "value",
    min: FULL_Y_MIN,
    max: FULL_Y_MAX,
    show: false,
  },
  dataZoom: [
    { type: "inside", xAxisIndex: 0, zoomOnMouseWheel: true, moveOnMouseMove: true, filterMode: "none" },
    { type: "inside", yAxisIndex: 0, zoomOnMouseWheel: true, moveOnMouseMove: true, filterMode: "none" },
  ],
  series: seriesFor(FULL_X_MIN, FULL_X_MAX, FULL_Y_MIN, FULL_Y_MAX),
});

// Current visible window in data units, derived from the dataZoom components'
// start/end percentages (valid whether the zoom came from the mouse wheel,
// a drag-pan, or a dispatched action).
function currentWindow() {
  const [dzX, dzY] = chart.getOption().dataZoom;
  const xMin = FULL_X_MIN + ((FULL_X_MAX - FULL_X_MIN) * dzX.start) / 100;
  const xMax = FULL_X_MIN + ((FULL_X_MAX - FULL_X_MIN) * dzX.end) / 100;
  const yMin = FULL_Y_MIN + ((FULL_Y_MAX - FULL_Y_MIN) * dzY.start) / 100;
  const yMax = FULL_Y_MIN + ((FULL_Y_MAX - FULL_Y_MIN) * dzY.end) / 100;
  return { xMin, xMax, yMin, yMax };
}

// Re-cluster whenever the visible window changes (scroll-zoom or pan), so
// zooming in genuinely splits clusters into their member markers instead of
// just rescaling the same fixed dots.
chart.on("dataZoom", () => {
  const { xMin, xMax, yMin, yMax } = currentWindow();
  chart.setOption({ series: seriesFor(xMin, xMax, yMin, yMax) });
});

// Click a cluster to zoom into its neighborhood — real dataZoom action, not a
// drawn/faked "expanded" state.
chart.on("click", (params) => {
  if (params.seriesName !== "Clusters") return;
  const [cx, cy] = params.value;
  const { xMin, xMax, yMin, yMax } = currentWindow();
  const newXSpan = (xMax - xMin) * 0.4;
  const newYSpan = (yMax - yMin) * 0.4;
  chart.dispatchAction({
    type: "dataZoom",
    xAxisIndex: 0,
    startValue: cx - newXSpan / 2,
    endValue: cx + newXSpan / 2,
  });
  chart.dispatchAction({
    type: "dataZoom",
    yAxisIndex: 0,
    startValue: cy - newYSpan / 2,
    endValue: cy + newYSpan / 2,
  });
});
Runnable source as JSON, for any HTTP client: https://api.anyplot.ai/specs/map-marker-clustered/echarts/code. Any spec id and library id listed in llms-full.txt fit the same URL shape; every URL below is complete and callable.
{
  "spec_id": "map-marker-clustered",
  "language": "javascript",
  "library": "echarts",
  "page": "https://anyplot.ai/map-marker-clustered/javascript/echarts",
  "hub": "https://anyplot.ai/map-marker-clustered",
  "code_json": "https://api.anyplot.ai/specs/map-marker-clustered/echarts/code",
  "spec_json": "https://api.anyplot.ai/specs/map-marker-clustered",
  "render_light_png": "https://storage.googleapis.com/anyplot-images/plots/map-marker-clustered/javascript/echarts/plot-light.png",
  "render_dark_png": "https://storage.googleapis.com/anyplot-images/plots/map-marker-clustered/javascript/echarts/plot-dark.png",
  "interactive_light_html": "https://storage.googleapis.com/anyplot-images/plots/map-marker-clustered/javascript/echarts/plot-light.html",
  "interactive_dark_html": "https://storage.googleapis.com/anyplot-images/plots/map-marker-clustered/javascript/echarts/plot-dark.html",
  "quality_score": 94.0,
  "license": "MIT",
  "guide": "https://anyplot.ai/llms.txt"
}
Part of Clustered Marker Map on anyplot.ai.