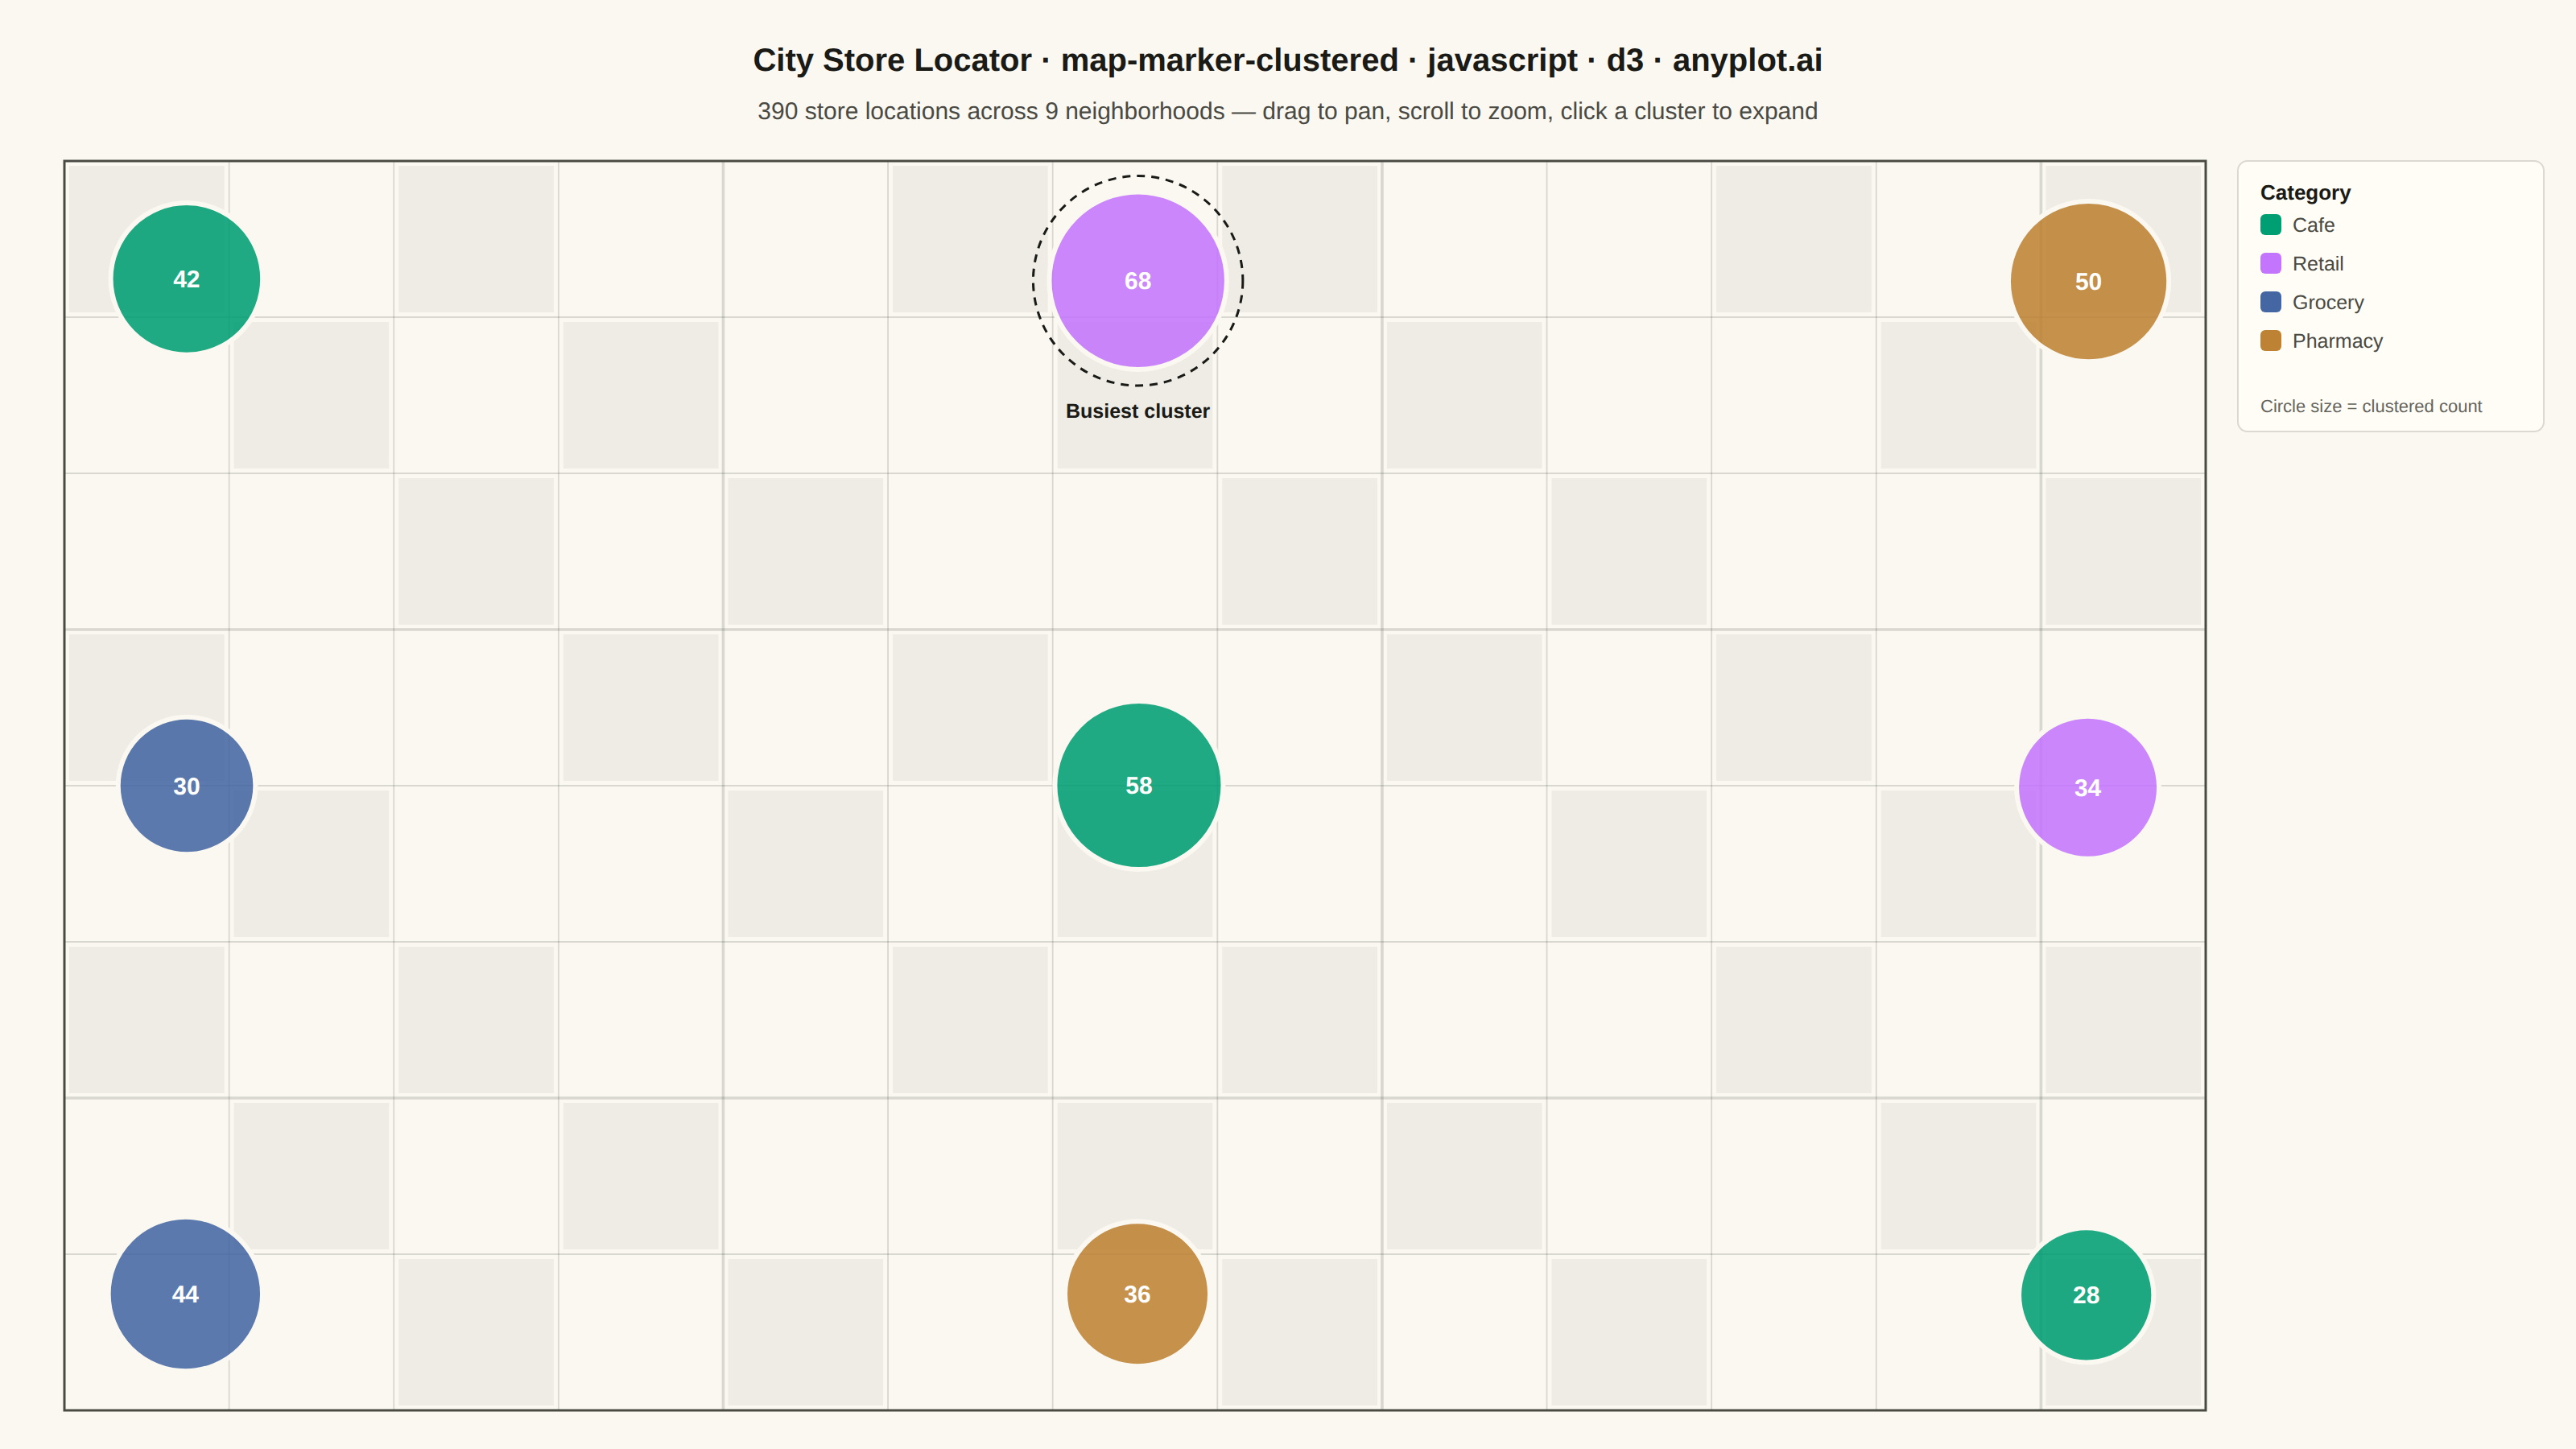
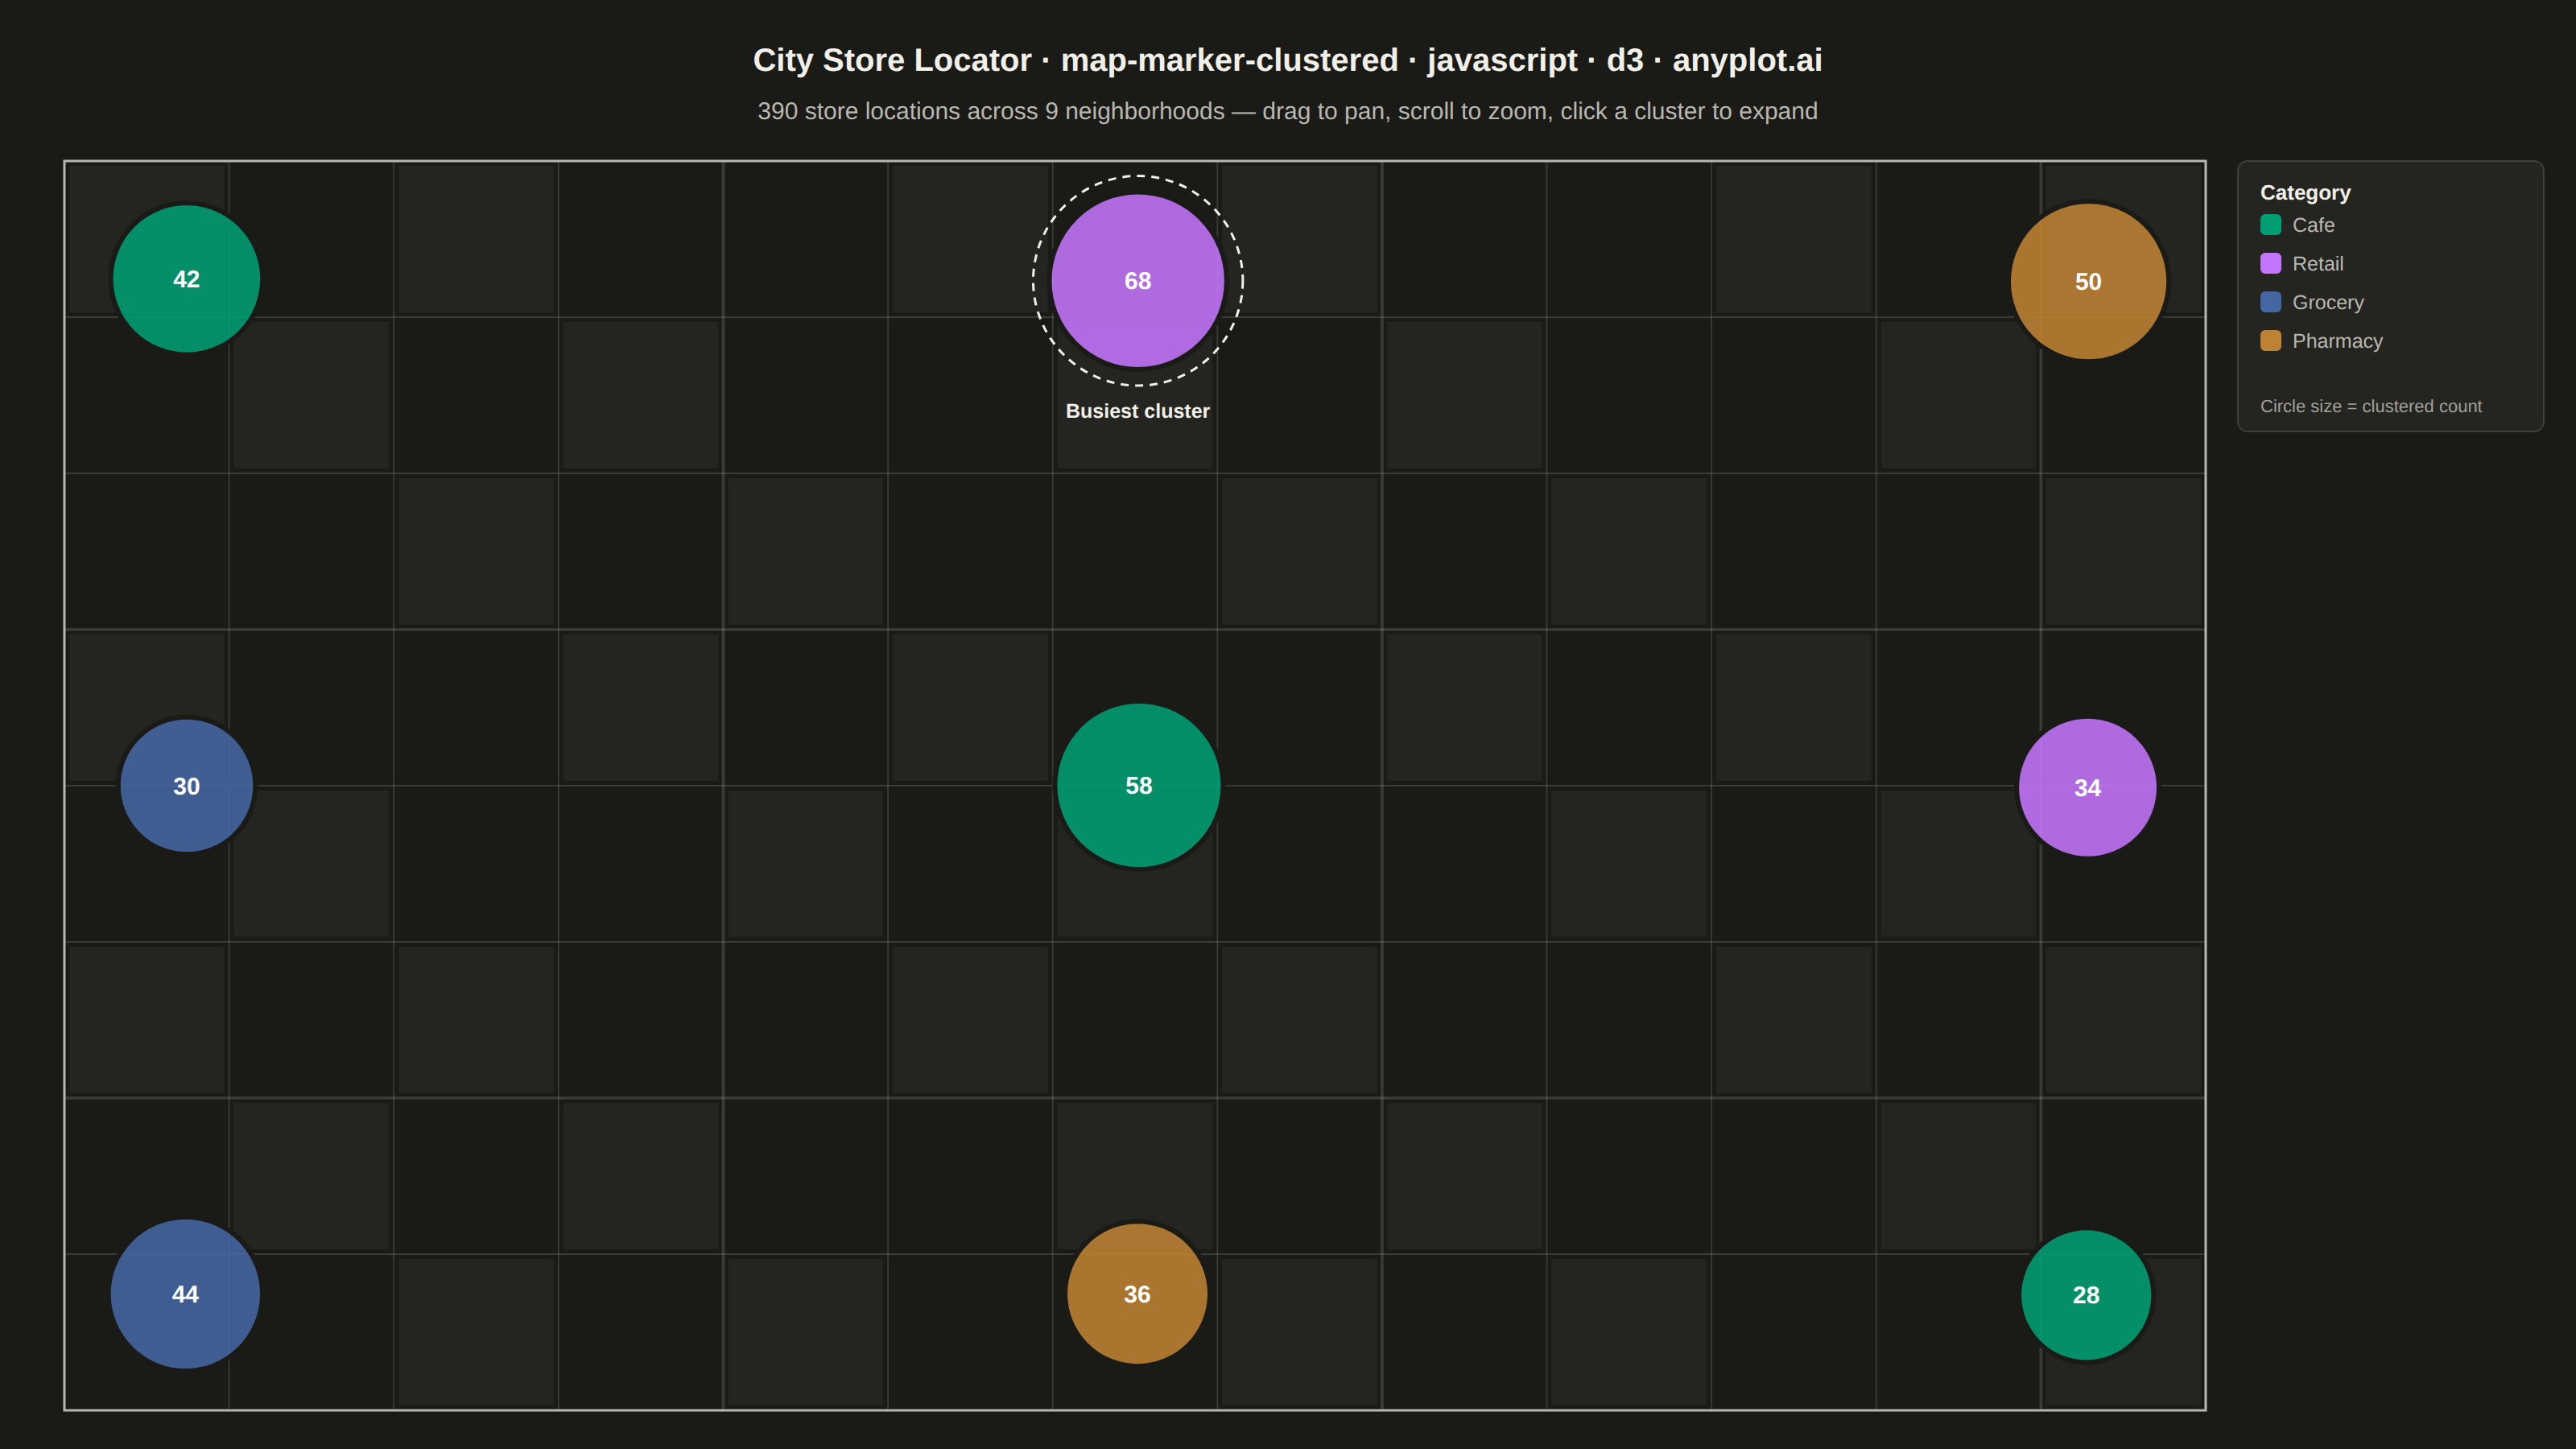
The same plot in 14 other libraries — JavaScript: Chart.js, Apache ECharts, Highcharts, MUI X Charts; Python: Altair, Bokeh, lets-plot, Matplotlib, Plotly, plotnine, Pygal, Seaborn; R: ggplot2; Julia: Makie.jl. Compare all 15 side by side: Clustered Marker Map in Python, R, Julia and JavaScript.
A geographic map that dynamically clusters nearby markers based on the current zoom level. At lower zoom levels, clusters aggregate multiple points into a single marker displaying the count, while zooming in progressively expands clusters to reveal individual markers. This visualization is essential for efficiently displaying large geographic datasets without visual clutter, enabling users to see both the overall distribution and specific locations through interactive exploration.
// anyplot.ai
// map-marker-clustered: Clustered Marker Map
// Library: d3 7.9.0 | JavaScript 22.23.2
// Quality: 91/100 | Created: 2026-09-02

const t = window.ANYPLOT_TOKENS;
const { width, height } = window.ANYPLOT_SIZE;
const SPEC_ID = "map-marker-clustered";
const margin = { top: 100, right: 230, bottom: 24, left: 40 };
const iw = width - margin.left - margin.right;
const ih = height - margin.top - margin.bottom;

// --- Data (in-memory, deterministic) ----------------------------------------
// A tiny fixed-seed LCG stands in for the browser's lack of a seeded RNG.
function lcg(seed) {
  let state = seed >>> 0;
  return () => {
    state = (Math.imul(state, 1664525) + 1013904223) >>> 0;
    return state / 4294967296;
  };
}
const rand = lcg(20260902);

const CATEGORIES = ["Cafe", "Retail", "Grocery", "Pharmacy"];
// A 3x3 grid of districts, spaced generously relative to the per-point jitter
// below so each forms one cohesive blob at the default zoom instead of
// fragmenting or bleeding into its neighbor — and fills the landscape canvas
// better than a sparser layout would.
const NEIGHBORHOODS = [
  { name: "Northpark", lon: -122.47, lat: 37.85, n: 42, primary: "Cafe" },
  { name: "Downtown", lon: -122.4, lat: 37.85, n: 68, primary: "Retail" },
  { name: "Eastgate", lon: -122.33, lat: 37.85, n: 50, primary: "Pharmacy" },
  { name: "Lakeside", lon: -122.47, lat: 37.815, n: 30, primary: "Grocery" },
  { name: "Midtown", lon: -122.4, lat: 37.815, n: 58, primary: "Cafe" },
  { name: "Harbor", lon: -122.33, lat: 37.815, n: 34, primary: "Retail" },
  { name: "Riverside", lon: -122.47, lat: 37.78, n: 44, primary: "Grocery" },
  { name: "Hillcrest", lon: -122.4, lat: 37.78, n: 36, primary: "Pharmacy" },
  { name: "Old Town", lon: -122.33, lat: 37.78, n: 28, primary: "Cafe" },
];

const data = [];
for (const nb of NEIGHBORHOODS) {
  for (let i = 0; i < nb.n; i++) {
    const jitterLon = ((rand() + rand() + rand() - 1.5) / 1.5) * 0.0022;
    const jitterLat = ((rand() + rand() + rand() - 1.5) / 1.5) * 0.0022;
    const category = rand() < 0.6 ? nb.primary : CATEGORIES[Math.floor(rand() * CATEGORIES.length)];
    data.push({ lon: nb.lon + jitterLon, lat: nb.lat + jitterLat, category });
  }
}

// --- Mount + projection ------------------------------------------------------
const svg = d3.select("#container").append("svg").attr("width", width).attr("height", height);
const color = d3.scaleOrdinal().domain(CATEGORIES).range(t.palette);

// A city-scale extent is small enough that Mercator curvature is negligible,
// so lon/lat map straight onto the canvas via independent linear scales —
// this fills the drawing area edge-to-edge instead of Mercator's fitExtent
// letterboxing to a fixed true-aspect ratio.
const pad = 60;
const lonScale = d3.scaleLinear().domain(d3.extent(data, (d) => d.lon)).range([pad, iw - pad]);
const latScale = d3.scaleLinear().domain(d3.extent(data, (d) => d.lat)).range([ih - pad, pad]);
const basePoints = data.map((d) => ({ x: lonScale(d.lon), y: latScale(d.lat), category: d.category }));

const mapG = svg.append("g").attr("transform", `translate(${margin.left},${margin.top})`);

// Background + pointer-event surface for panning/zooming the map.
const captureRect = mapG
  .append("rect")
  .attr("width", iw)
  .attr("height", ih)
  .attr("fill", t.pageBg)
  .attr("pointer-events", "all");

// A fixed clip frame keeps the viewport stable while its content pans/zooms.
svg
  .append("defs")
  .append("clipPath")
  .attr("id", "map-clip")
  .append("rect")
  .attr("width", iw)
  .attr("height", ih);
const clipG = mapG.append("g").attr("clip-path", "url(#map-clip)");
const zoomLayer = clipG.append("g");
const streetsLayer = zoomLayer.append("g");
const hullLayer = zoomLayer.append("g");
const focusLayer = zoomLayer.append("g");
const markerLayer = zoomLayer.append("g");

// Stylized city-street grid basemap (geographic context per the spec notes).
// non-scaling-stroke keeps line thickness constant on screen while zoomLayer scales.
const streetCols = 13;
const streetRows = 8;

// Subtle "city block" fills between the grid lines — purely decorative basemap
// texture (a deterministic checkerboard-like pattern, not random) that fills
// the dead space between clusters so the default view reads as a real city
// fabric instead of an empty grid. Drawn before the street lines so the lines
// sit on top of the blocks.
for (let col = 0; col < streetCols; col++) {
  for (let row = 0; row < streetRows; row++) {
    if ((col * 3 + row * 2) % 5 >= 2) continue;
    const bw = iw / streetCols;
    const bh = ih / streetRows;
    streetsLayer
      .append("rect")
      .attr("x", col * bw + 3)
      .attr("y", row * bh + 3)
      .attr("width", bw - 6)
      .attr("height", bh - 6)
      .attr("fill", t.ink)
      .attr("opacity", 0.05);
  }
}

for (let i = 1; i < streetCols; i++) {
  const x = (i * iw) / streetCols;
  streetsLayer
    .append("line")
    .attr("x1", x)
    .attr("y1", 0)
    .attr("x2", x)
    .attr("y2", ih)
    .attr("stroke", t.grid)
    .attr("stroke-width", i % 4 === 0 ? 1.8 : 0.9)
    .style("vector-effect", "non-scaling-stroke");
}
for (let j = 1; j < streetRows; j++) {
  const y = (j * ih) / streetRows;
  streetsLayer
    .append("line")
    .attr("x1", 0)
    .attr("y1", y)
    .attr("x2", iw)
    .attr("y2", y)
    .attr("stroke", t.grid)
    .attr("stroke-width", j % 3 === 0 ? 1.8 : 0.9)
    .style("vector-effect", "non-scaling-stroke");
}

mapG.append("rect").attr("width", iw).attr("height", ih).attr("fill", "none").attr("stroke", t.inkSoft).attr("stroke-width", 1.5);

// --- Clustering ---------------------------------------------------------------
// Chain (flood-fill) proximity clustering: a point joins a cluster if it's
// within `radius` screen px of ANY member already in it, not just the seed —
// this keeps a dense blob as one cluster instead of fragmenting into several
// overlapping sub-circles. Effective radius shrinks as zoomLayer's scale
// grows, so a fixed on-screen distance drives clusters apart while zooming.
function clusterPoints(points, radius) {
  const n = points.length;
  const used = new Array(n).fill(false);
  const groups = [];
  for (let i = 0; i < n; i++) {
    if (used[i]) continue;
    const group = [points[i]];
    used[i] = true;
    const frontier = [points[i]];
    while (frontier.length) {
      const p = frontier.pop();
      for (let j = 0; j < n; j++) {
        if (used[j]) continue;
        if (Math.hypot(p.x - points[j].x, p.y - points[j].y) < radius) {
          used[j] = true;
          group.push(points[j]);
          frontier.push(points[j]);
        }
      }
    }
    groups.push(group);
  }
  return groups;
}

const CLUSTER_RADIUS_PX = 52;
const SCALE_MAX = 9;

function dominantCategory(members) {
  const counts = d3.rollup(
    members,
    (v) => v.length,
    (m) => m.category
  );
  return Array.from(counts).sort((a, b) => b[1] - a[1])[0][0];
}

function radiusFor(count) {
  return count === 1 ? 7 : Math.min(70, 18 + Math.sqrt(count) * 4.5);
}

function showHull(d, k) {
  hullLayer.selectAll("*").remove();
  if (d.count < 2) return;
  const strokeW = 1.5 / k;
  if (d.count === 2) {
    for (const m of d.members) {
      hullLayer
        .append("line")
        .attr("x1", d.x)
        .attr("y1", d.y)
        .attr("x2", m.x)
        .attr("y2", m.y)
        .attr("stroke", color(d.category))
        .attr("stroke-width", strokeW)
        .attr("stroke-dasharray", `${4 / k},${3 / k}`);
    }
  } else {
    const hull = d3.polygonHull(d.members.map((m) => [m.x, m.y]));
    if (hull) {
      hullLayer
        .append("polygon")
        .attr("points", hull.map((p) => p.join(",")).join(" "))
        .attr("fill", color(d.category))
        .attr("fill-opacity", 0.12)
        .attr("stroke", color(d.category))
        .attr("stroke-width", strokeW);
    }
  }
}
function hideHull() {
  hullLayer.selectAll("*").remove();
}

function zoomToCluster(d) {
  if (d.count < 2) return;
  const current = d3.zoomTransform(captureRect.node());
  const k2 = Math.min(SCALE_MAX, current.k * 2.4);
  const target = d3.zoomIdentity.translate(iw / 2, ih / 2).scale(k2).translate(-d.x, -d.y);
  captureRect.transition().duration(750).call(zoomBehavior.transform, target);
}

// Re-clusters and redraws markers for the current zoom transform. Called once
// on mount and again on every zoom/pan event, so cluster membership genuinely
// tracks the live zoom level rather than a fixed pre-baked state.
function update(transform) {
  const k = transform.k;
  const groups = clusterPoints(basePoints, CLUSTER_RADIUS_PX / k);
  const clusters = groups.map((members) => ({
    x: d3.mean(members, (m) => m.x),
    y: d3.mean(members, (m) => m.y),
    count: members.length,
    category: dominantCategory(members),
    members,
  }));

  const sel = markerLayer.selectAll("g.cluster").data(clusters);
  sel.exit().remove();
  const enter = sel.enter().append("g").attr("class", "cluster");
  enter.append("circle");
  enter.append("text");
  const merged = enter.merge(sel);

  merged
    .attr("transform", (d) => `translate(${d.x},${d.y})`)
    .style("cursor", (d) => (d.count > 1 ? "pointer" : "default"))
    .on("mouseenter", (event, d) => showHull(d, k))
    .on("mouseleave", hideHull)
    .on("click", (event, d) => zoomToCluster(d));

  merged
    .select("circle")
    .attr("r", (d) => radiusFor(d.count) / k)
    .attr("fill", (d) => color(d.category))
    .attr("fill-opacity", (d) => (d.count > 1 ? 0.88 : 1))
    .attr("stroke", t.pageBg)
    .attr("stroke-width", (d) => (d.count > 1 ? 3 : 2) / k)
    .style("vector-effect", "non-scaling-stroke");

  merged
    .select("text")
    .attr("text-anchor", "middle")
    .attr("dy", "0.35em")
    .style("font-size", `${15 / k}px`)
    .style("font-weight", "600")
    .style("fill", "#FFFFFF")
    .style("pointer-events", "none")
    .text((d) => (d.count > 1 ? d.count : ""));

  // Focal point: recomputed every update so it always tracks whichever
  // cluster is currently largest — a highlight ring + callout instead of a
  // flat scene where every cluster carries equal visual weight.
  focusLayer.selectAll("*").remove();
  const busiest = clusters.reduce((a, b) => (b.count > a.count ? b : a), clusters[0]);
  if (busiest && busiest.count > 1) {
    const ringR = radiusFor(busiest.count) / k + 10 / k;
    const labelGap = 20 / k;
    // Flip the callout below the ring when there isn't room above, so it
    // never gets cropped by the map's clip frame for a top-row cluster.
    const labelY = busiest.y - ringR - labelGap > 18 / k ? busiest.y - ringR - 8 / k : busiest.y + ringR + labelGap;
    focusLayer
      .append("circle")
      .attr("cx", busiest.x)
      .attr("cy", busiest.y)
      .attr("r", ringR)
      .attr("fill", "none")
      .attr("stroke", t.ink)
      .attr("stroke-width", 1.5 / k)
      .attr("stroke-dasharray", `${5 / k},${4 / k}`)
      .style("vector-effect", "non-scaling-stroke")
      .style("pointer-events", "none");
    focusLayer
      .append("text")
      .attr("x", busiest.x)
      .attr("y", labelY)
      .attr("text-anchor", "middle")
      .attr("fill", t.ink)
      .style("font-size", `${12.5 / k}px`)
      .style("font-weight", "600")
      .style("pointer-events", "none")
      .text("Busiest cluster");
  }
}

// --- Zoom / pan behavior -------------------------------------------------------
function zoomed(event) {
  zoomLayer.attr("transform", event.transform);
  update(event.transform);
}
const zoomBehavior = d3
  .zoom()
  .scaleExtent([1, SCALE_MAX])
  .translateExtent([
    [0, 0],
    [iw, ih],
  ])
  .extent([
    [0, 0],
    [iw, ih],
  ])
  .on("zoom", zoomed);
captureRect.call(zoomBehavior).call(zoomBehavior.transform, d3.zoomIdentity);

// --- Title + subtitle -----------------------------------------------------------
const titleText = `City Store Locator · ${SPEC_ID} · javascript · d3 · anyplot.ai`;
const titleFontSize = titleText.length > 67 ? Math.round((22 * 67) / titleText.length) : 22;
svg
  .append("text")
  .attr("x", width / 2)
  .attr("y", 44)
  .attr("text-anchor", "middle")
  .attr("fill", t.ink)
  .style("font-size", `${titleFontSize}px`)
  .style("font-weight", "600")
  .text(titleText);
svg
  .append("text")
  .attr("x", width / 2)
  .attr("y", 74)
  .attr("text-anchor", "middle")
  .attr("fill", t.inkSoft)
  .style("font-size", "15px")
  .text(`${data.length} store locations across ${NEIGHBORHOODS.length} neighborhoods — drag to pan, scroll to zoom, click a cluster to expand`);

// --- Legend (dedicated right-margin column, never overlaps map content) --------
const legendW = 190;
const legendH = 46 + CATEGORIES.length * 24 + 26;
const legendG = mapG.append("g").attr("transform", `translate(${iw + 20},0)`);
legendG.append("rect").attr("width", legendW).attr("height", legendH).attr("fill", t.elevatedBg).attr("stroke", t.grid).attr("rx", 6);
legendG.append("text").attr("x", 14).attr("y", 24).attr("fill", t.ink).style("font-size", "13px").style("font-weight", "600").text("Category");
CATEGORIES.forEach((cat, i) => {
  const gy = 44 + i * 24;
  legendG.append("rect").attr("x", 14).attr("y", gy - 11).attr("width", 13).attr("height", 13).attr("rx", 3).attr("fill", color(cat));
  legendG.append("text").attr("x", 34).attr("y", gy).attr("fill", t.inkSoft).style("font-size", "12.5px").text(cat);
});
legendG
  .append("text")
  .attr("x", 14)
  .attr("y", 44 + CATEGORIES.length * 24 + 16)
  .attr("fill", t.inkSoft)
  .style("font-size", "11px")
  .style("opacity", 0.85)
  .text("Circle size = clustered count");
Runnable source as JSON, for any HTTP client: https://api.anyplot.ai/specs/map-marker-clustered/d3/code. Any spec id and library id listed in llms-full.txt fit the same URL shape; every URL below is complete and callable.
{
  "spec_id": "map-marker-clustered",
  "language": "javascript",
  "library": "d3",
  "page": "https://anyplot.ai/map-marker-clustered/javascript/d3",
  "hub": "https://anyplot.ai/map-marker-clustered",
  "code_json": "https://api.anyplot.ai/specs/map-marker-clustered/d3/code",
  "spec_json": "https://api.anyplot.ai/specs/map-marker-clustered",
  "render_light_png": "https://storage.googleapis.com/anyplot-images/plots/map-marker-clustered/javascript/d3/plot-light.png",
  "render_dark_png": "https://storage.googleapis.com/anyplot-images/plots/map-marker-clustered/javascript/d3/plot-dark.png",
  "interactive_light_html": "https://storage.googleapis.com/anyplot-images/plots/map-marker-clustered/javascript/d3/plot-light.html",
  "interactive_dark_html": "https://storage.googleapis.com/anyplot-images/plots/map-marker-clustered/javascript/d3/plot-dark.html",
  "quality_score": 91.0,
  "license": "MIT",
  "guide": "https://anyplot.ai/llms.txt"
}
Part of Clustered Marker Map on anyplot.ai.