The same plot in 14 other libraries — Python: Altair, Bokeh, lets-plot, Matplotlib, Plotly, plotnine, Pygal, Seaborn; R: ggplot2; JavaScript: Chart.js, D3.js, Apache ECharts, Highcharts, MUI X Charts. Compare all 15 side by side: Clustered Marker Map in Python, R, Julia and JavaScript.
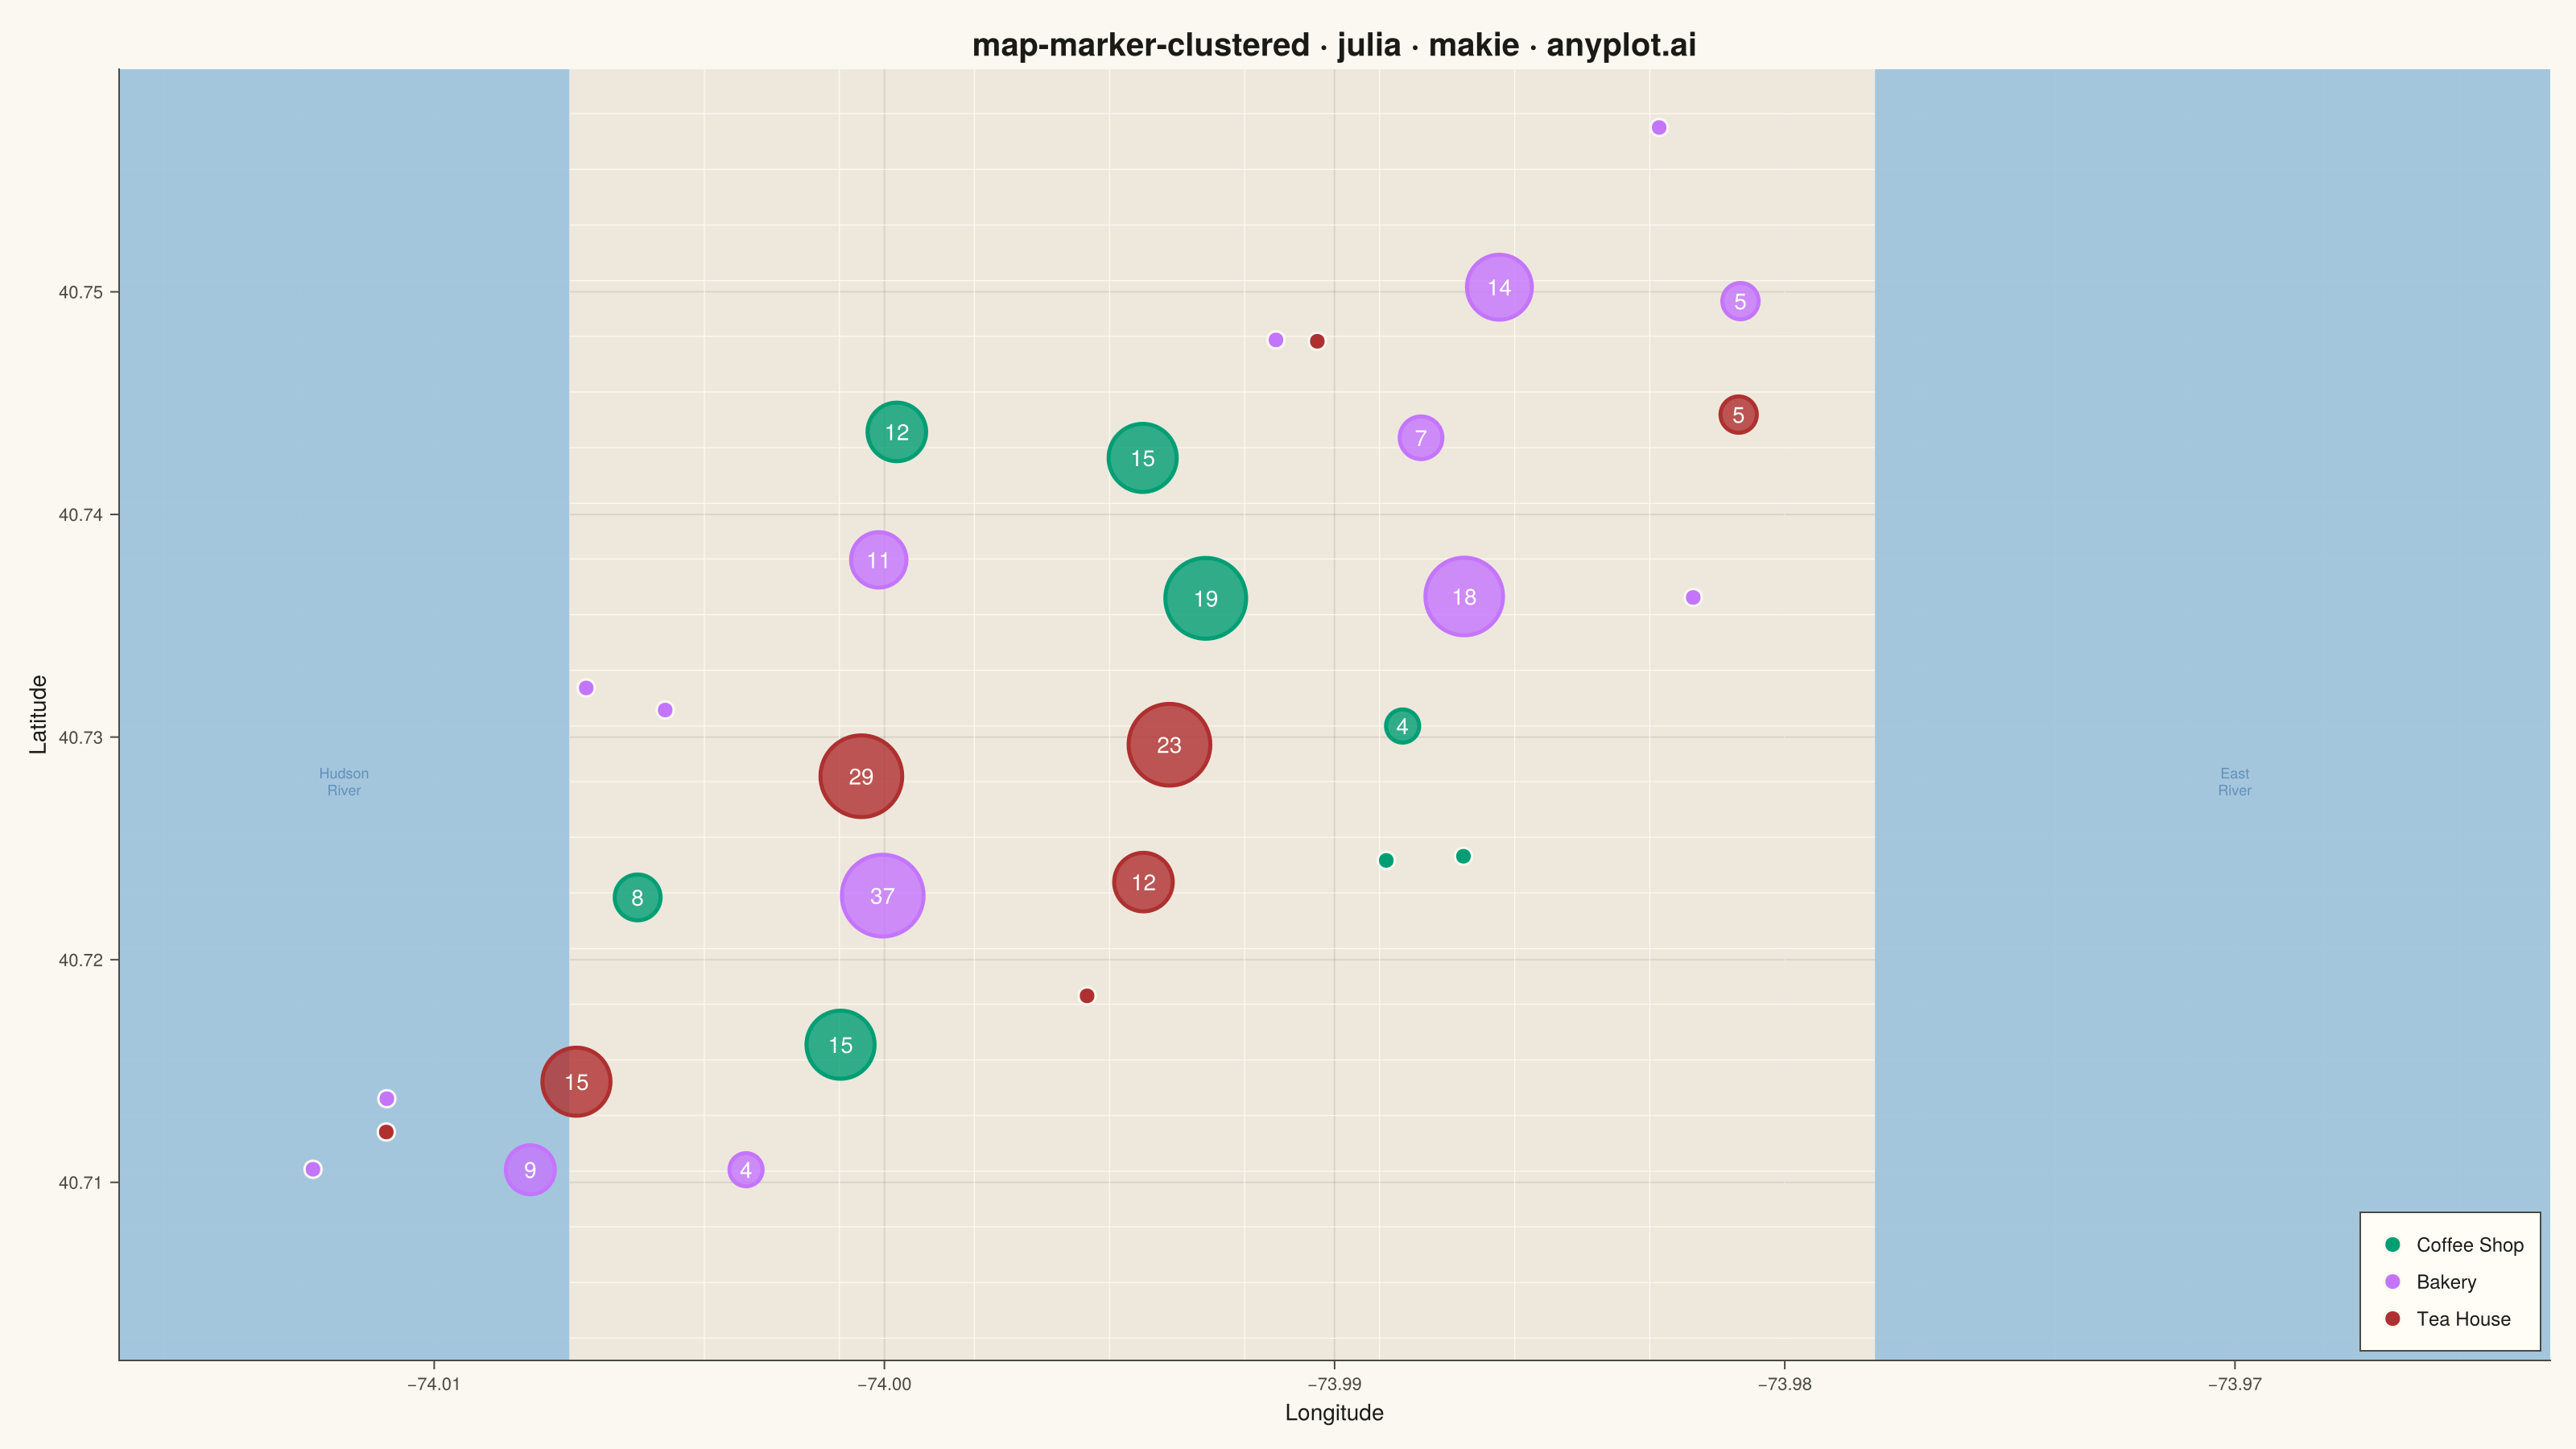
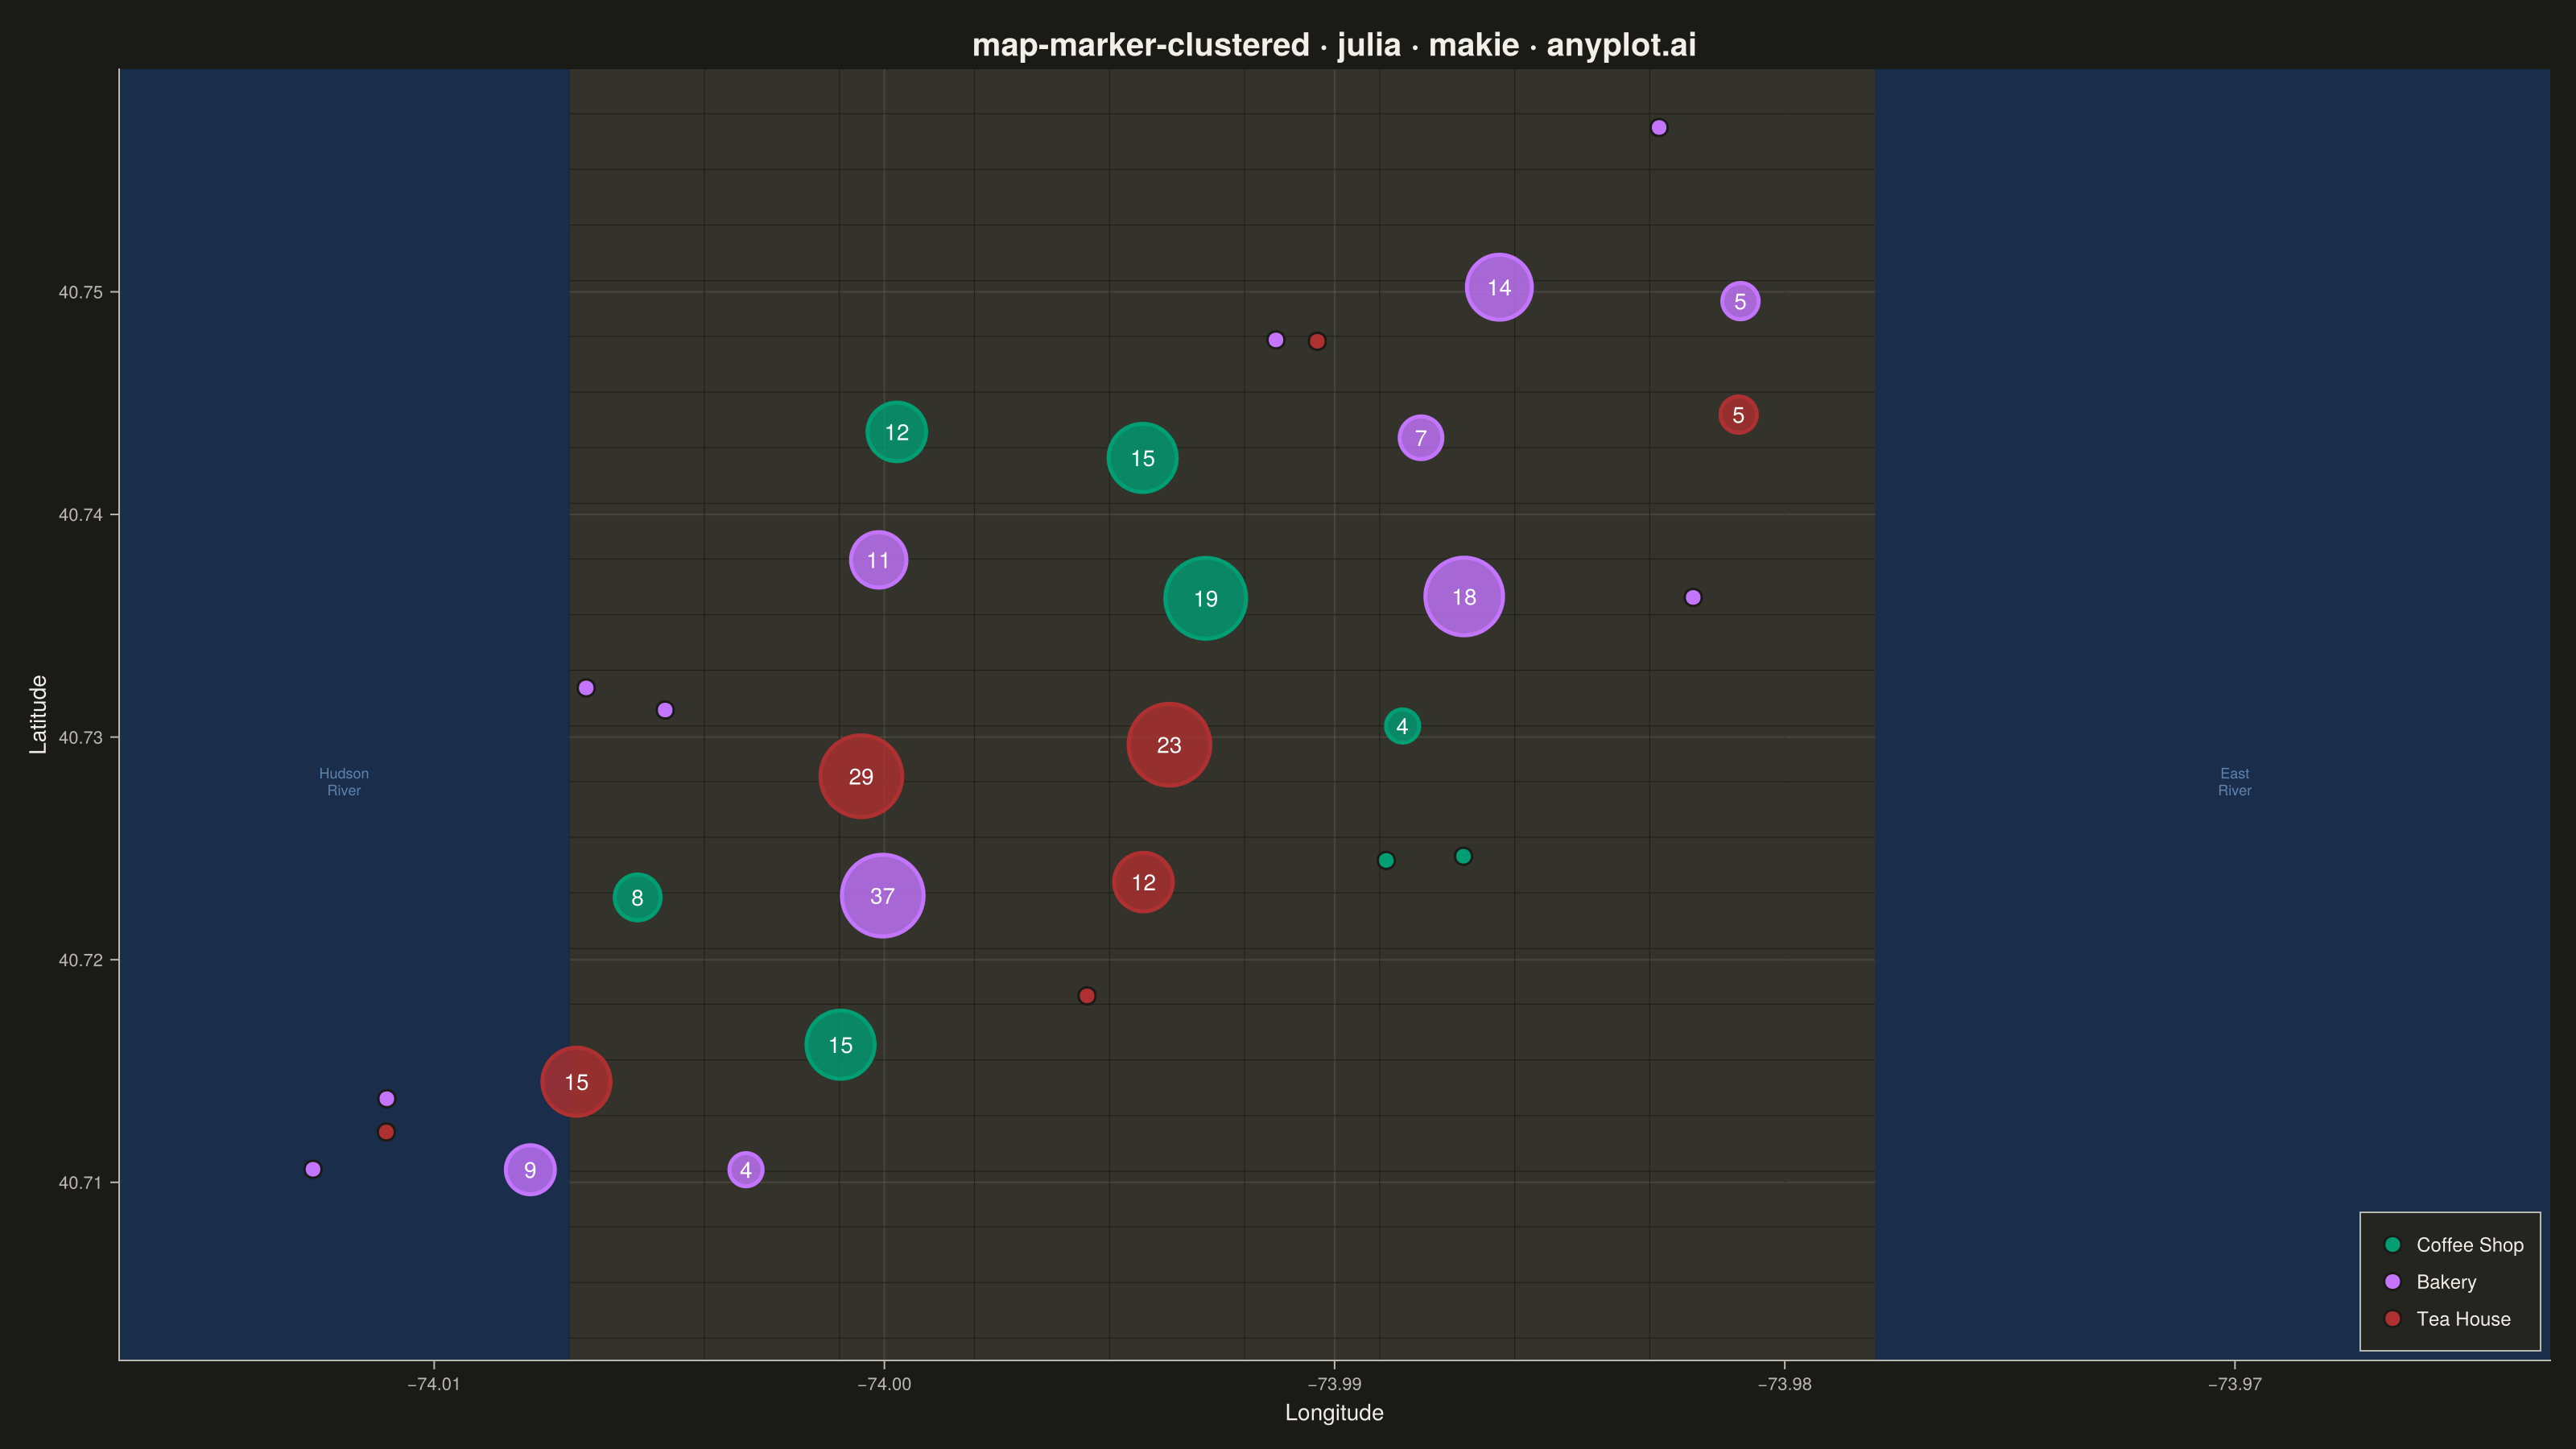
A geographic map that dynamically clusters nearby markers based on the current zoom level. At lower zoom levels, clusters aggregate multiple points into a single marker displaying the count, while zooming in progressively expands clusters to reveal individual markers. This visualization is essential for efficiently displaying large geographic datasets without visual clutter, enabling users to see both the overall distribution and specific locations through interactive exploration.
# anyplot.ai
# map-marker-clustered: Clustered Marker Map
# Library: makie 0.22.10 | Julia 1.11.9
# Quality: 87/100 | Created: 2026-05-23

using CairoMakie
using Colors
using Random
using Statistics

Random.seed!(42)

# Theme tokens
const THEME       = get(ENV, "ANYPLOT_THEME", "light")
const PAGE_BG     = THEME == "light" ? colorant"#FAF8F1" : colorant"#1A1A17"
const ELEVATED_BG = THEME == "light" ? colorant"#FFFDF6" : colorant"#242420"
const INK         = THEME == "light" ? colorant"#1A1A17" : colorant"#F0EFE8"
const INK_SOFT    = THEME == "light" ? colorant"#4A4A44" : colorant"#B8B7B0"

# Basemap palette
const LAND_COLOR   = THEME == "light" ? RGBAf(0.93f0, 0.91f0, 0.86f0, 1.0f0) : RGBAf(0.20f0, 0.20f0, 0.17f0, 1.0f0)
const WATER_COLOR  = THEME == "light" ? RGBAf(0.63f0, 0.77f0, 0.87f0, 0.95f0) : RGBAf(0.10f0, 0.18f0, 0.30f0, 0.95f0)
const STREET_COLOR = THEME == "light" ? RGBAf(1.0f0, 0.99f0, 0.97f0, 0.85f0) : RGBAf(0.10f0, 0.10f0, 0.08f0, 0.70f0)
const WATER_LABEL  = THEME == "light" ? RGBAf(0.25f0, 0.45f0, 0.65f0, 0.65f0) : RGBAf(0.50f0, 0.70f0, 0.90f0, 0.65f0)

const IMPRINT = [
    colorant"#009E73",
    colorant"#C475FD",
    colorant"#AE3030",
    colorant"#4467A3",
    colorant"#99B314",
    colorant"#954477",
    colorant"#BD8233",
]

# Data: specialty venues (coffee shops, bakeries, tea houses) across lower Manhattan, NYC
const CAT_NAMES = ["Coffee Shop", "Bakery", "Tea House"]

district_centers = [
    (40.7128, -74.0060),  # Financial District
    (40.7200, -74.0010),  # Tribeca
    (40.7262, -74.0018),  # SoHo West
    (40.7248, -73.9978),  # SoHo East
    (40.7300, -73.9938),  # NoHo
    (40.7362, -73.9905),  # East Village
    (40.7415, -73.9988),  # West Village
    (40.7478, -73.9855),  # Gramercy / Union Square
]

lats = Float64[]
lons = Float64[]
cat_ids = Int[]

for (clat, clon) in district_centers
    n = rand(22:42)
    for _ in 1:n
        push!(lats, clat + randn() * 0.0033)
        push!(lons, clon + randn() * 0.0033)
        push!(cat_ids, rand(1:3))
    end
end

# Grid-based spatial clustering: 0.007° cells (~650 m)
const GRID_DEG      = 0.007
const MIN_CLUSTER_N = 4

cell_map = Dict{Tuple{Int,Int}, Vector{Int}}()
for i in eachindex(lats)
    key = (floor(Int, lats[i] / GRID_DEG), floor(Int, lons[i] / GRID_DEG))
    push!(get!(cell_map, key, Int[]), i)
end

solo_idx     = Int[]
cluster_rows = Tuple{Float64,Float64,Int,Int}[]   # (lat, lon, npts, dom_cat)

for (_, idxs) in cell_map
    if length(idxs) < MIN_CLUSTER_N
        append!(solo_idx, idxs)
    else
        clat     = mean(lats[idxs])
        clon     = mean(lons[idxs])
        npts     = length(idxs)
        cat_cnts = [sum(cat_ids[j] == c for j in idxs) for c in 1:3]
        dom_cat  = argmax(cat_cnts)
        push!(cluster_rows, (clat, clon, npts, dom_cat))
    end
end

# Figure
fig = Figure(
    size            = (1600, 900),
    fontsize        = 14,
    backgroundcolor = PAGE_BG,
)

ax = Axis(
    fig[1, 1];
    title             = "map-marker-clustered · julia · makie · anyplot.ai",
    titlesize         = 20,
    titlecolor        = INK,
    xlabel            = "Longitude",
    ylabel            = "Latitude",
    xlabelsize        = 14,
    ylabelsize        = 14,
    xticklabelsize    = 11,
    yticklabelsize    = 11,
    xlabelcolor       = INK,
    ylabelcolor       = INK,
    xticklabelcolor   = INK_SOFT,
    yticklabelcolor   = INK_SOFT,
    xtickcolor        = INK_SOFT,
    ytickcolor        = INK_SOFT,
    backgroundcolor   = LAND_COLOR,
    topspinevisible   = false,
    rightspinevisible = false,
    leftspinecolor    = INK_SOFT,
    bottomspinecolor  = INK_SOFT,
    xgridcolor        = RGBAf(Float32(INK.r), Float32(INK.g), Float32(INK.b), 0.10f0),
    ygridcolor        = RGBAf(Float32(INK.r), Float32(INK.g), Float32(INK.b), 0.10f0),
    xminorgridvisible = false,
    yminorgridvisible = false,
    limits            = ((-74.017f0, -73.963f0), (40.702f0, 40.760f0)),
)

# Basemap layer 1: simplified Manhattan street grid (~block spacing)
for lat in 40.703:0.0025:40.759
    hlines!(ax, [lat]; color = STREET_COLOR, linewidth = 0.6)
end
for lon in -74.016:0.003:-73.964
    vlines!(ax, [lon]; color = STREET_COLOR, linewidth = 0.6)
end

# Basemap layer 2: water bodies (drawn after streets so they cover the grid at the edges)
# Hudson River (west) and East River (east) as filled rectangles
poly!(ax, Rect2f(-74.017f0, 40.702f0, 0.010f0, 0.058f0); color = WATER_COLOR, strokewidth = 0)
poly!(ax, Rect2f(-73.978f0, 40.702f0, 0.015f0, 0.058f0); color = WATER_COLOR, strokewidth = 0)

# Water body labels
text!(ax, -74.012f0, 40.728f0;
    text = "Hudson\nRiver",
    align = (:center, :center),
    fontsize = 9,
    color = WATER_LABEL,
)
text!(ax, -73.970f0, 40.728f0;
    text = "East\nRiver",
    align = (:center, :center),
    fontsize = 9,
    color = WATER_LABEL,
)

# Individual (unclustered) markers, colored by category
for (i, cat_name) in enumerate(CAT_NAMES)
    idx = filter(j -> cat_ids[j] == i, solo_idx)
    isempty(idx) && continue
    scatter!(ax, lons[idx], lats[idx];
        color       = IMPRINT[i],
        markersize  = 15,
        strokewidth = 1.5,
        strokecolor = PAGE_BG,
        label       = cat_name,
    )
end

# Cluster bubbles: size proportional to point count, colored by dominant category
for (clat, clon, npts, dom_cat) in cluster_rows
    bubble_sz = clamp(npts * 2.8 + 18, 28, 72)
    scatter!(ax, [clon], [clat];
        color       = (IMPRINT[dom_cat], 0.80),
        markersize  = bubble_sz,
        strokewidth = 2.5,
        strokecolor = IMPRINT[dom_cat],
    )
    text!(ax, clon, clat;
        text     = string(npts),
        align    = (:center, :center),
        fontsize = 14,
        color    = colorant"#FFFFFF",
    )
end

# Legend for individual-marker categories
axislegend(ax;
    position        = :rb,
    labelsize       = 12,
    framecolor      = INK_SOFT,
    backgroundcolor = ELEVATED_BG,
    labelcolor      = INK,
    padding         = (10, 10, 10, 10),
)

# Save
save("plot-$(THEME).png", fig; px_per_unit = 2)
Runnable source as JSON, for any HTTP client: https://api.anyplot.ai/specs/map-marker-clustered/makie/code. Any spec id and library id listed in llms-full.txt fit the same URL shape; every URL below is complete and callable.
{
  "spec_id": "map-marker-clustered",
  "language": "julia",
  "library": "makie",
  "page": "https://anyplot.ai/map-marker-clustered/julia/makie",
  "hub": "https://anyplot.ai/map-marker-clustered",
  "code_json": "https://api.anyplot.ai/specs/map-marker-clustered/makie/code",
  "spec_json": "https://api.anyplot.ai/specs/map-marker-clustered",
  "render_light_png": "https://storage.googleapis.com/anyplot-images/plots/map-marker-clustered/julia/makie/plot-light.png",
  "render_dark_png": "https://storage.googleapis.com/anyplot-images/plots/map-marker-clustered/julia/makie/plot-dark.png",
  "quality_score": 87.0,
  "license": "MIT",
  "guide": "https://anyplot.ai/llms.txt"
}
Part of Clustered Marker Map on anyplot.ai.