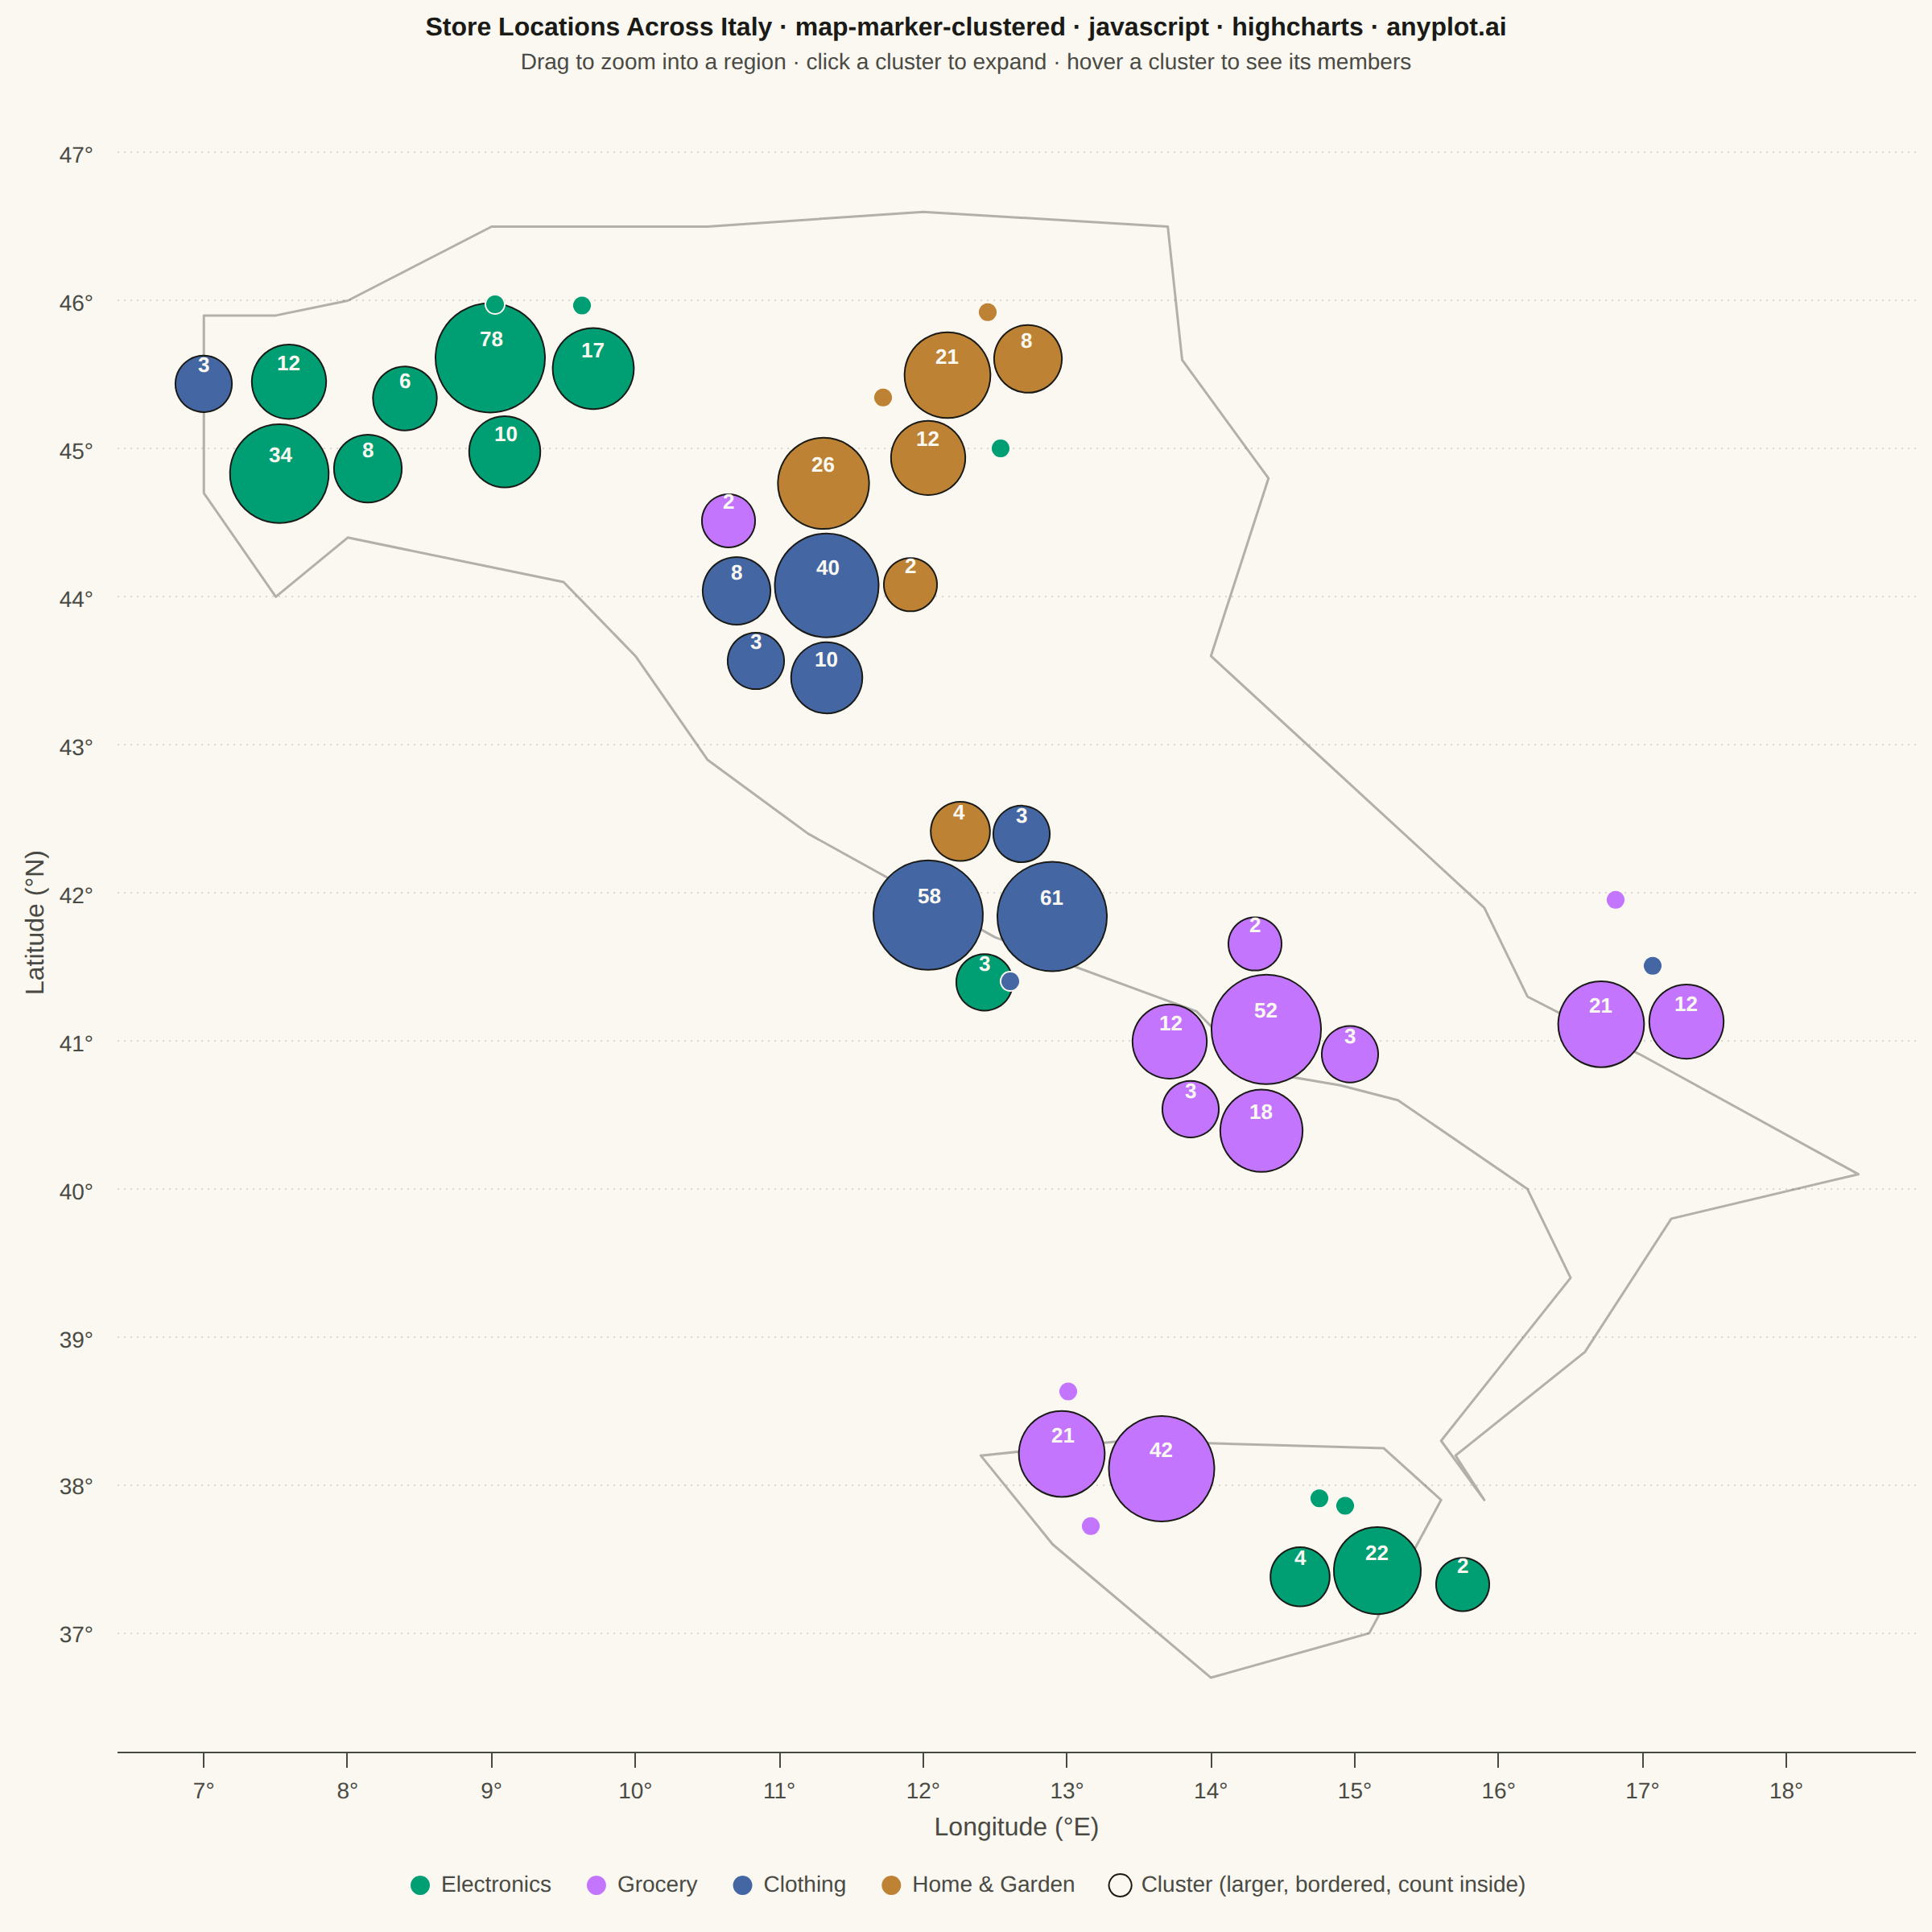
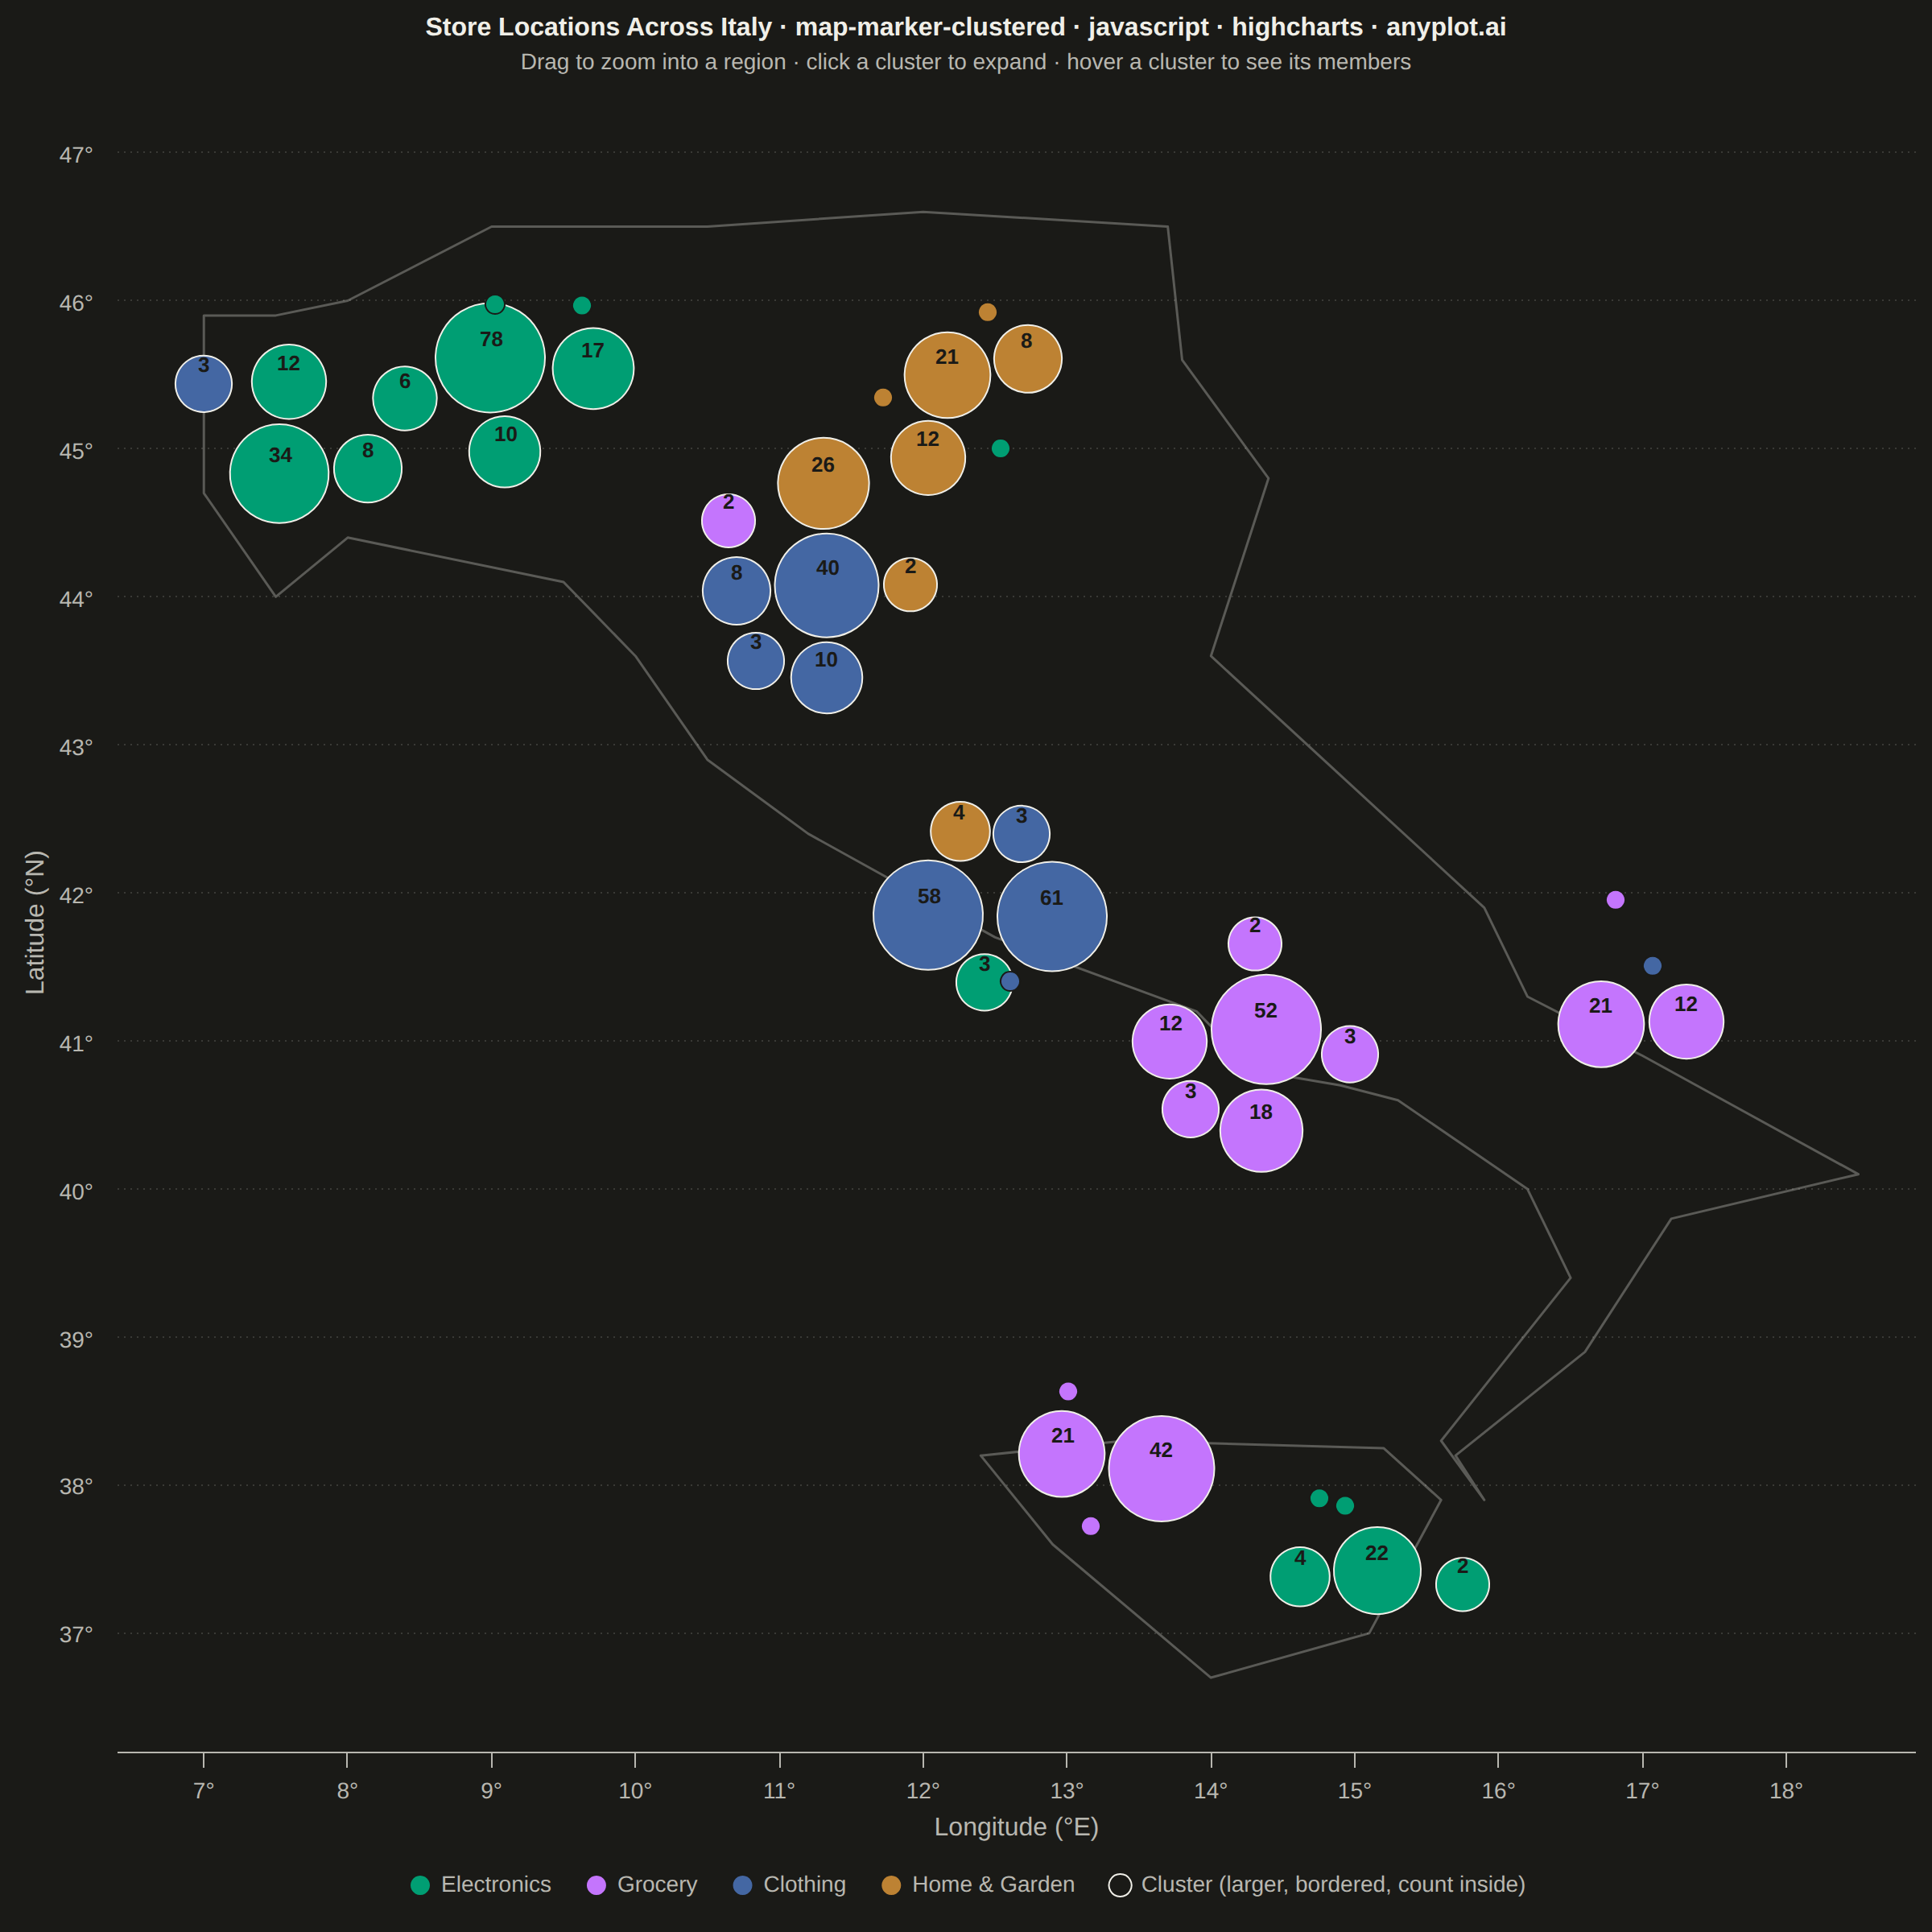
The same plot in 14 other libraries — JavaScript: Chart.js, D3.js, Apache ECharts, MUI X Charts; Python: Altair, Bokeh, lets-plot, Matplotlib, Plotly, plotnine, Pygal, Seaborn; R: ggplot2; Julia: Makie.jl. Compare all 15 side by side: Clustered Marker Map in Python, R, Julia and JavaScript.
A geographic map that dynamically clusters nearby markers based on the current zoom level. At lower zoom levels, clusters aggregate multiple points into a single marker displaying the count, while zooming in progressively expands clusters to reveal individual markers. This visualization is essential for efficiently displaying large geographic datasets without visual clutter, enabling users to see both the overall distribution and specific locations through interactive exploration.
// anyplot.ai
// map-marker-clustered: Clustered Marker Map
// Library: highcharts 12.6.0 | JavaScript 22.23.2
// Quality: 89/100 | Created: 2026-09-02

//# anyplot-orientation: square

const t = window.ANYPLOT_TOKENS;

// --- Data (in-memory, deterministic) ----------------------------------------
// Fixed-seed LCG — the browser has no seeded RNG.
let seed = 42;
function nextRandom() {
  seed = (seed * 1664525 + 1013904223) % 4294967296;
  return seed / 4294967296;
}
function gaussianJitter() {
  const u1 = Math.max(nextRandom(), 1e-9);
  const u2 = nextRandom();
  return Math.sqrt(-2 * Math.log(u1)) * Math.cos(2 * Math.PI * u2);
}

const CATEGORIES = ["Electronics", "Grocery", "Clothing", "Home & Garden"];
const CATEGORY_COLORS = {
  [CATEGORIES[0]]: t.palette[0],
  [CATEGORIES[1]]: t.palette[1],
  [CATEGORIES[2]]: t.palette[2],
  [CATEGORIES[3]]: t.palette[3],
};

// Real Italian city coordinates used as retail-store hotspots.
const CITIES = [
  { name: "Milan", lon: 9.19, lat: 45.46, count: 110, dominant: 0 },
  { name: "Rome", lon: 12.5, lat: 41.9, count: 130, dominant: 2 },
  { name: "Naples", lon: 14.27, lat: 40.85, count: 90, dominant: 1 },
  { name: "Turin", lon: 7.68, lat: 45.07, count: 60, dominant: 0 },
  { name: "Palermo", lon: 13.36, lat: 38.12, count: 65, dominant: 1 },
  { name: "Bologna", lon: 11.34, lat: 44.49, count: 50, dominant: 3 },
  { name: "Florence", lon: 11.26, lat: 43.77, count: 45, dominant: 2 },
  { name: "Venice", lon: 12.32, lat: 45.44, count: 40, dominant: 3 },
  { name: "Bari", lon: 16.87, lat: 41.13, count: 35, dominant: 1 },
  { name: "Catania", lon: 15.09, lat: 37.5, count: 30, dominant: 0 },
];

const stores = [];
CITIES.forEach((city) => {
  for (let i = 0; i < city.count; i++) {
    const category =
      nextRandom() < 0.55 ? CATEGORIES[city.dominant] : CATEGORIES[Math.floor(nextRandom() * CATEGORIES.length)];
    stores.push({
      lon: city.lon + gaussianJitter() * 0.28,
      lat: city.lat + gaussianJitter() * 0.22,
      category,
      label: `${city.name} — ${category}`,
    });
  }
});

// Simplified coastline outlines (basemap context) — [lon, lat] pairs.
const ITALY_MAINLAND = [
  [7.0, 45.9], [7.5, 45.9], [8.0, 46.0], [9.0, 46.5], [10.5, 46.5],
  [12.0, 46.6], [13.7, 46.5], [13.8, 45.6], [14.4, 44.8], [14.0, 43.6],
  [15.9, 41.9], [16.2, 41.3], [17.0, 40.9], [18.5, 40.1], [17.2, 39.8],
  [16.6, 38.9], [15.7, 38.2], [15.9, 37.9], [15.6, 38.3], [16.5, 39.4],
  [16.2, 40.0], [15.3, 40.6], [14.9, 40.7], [14.3, 40.8], [13.9, 41.2],
  [12.5, 41.7], [11.2, 42.4], [10.5, 42.9], [10.0, 43.6], [9.5, 44.1],
  [8.0, 44.4], [7.5, 44.0], [7.0, 44.7], [7.0, 45.9],
];
const ITALY_SICILY = [
  [12.4, 38.2], [13.4, 38.3], [15.2, 38.25], [15.6, 37.9],
  [15.1, 37.0], [14.0, 36.7], [12.9, 37.6], [12.4, 38.2],
];

const LON_MIN = 6.4;
const LON_MAX = 18.9;
const LAT_MIN = 36.2;
const LAT_MAX = 47.4;
const BOUNDARY_COLOR = t.theme === "dark" ? "rgba(240,239,232,0.3)" : "rgba(26,26,23,0.32)";

// --- Zoom-dependent clustering -----------------------------------------------
// Buckets stores into a pixel-space grid sized to the *current* zoom level, so
// re-running this after every pan/zoom naturally expands clusters as the user
// zooms in (each pixel cell then spans fewer degrees).
const CELL_PX = 68;

function computeClusters(chart) {
  const xAxis = chart.xAxis[0];
  const yAxis = chart.yAxis[0];
  const cells = new Map();

  stores.forEach((store) => {
    const px = xAxis.toPixels(store.lon, true);
    const py = yAxis.toPixels(store.lat, true);
    if (px < 0 || px > chart.plotWidth || py < 0 || py > chart.plotHeight) return;
    const key = `${Math.floor(px / CELL_PX)}_${Math.floor(py / CELL_PX)}`;
    if (!cells.has(key)) cells.set(key, []);
    cells.get(key).push(store);
  });

  const points = [];
  cells.forEach((members) => {
    if (members.length === 1) {
      const store = members[0];
      points.push({
        x: store.lon,
        y: store.lat,
        name: store.label,
        marker: { radius: 6, symbol: "circle", fillColor: CATEGORY_COLORS[store.category], lineColor: t.pageBg, lineWidth: 1 },
        custom: { isCluster: false, members },
      });
    } else {
      const lon = members.reduce((sum, m) => sum + m.lon, 0) / members.length;
      const lat = members.reduce((sum, m) => sum + m.lat, 0) / members.length;
      const categoryCounts = {};
      members.forEach((m) => {
        categoryCounts[m.category] = (categoryCounts[m.category] || 0) + 1;
      });
      const dominant = Object.keys(categoryCounts).reduce((a, b) => (categoryCounts[a] >= categoryCounts[b] ? a : b));
      const radius = Math.min(34, 12 + Math.sqrt(members.length) * 3.2);
      points.push({
        x: lon,
        y: lat,
        marker: { radius, symbol: "circle", fillColor: CATEGORY_COLORS[dominant], lineColor: t.ink, lineWidth: 1 },
        dataLabels: {
          enabled: true,
          format: String(members.length),
          style: { color: t.pageBg, fontSize: "13px", fontWeight: "600", textOutline: "none" },
        },
        custom: { isCluster: true, members, count: members.length, categoryCounts },
      });
    }
  });

  // Nudge apart cluster circles that would otherwise touch/overlap at their
  // edges once rendered — clustering only guarantees a shared pixel cell, not
  // a rendered gap between neighboring cells' circles.
  separateClusterCircles(
    points.filter((p) => p.custom.isCluster),
    xAxis,
    yAxis
  );
  return points;
}

function separateClusterCircles(clusterPoints, xAxis, yAxis) {
  const MIN_GAP_PX = 3;
  const nodes = clusterPoints.map((point) => ({
    point,
    px: xAxis.toPixels(point.x, true),
    py: yAxis.toPixels(point.y, true),
    r: point.marker.radius,
  }));

  for (let iter = 0; iter < 4; iter++) {
    let moved = false;
    for (let i = 0; i < nodes.length; i++) {
      for (let j = i + 1; j < nodes.length; j++) {
        const a = nodes[i];
        const b = nodes[j];
        const dx = b.px - a.px;
        const dy = b.py - a.py;
        const dist = Math.sqrt(dx * dx + dy * dy) || 0.01;
        const minDist = a.r + b.r + MIN_GAP_PX;
        if (dist < minDist) {
          const push = (minDist - dist) / 2;
          const ux = dx / dist;
          const uy = dy / dist;
          a.px -= ux * push;
          a.py -= uy * push;
          b.px += ux * push;
          b.py += uy * push;
          moved = true;
        }
      }
    }
    if (!moved) break;
  }

  nodes.forEach((node) => {
    node.point.x = xAxis.toValue(node.px, true);
    node.point.y = yAxis.toValue(node.py, true);
  });
}

function recluster() {
  const chart = this.chart;
  const series = chart.get("stores");
  if (series) series.setData(computeClusters(chart), true, false, false);
}

// --- Hover spider-lines (member locations of a cluster) ---------------------
let spiderLines = [];
function clearSpiderLines() {
  spiderLines.forEach((line) => line.destroy());
  spiderLines = [];
}
function drawSpiderLines(point) {
  const custom = point.custom;
  if (!custom || !custom.isCluster) return;
  const chart = point.series.chart;
  const xAxis = chart.xAxis[0];
  const yAxis = chart.yAxis[0];
  const originX = point.plotX + chart.plotLeft;
  const originY = point.plotY + chart.plotTop;
  // Cap the fan-out so a very large cluster doesn't draw hundreds of lines.
  custom.members.slice(0, 40).forEach((member) => {
    const targetX = xAxis.toPixels(member.lon);
    const targetY = yAxis.toPixels(member.lat);
    spiderLines.push(
      chart.renderer
        .path(["M", originX, originY, "L", targetX, targetY])
        .attr({ stroke: t.inkSoft, "stroke-width": 1, opacity: 0.55, zIndex: 6 })
        .add()
    );
  });
}

// --- Title (fontsize scaled to the ~67-char baseline) ------------------------
const TITLE = "Store Locations Across Italy · map-marker-clustered · javascript · highcharts · anyplot.ai";
const TITLE_FONT_SIZE = `${Math.round(22 * Math.min(1, 67 / TITLE.length))}px`;

// --- Chart -------------------------------------------------------------------
Highcharts.chart("container", {
  chart: {
    type: "scatter",
    backgroundColor: "transparent",
    animation: false,
    zooming: { type: "xy" },
    style: { fontFamily: "inherit" },
    events: {
      load: function () {
        this.get("stores").setData(computeClusters(this), true, false, false);
      },
    },
  },
  credits: { enabled: false },
  colors: t.palette,
  title: { text: TITLE, style: { color: t.ink, fontSize: TITLE_FONT_SIZE, fontWeight: "600" } },
  subtitle: {
    text: "Drag to zoom into a region · click a cluster to expand · hover a cluster to see its members",
    style: { color: t.inkSoft, fontSize: "14px" },
  },
  xAxis: {
    min: LON_MIN,
    max: LON_MAX,
    startOnTick: false,
    endOnTick: false,
    title: { text: "Longitude (°E)", style: { color: t.inkSoft, fontSize: "16px" } },
    labels: { style: { color: t.inkSoft, fontSize: "14px" }, format: "{value}°" },
    lineColor: t.inkSoft,
    tickColor: t.inkSoft,
    gridLineColor: t.grid,
    gridLineDashStyle: "Dot",
    events: { afterSetExtremes: recluster },
  },
  yAxis: {
    min: LAT_MIN,
    max: LAT_MAX,
    startOnTick: false,
    endOnTick: false,
    title: { text: "Latitude (°N)", style: { color: t.inkSoft, fontSize: "16px" } },
    labels: { style: { color: t.inkSoft, fontSize: "14px" }, format: "{value}°" },
    lineColor: t.inkSoft,
    tickColor: t.inkSoft,
    gridLineColor: t.grid,
    gridLineDashStyle: "Dot",
    events: { afterSetExtremes: recluster },
  },
  legend: {
    itemStyle: { color: t.inkSoft, fontSize: "14px" },
    itemHoverStyle: { color: t.ink },
  },
  tooltip: {
    backgroundColor: t.elevatedBg,
    borderColor: t.grid,
    style: { color: t.ink, fontSize: "13px" },
    formatter: function () {
      const custom = this.point.custom;
      if (custom && custom.isCluster) {
        const breakdown = Object.entries(custom.categoryCounts)
          .map(([category, count]) => `${category}: ${count}`)
          .join("<br>");
        return `<b>${custom.count} stores</b><br>${breakdown}`;
      }
      return `<b>${this.point.name}</b>`;
    },
  },
  plotOptions: {
    series: { animation: false },
  },
  series: [
    {
      type: "line",
      name: "Coastline",
      data: ITALY_MAINLAND,
      color: BOUNDARY_COLOR,
      lineWidth: 1.5,
      marker: { enabled: false },
      enableMouseTracking: false,
      showInLegend: false,
      zIndex: 0,
    },
    {
      type: "line",
      name: "Coastline (Sicily)",
      data: ITALY_SICILY,
      color: BOUNDARY_COLOR,
      lineWidth: 1.5,
      marker: { enabled: false },
      enableMouseTracking: false,
      showInLegend: false,
      zIndex: 0,
    },
    {
      type: "scatter",
      id: "stores",
      name: "Stores",
      data: [],
      cursor: "pointer",
      showInLegend: false,
      zIndex: 1,
      states: { hover: { halo: { size: 6 } } },
      point: {
        events: {
          click: function () {
            const custom = this.custom;
            if (!custom || !custom.isCluster) return;
            const chart = this.series.chart;
            const lons = custom.members.map((m) => m.lon);
            const lats = custom.members.map((m) => m.lat);
            const lonPad = Math.max((Math.max(...lons) - Math.min(...lons)) * 0.4, 0.15);
            const latPad = Math.max((Math.max(...lats) - Math.min(...lats)) * 0.4, 0.15);
            chart.xAxis[0].setExtremes(Math.min(...lons) - lonPad, Math.max(...lons) + lonPad);
            chart.yAxis[0].setExtremes(Math.min(...lats) - latPad, Math.max(...lats) + latPad);
          },
          mouseOver: function () {
            drawSpiderLines(this);
          },
          mouseOut: clearSpiderLines,
        },
      },
    },
    ...CATEGORIES.map((category, i) => ({
      type: "scatter",
      name: category,
      color: t.palette[i],
      data: [],
      enableMouseTracking: false,
      marker: { symbol: "circle", radius: 6 },
      showInLegend: true,
      zIndex: 1,
    })),
    {
      type: "scatter",
      name: "Cluster (larger, bordered, count inside)",
      data: [],
      enableMouseTracking: false,
      marker: { symbol: "circle", radius: 9, fillColor: t.pageBg, lineColor: t.ink, lineWidth: 1 },
      showInLegend: true,
      zIndex: 1,
    },
  ],
});
Runnable source as JSON, for any HTTP client: https://api.anyplot.ai/specs/map-marker-clustered/highcharts/code. Any spec id and library id listed in llms-full.txt fit the same URL shape; every URL below is complete and callable.
{
  "spec_id": "map-marker-clustered",
  "language": "javascript",
  "library": "highcharts",
  "page": "https://anyplot.ai/map-marker-clustered/javascript/highcharts",
  "hub": "https://anyplot.ai/map-marker-clustered",
  "code_json": "https://api.anyplot.ai/specs/map-marker-clustered/highcharts/code",
  "spec_json": "https://api.anyplot.ai/specs/map-marker-clustered",
  "render_light_png": "https://storage.googleapis.com/anyplot-images/plots/map-marker-clustered/javascript/highcharts/plot-light.png",
  "render_dark_png": "https://storage.googleapis.com/anyplot-images/plots/map-marker-clustered/javascript/highcharts/plot-dark.png",
  "interactive_light_html": "https://storage.googleapis.com/anyplot-images/plots/map-marker-clustered/javascript/highcharts/plot-light.html",
  "interactive_dark_html": "https://storage.googleapis.com/anyplot-images/plots/map-marker-clustered/javascript/highcharts/plot-dark.html",
  "quality_score": 89.0,
  "license": "MIT",
  "guide": "https://anyplot.ai/llms.txt"
}
Part of Clustered Marker Map on anyplot.ai.