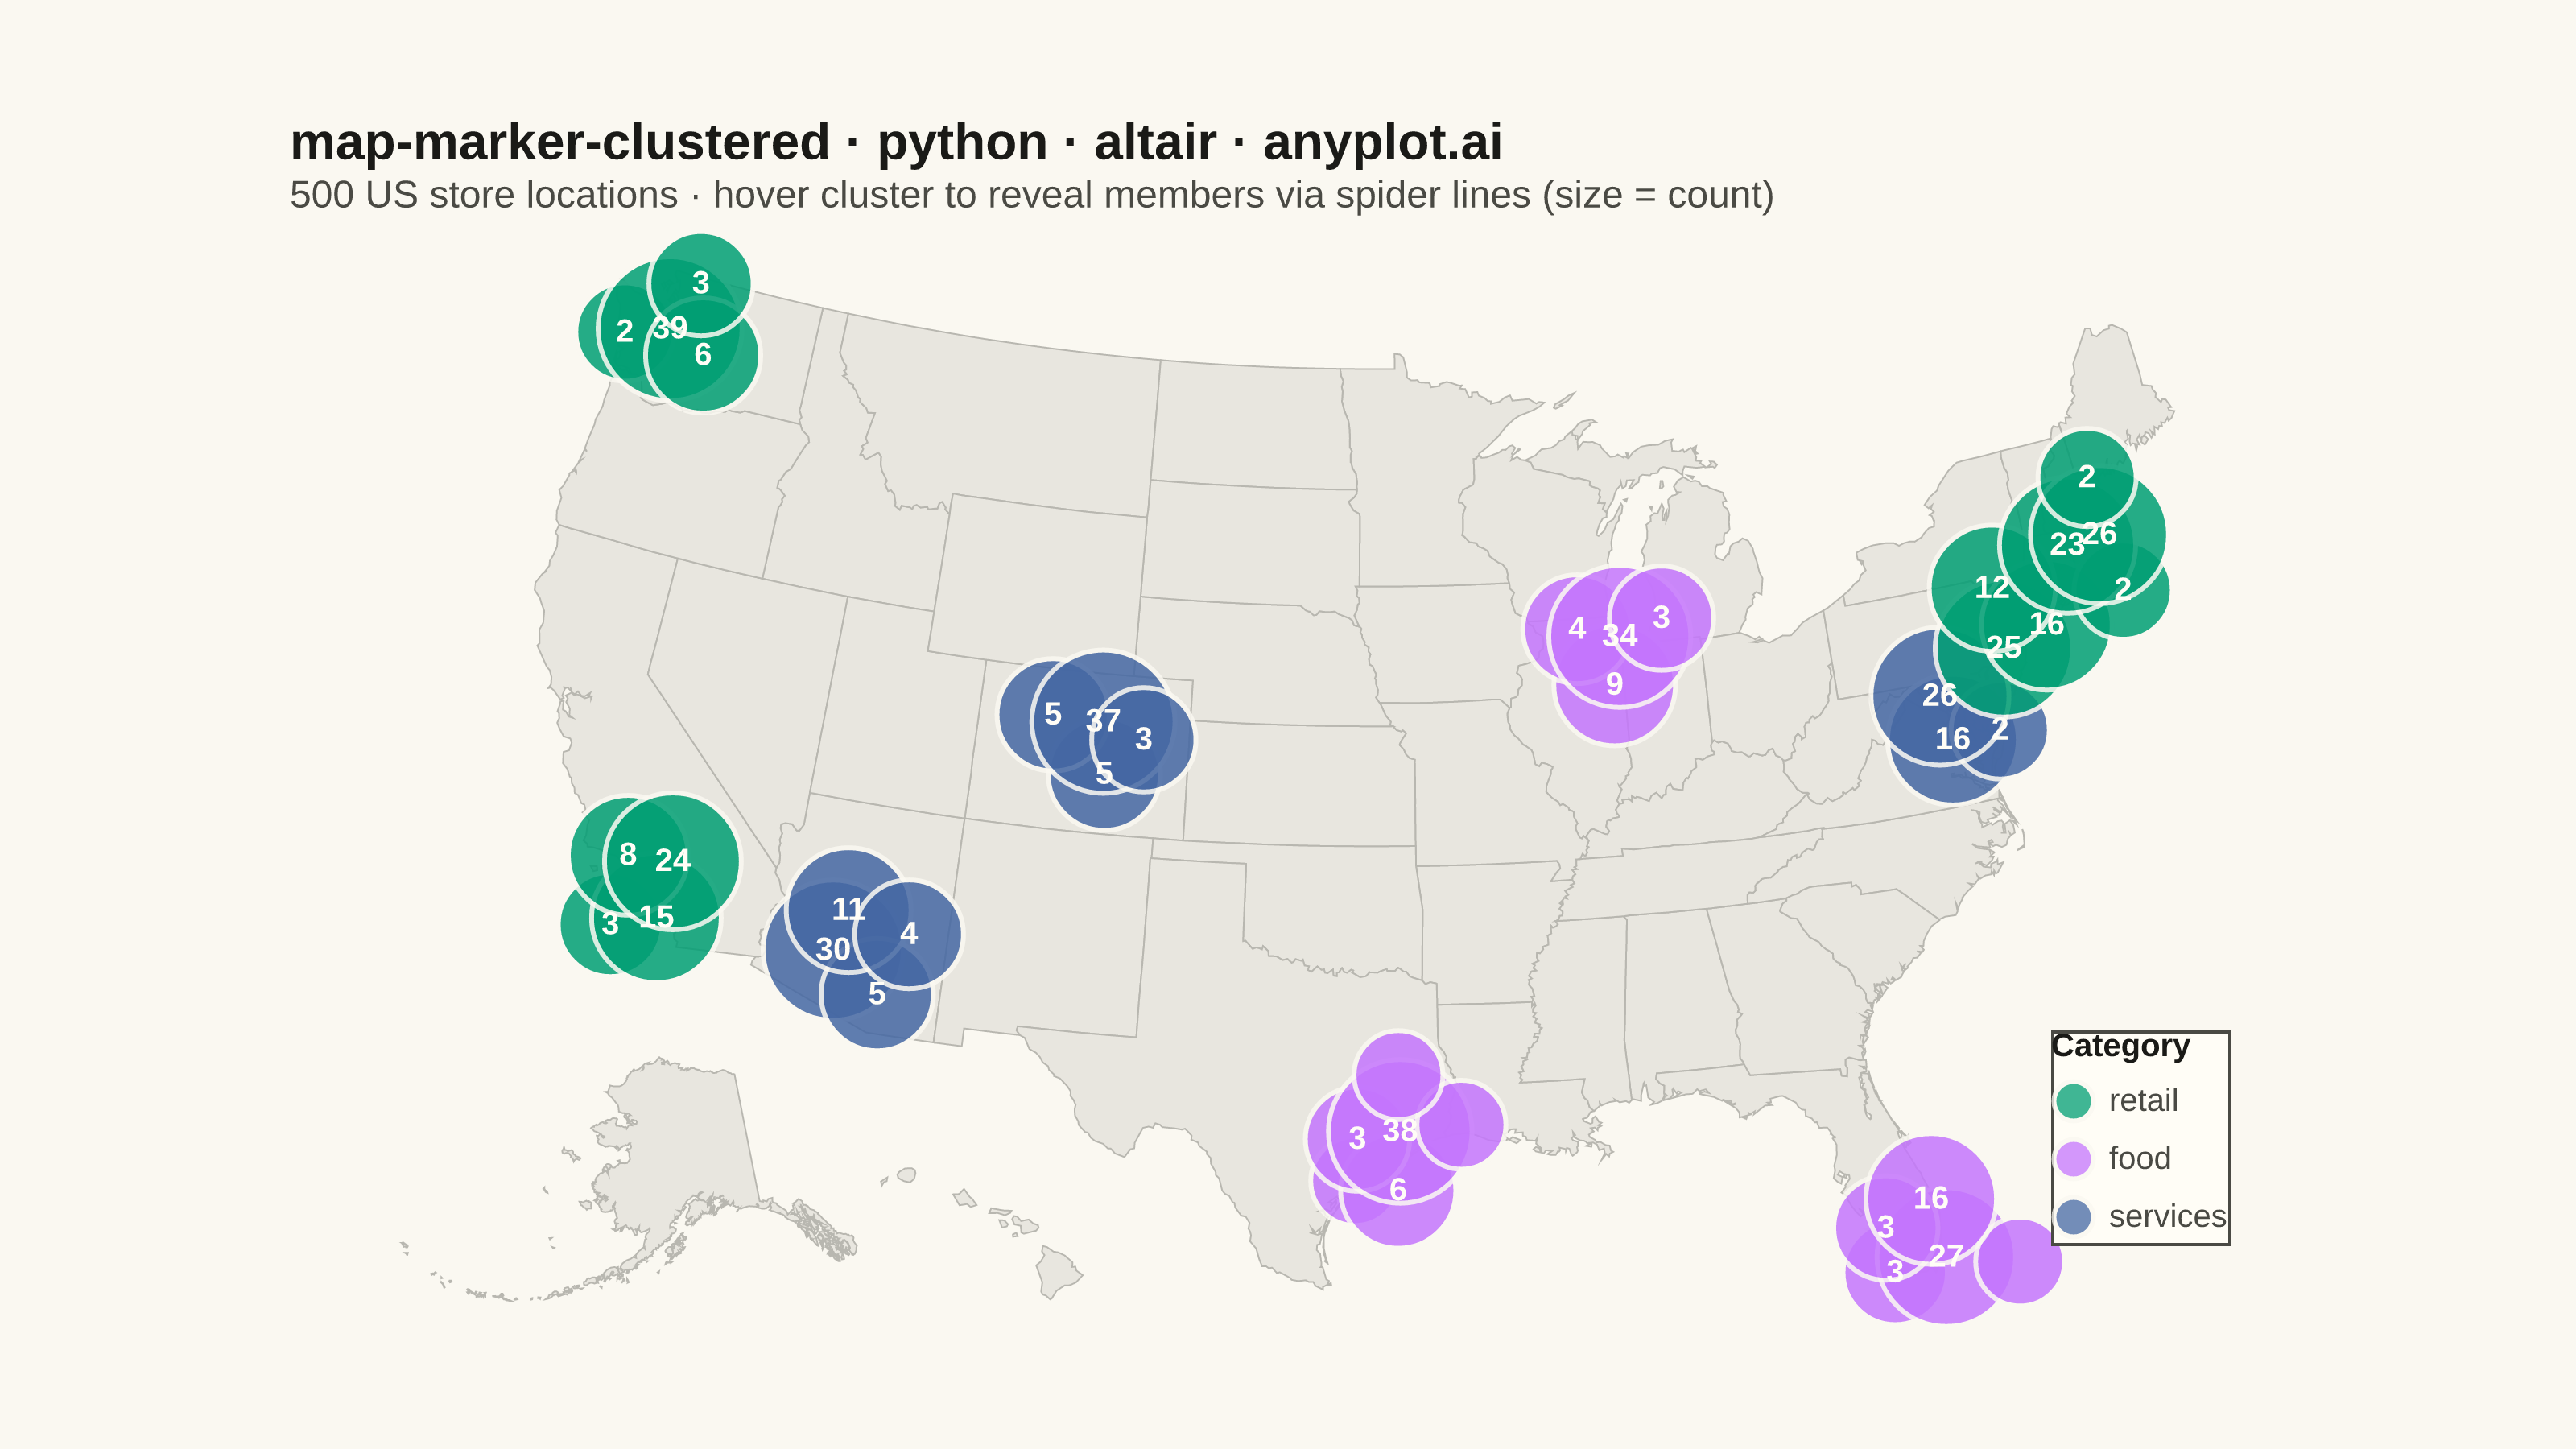
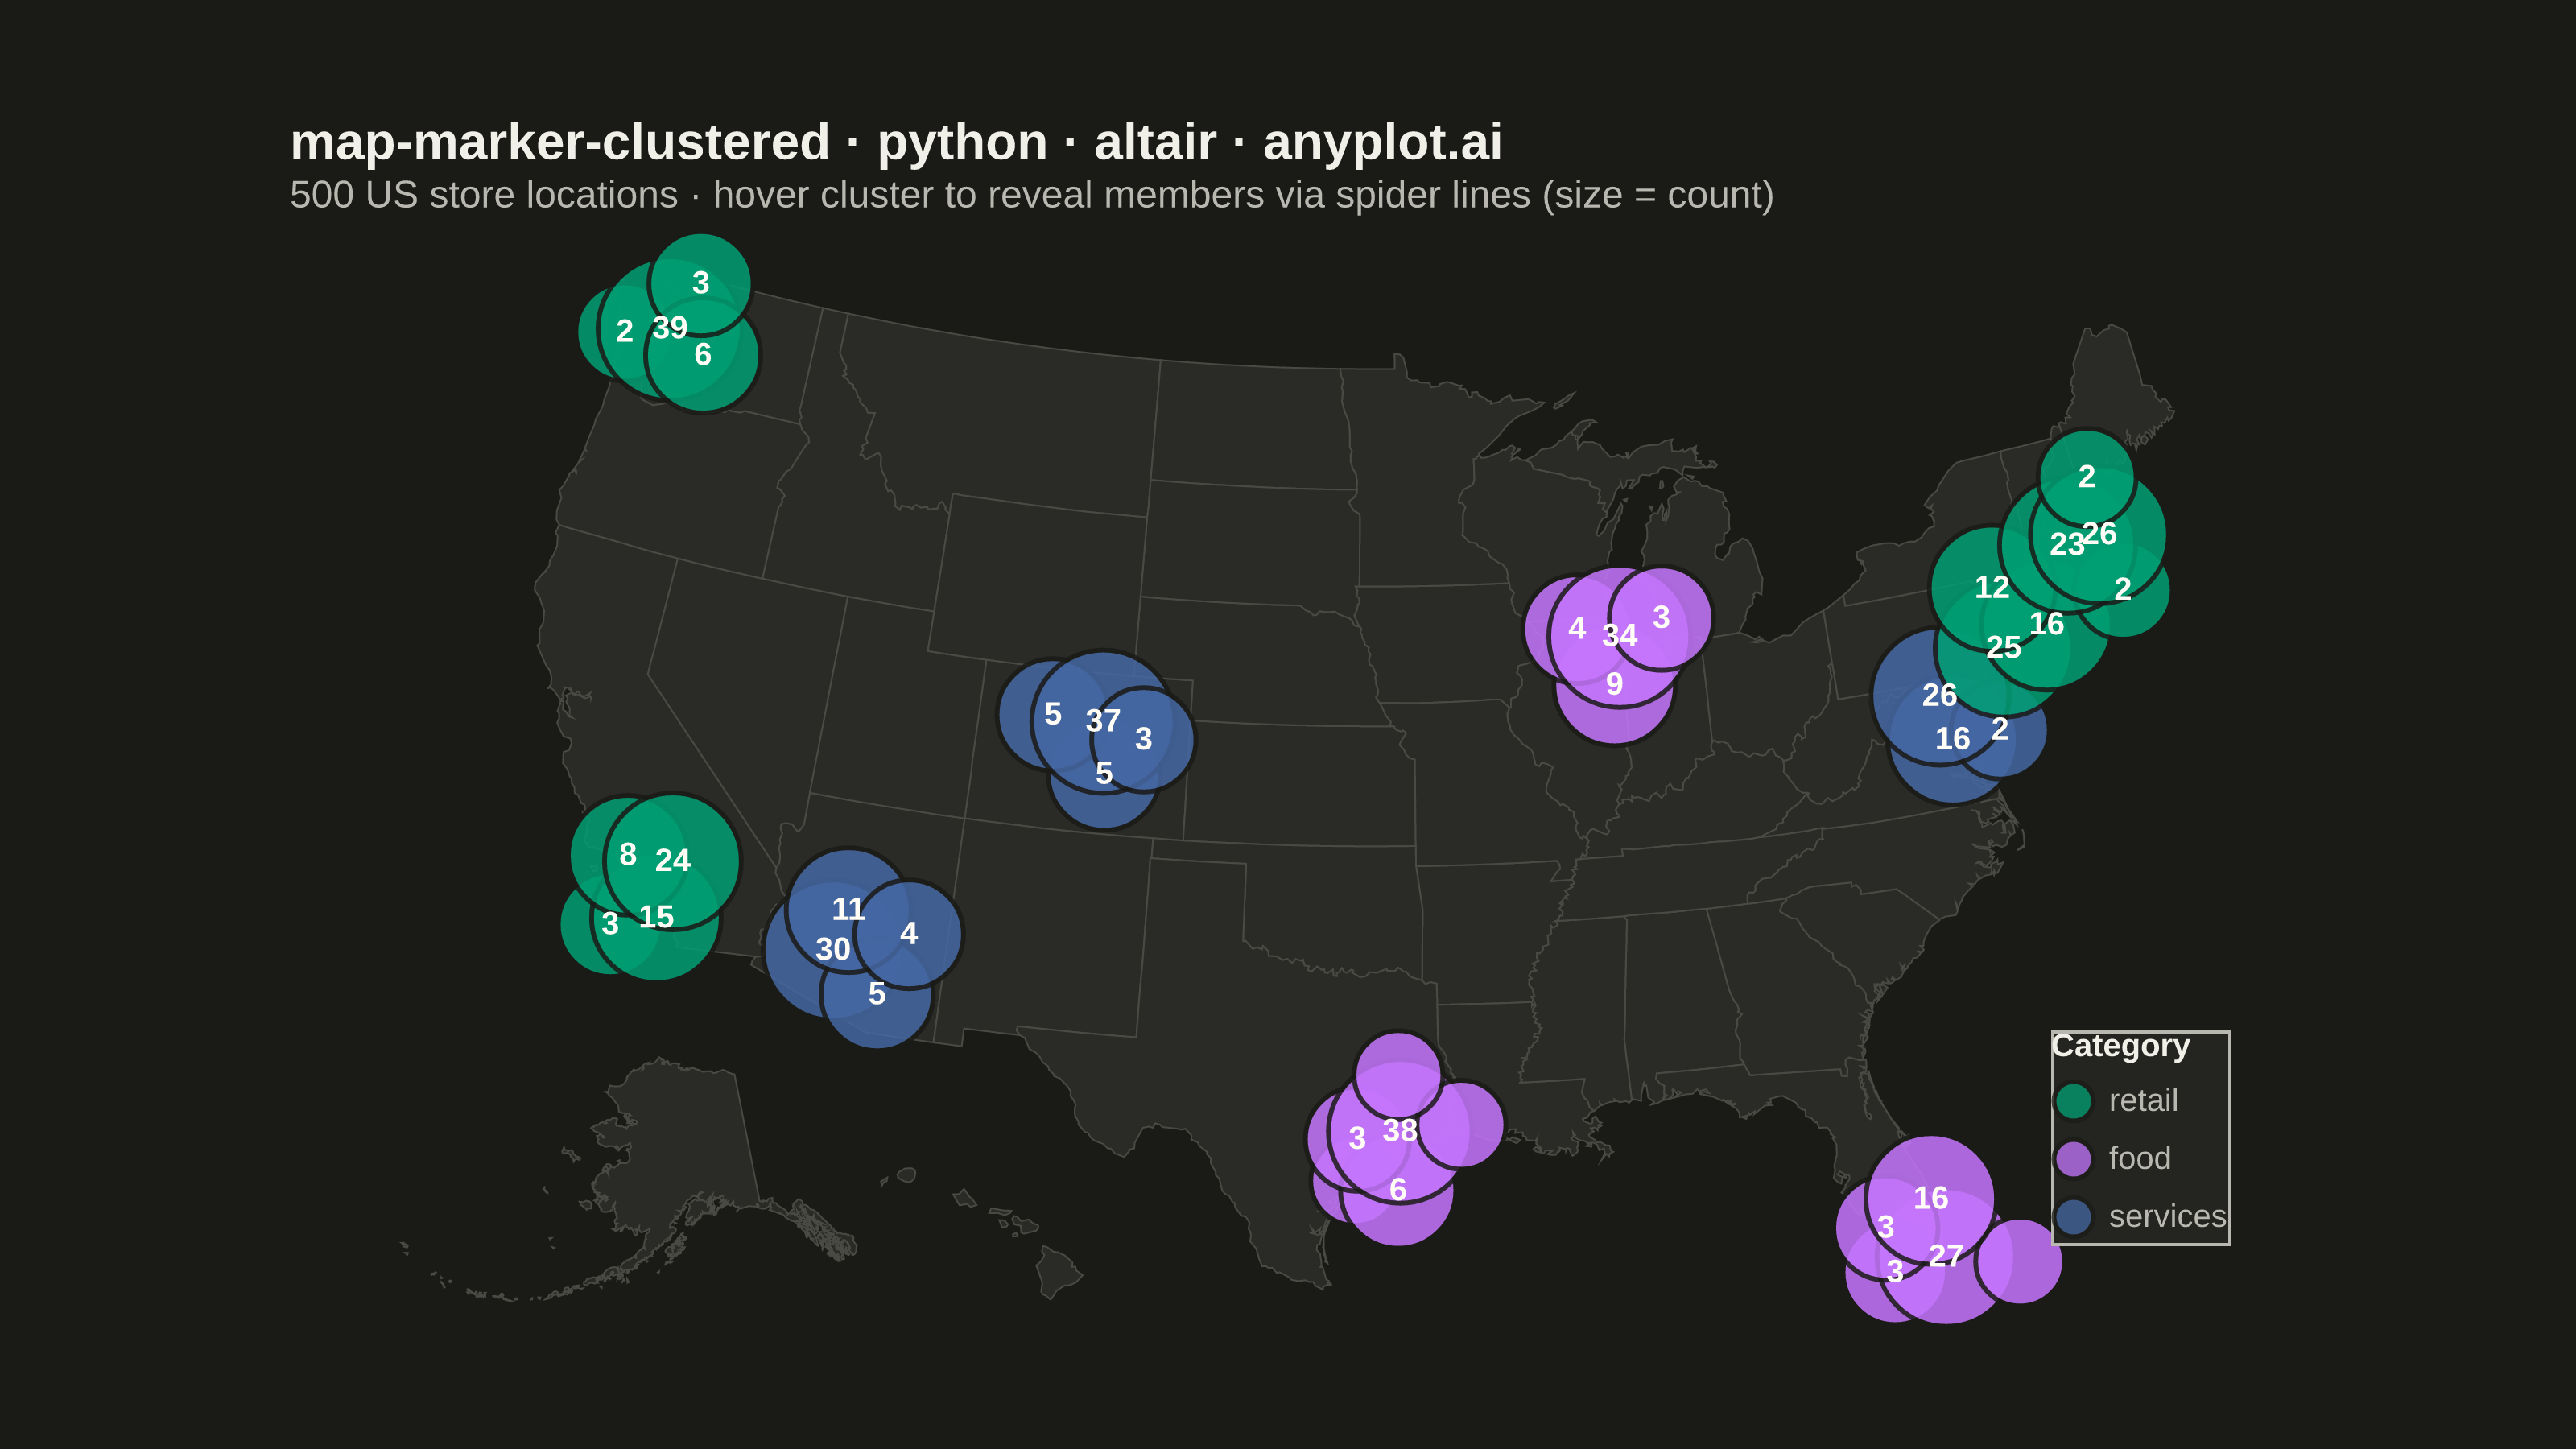
A geographic map that dynamically clusters nearby markers based on the current zoom level. At lower zoom levels, clusters aggregate multiple points into a single marker displaying the count, while zooming in progressively expands clusters to reveal individual markers. This visualization is essential for efficiently displaying large geographic datasets without visual clutter, enabling users to see both the overall distribution and specific locations through interactive exploration.
""" anyplot.ai
map-marker-clustered: Clustered Marker Map
Library: altair 6.1.0 | Python 3.13.13
Quality: 86/100 | Updated: 2026-05-23
"""

import os
import sys


# Remove this script's own directory from sys.path to avoid shadowing the installed altair package
sys.path = [p for p in sys.path if p not in ("", os.path.dirname(os.path.abspath(__file__)))]

import altair as alt
import numpy as np
import pandas as pd
from PIL import Image


# Theme tokens
THEME = os.getenv("ANYPLOT_THEME", "light")
PAGE_BG = "#FAF8F1" if THEME == "light" else "#1A1A17"
ELEVATED_BG = "#FFFDF6" if THEME == "light" else "#242420"
INK = "#1A1A17" if THEME == "light" else "#F0EFE8"
INK_SOFT = "#4A4A44" if THEME == "light" else "#B8B7B0"
MAP_FILL = "#E8E6DF" if THEME == "light" else "#2A2A27"
MAP_STROKE = "#B8B7B0" if THEME == "light" else "#4A4A44"

IMPRINT = ["#009E73", "#C475FD", "#4467A3", "#BD8233", "#AE3030", "#2ABCCD", "#954477"]  # imprint canonical slot order

# Data — store locations across the United States
np.random.seed(42)

cities = [
    (40.7128, -74.0060, "New York", "retail"),
    (34.0522, -118.2437, "Los Angeles", "retail"),
    (41.8781, -87.6298, "Chicago", "food"),
    (29.7604, -95.3698, "Houston", "food"),
    (33.4484, -112.0740, "Phoenix", "services"),
    (39.7392, -104.9903, "Denver", "services"),
    (47.6062, -122.3321, "Seattle", "retail"),
    (25.7617, -80.1918, "Miami", "food"),
    (42.3601, -71.0589, "Boston", "retail"),
    (38.9072, -77.0369, "Washington DC", "services"),
]

n_points = 500
lats, lons, store_labels, cats = [], [], [], []
for i in range(n_points):
    city = cities[i % len(cities)]
    # Tighter noise (std=0.8) + clamp to CONUS bounds keeps all points within the US basemap
    lats.append(float(np.clip(city[0] + np.random.normal(0, 0.8), 24.0, 49.0)))
    lons.append(float(np.clip(city[1] + np.random.normal(0, 0.8), -125.0, -66.0)))
    store_labels.append(f"Store {i + 1}")
    cats.append(city[3])

df = pd.DataFrame({"lat": lats, "lon": lons, "label": store_labels, "category": cats})

# Grid-based clustering — no external geo-dependencies
grid_size = 2.5  # degrees
df["lat_bin"] = (df["lat"] / grid_size).round() * grid_size
df["lon_bin"] = (df["lon"] / grid_size).round() * grid_size

cluster_summary = (
    df.groupby(["lat_bin", "lon_bin"])
    .agg(
        lat=("lat", "mean"),
        lon=("lon", "mean"),
        count=("label", "count"),
        dominant_category=("category", lambda x: x.mode().iloc[0]),
    )
    .reset_index()
)
cluster_summary["marker_size"] = np.log1p(cluster_summary["count"]) * 150 + 100

# Spider-line data: for each individual point, one segment to its cluster centroid
# Used in HTML to reveal member locations on cluster hover
cluster_centers = cluster_summary[["lat_bin", "lon_bin", "lat", "lon"]].rename(columns={"lat": "clat", "lon": "clon"})
df_linked = df.merge(cluster_centers, on=["lat_bin", "lon_bin"])

lines_rows = []
for idx, row in df_linked.iterrows():
    link_id = f"lk{idx}"
    lines_rows.append(
        {
            "lon": row["clon"],
            "lat": row["clat"],
            "lat_bin": row["lat_bin"],
            "lon_bin": row["lon_bin"],
            "link_id": link_id,
        }
    )
    lines_rows.append(
        {"lon": row["lon"], "lat": row["lat"], "lat_bin": row["lat_bin"], "lon_bin": row["lon_bin"], "link_id": link_id}
    )

df_lines = pd.DataFrame(lines_rows)

# US states basemap (Vega CDN)
us_10m_url = "https://cdn.jsdelivr.net/npm/vega-datasets@2/data/us-10m.json"
states = alt.topo_feature(us_10m_url, "states")

background = (
    alt.Chart(states)
    .mark_geoshape(fill=MAP_FILL, stroke=MAP_STROKE, strokeWidth=0.5)
    .project(type="albersUsa")
    .properties(width=620, height=320)
)

category_colors = alt.Scale(
    domain=["retail", "food", "services"], range=[IMPRINT[0], IMPRINT[1], IMPRINT[2]]
)

# Hover selection on cluster circles — gates spider lines and member-point reveal
cluster_hover = alt.selection_point(fields=["lat_bin", "lon_bin"], on="mouseover", empty=False)

# Spider lines from cluster centroid to each member point (HTML interactive layer)
spider_lines = (
    alt.Chart(df_lines)
    .mark_line(strokeWidth=0.8, opacity=0.5, color=INK_SOFT)
    .encode(longitude="lon:Q", latitude="lat:Q", detail="link_id:N")
    .transform_filter(cluster_hover)
    .project(type="albersUsa")
)

# Individual member points revealed when their parent cluster is hovered
hover_points = (
    alt.Chart(df_linked)
    .mark_circle(size=25, opacity=0.75, stroke=PAGE_BG, strokeWidth=0.5)
    .encode(
        longitude="lon:Q",
        latitude="lat:Q",
        color=alt.Color("category:N", scale=category_colors),
        tooltip=[
            alt.Tooltip("label:N", title="Store"),
            alt.Tooltip("category:N", title="Type"),
            alt.Tooltip("lat:Q", title="Lat", format=".3f"),
            alt.Tooltip("lon:Q", title="Lon", format=".3f"),
        ],
    )
    .transform_filter(cluster_hover)
    .project(type="albersUsa")
)

clusters = (
    alt.Chart(cluster_summary)
    .mark_circle(opacity=0.85, stroke=PAGE_BG, strokeWidth=1.5)
    .encode(
        longitude="lon:Q",
        latitude="lat:Q",
        size=alt.Size("marker_size:Q", scale=alt.Scale(range=[200, 2000]), legend=None),
        color=alt.Color("dominant_category:N", scale=category_colors, title="Category"),
        tooltip=[
            alt.Tooltip("count:Q", title="Locations"),
            alt.Tooltip("dominant_category:N", title="Type"),
            alt.Tooltip("lat:Q", title="Latitude", format=".2f"),
            alt.Tooltip("lon:Q", title="Longitude", format=".2f"),
        ],
    )
    .add_params(cluster_hover)
    .project(type="albersUsa")
)

# Count labels — near-white text is readable on all Imprint palette marker colors
count_labels = (
    alt.Chart(cluster_summary[cluster_summary["count"] > 1])
    .mark_text(fontSize=10, fontWeight="bold", color="#FFFDF6")
    .encode(longitude="lon:Q", latitude="lat:Q", text="count:Q")
    .project(type="albersUsa")
)

TITLE = "map-marker-clustered · python · altair · anyplot.ai"

chart = (
    (background + spider_lines + hover_points + clusters + count_labels)
    .properties(
        background=PAGE_BG,
        title=alt.Title(
            text=TITLE,
            subtitle="500 US store locations · hover cluster to reveal members via spider lines (size = count)",
            fontSize=16,
            subtitleFontSize=12,
            color=INK,
            subtitleColor=INK_SOFT,
            anchor="start",
        ),
    )
    .configure_view(strokeWidth=0, fill=PAGE_BG)
    .configure_legend(
        fillColor=ELEVATED_BG,
        strokeColor=INK_SOFT,
        labelColor=INK_SOFT,
        titleColor=INK,
        labelFontSize=10,
        titleFontSize=10,
        symbolSize=150,
        orient="bottom-right",
    )
)

# Save PNG then pad to exact 3200×1800 target
chart.save(f"plot-{THEME}.png", scale_factor=4.0)

TW, TH = 3200, 1800
_img = Image.open(f"plot-{THEME}.png").convert("RGB")
_w, _h = _img.size
if _w > TW or _h > TH:
    raise SystemExit(
        f"altair vl-convert produced {_w}×{_h}, exceeds target {TW}×{TH}. "
        "Shrink chart .properties(width=, height=) values and re-render."
    )
if _w < TW or _h < TH:
    _canvas = Image.new("RGB", (TW, TH), PAGE_BG)
    _canvas.paste(_img, ((TW - _w) // 2, (TH - _h) // 2))
    _canvas.save(f"plot-{THEME}.png")

# Save HTML — interactive: hover cluster circles to reveal spider lines + member points
chart.save(f"plot-{THEME}.html")
Runnable source as JSON, for any HTTP client: https://api.anyplot.ai/specs/map-marker-clustered/altair/code. Any spec id and library id listed in llms-full.txt fit the same URL shape; every URL below is complete and callable.
{
  "spec_id": "map-marker-clustered",
  "language": "python",
  "library": "altair",
  "page": "https://anyplot.ai/map-marker-clustered/python/altair",
  "hub": "https://anyplot.ai/map-marker-clustered",
  "code_json": "https://api.anyplot.ai/specs/map-marker-clustered/altair/code",
  "spec_json": "https://api.anyplot.ai/specs/map-marker-clustered",
  "render_light_png": "https://storage.googleapis.com/anyplot-images/plots/map-marker-clustered/python/altair/plot-light.png",
  "render_dark_png": "https://storage.googleapis.com/anyplot-images/plots/map-marker-clustered/python/altair/plot-dark.png",
  "interactive_light_html": "https://storage.googleapis.com/anyplot-images/plots/map-marker-clustered/python/altair/plot-light.html",
  "interactive_dark_html": "https://storage.googleapis.com/anyplot-images/plots/map-marker-clustered/python/altair/plot-dark.html",
  "quality_score": 86.0,
  "license": "MIT",
  "guide": "https://anyplot.ai/llms.txt"
}
Part of Clustered Marker Map on anyplot.ai.