The same plot in 14 other libraries — JavaScript: Chart.js, D3.js, Apache ECharts, Highcharts; Python: Altair, Bokeh, lets-plot, Matplotlib, Plotly, plotnine, Pygal, Seaborn; R: ggplot2; Julia: Makie.jl. Compare all 15 side by side: Clustered Marker Map in Python, R, Julia and JavaScript.
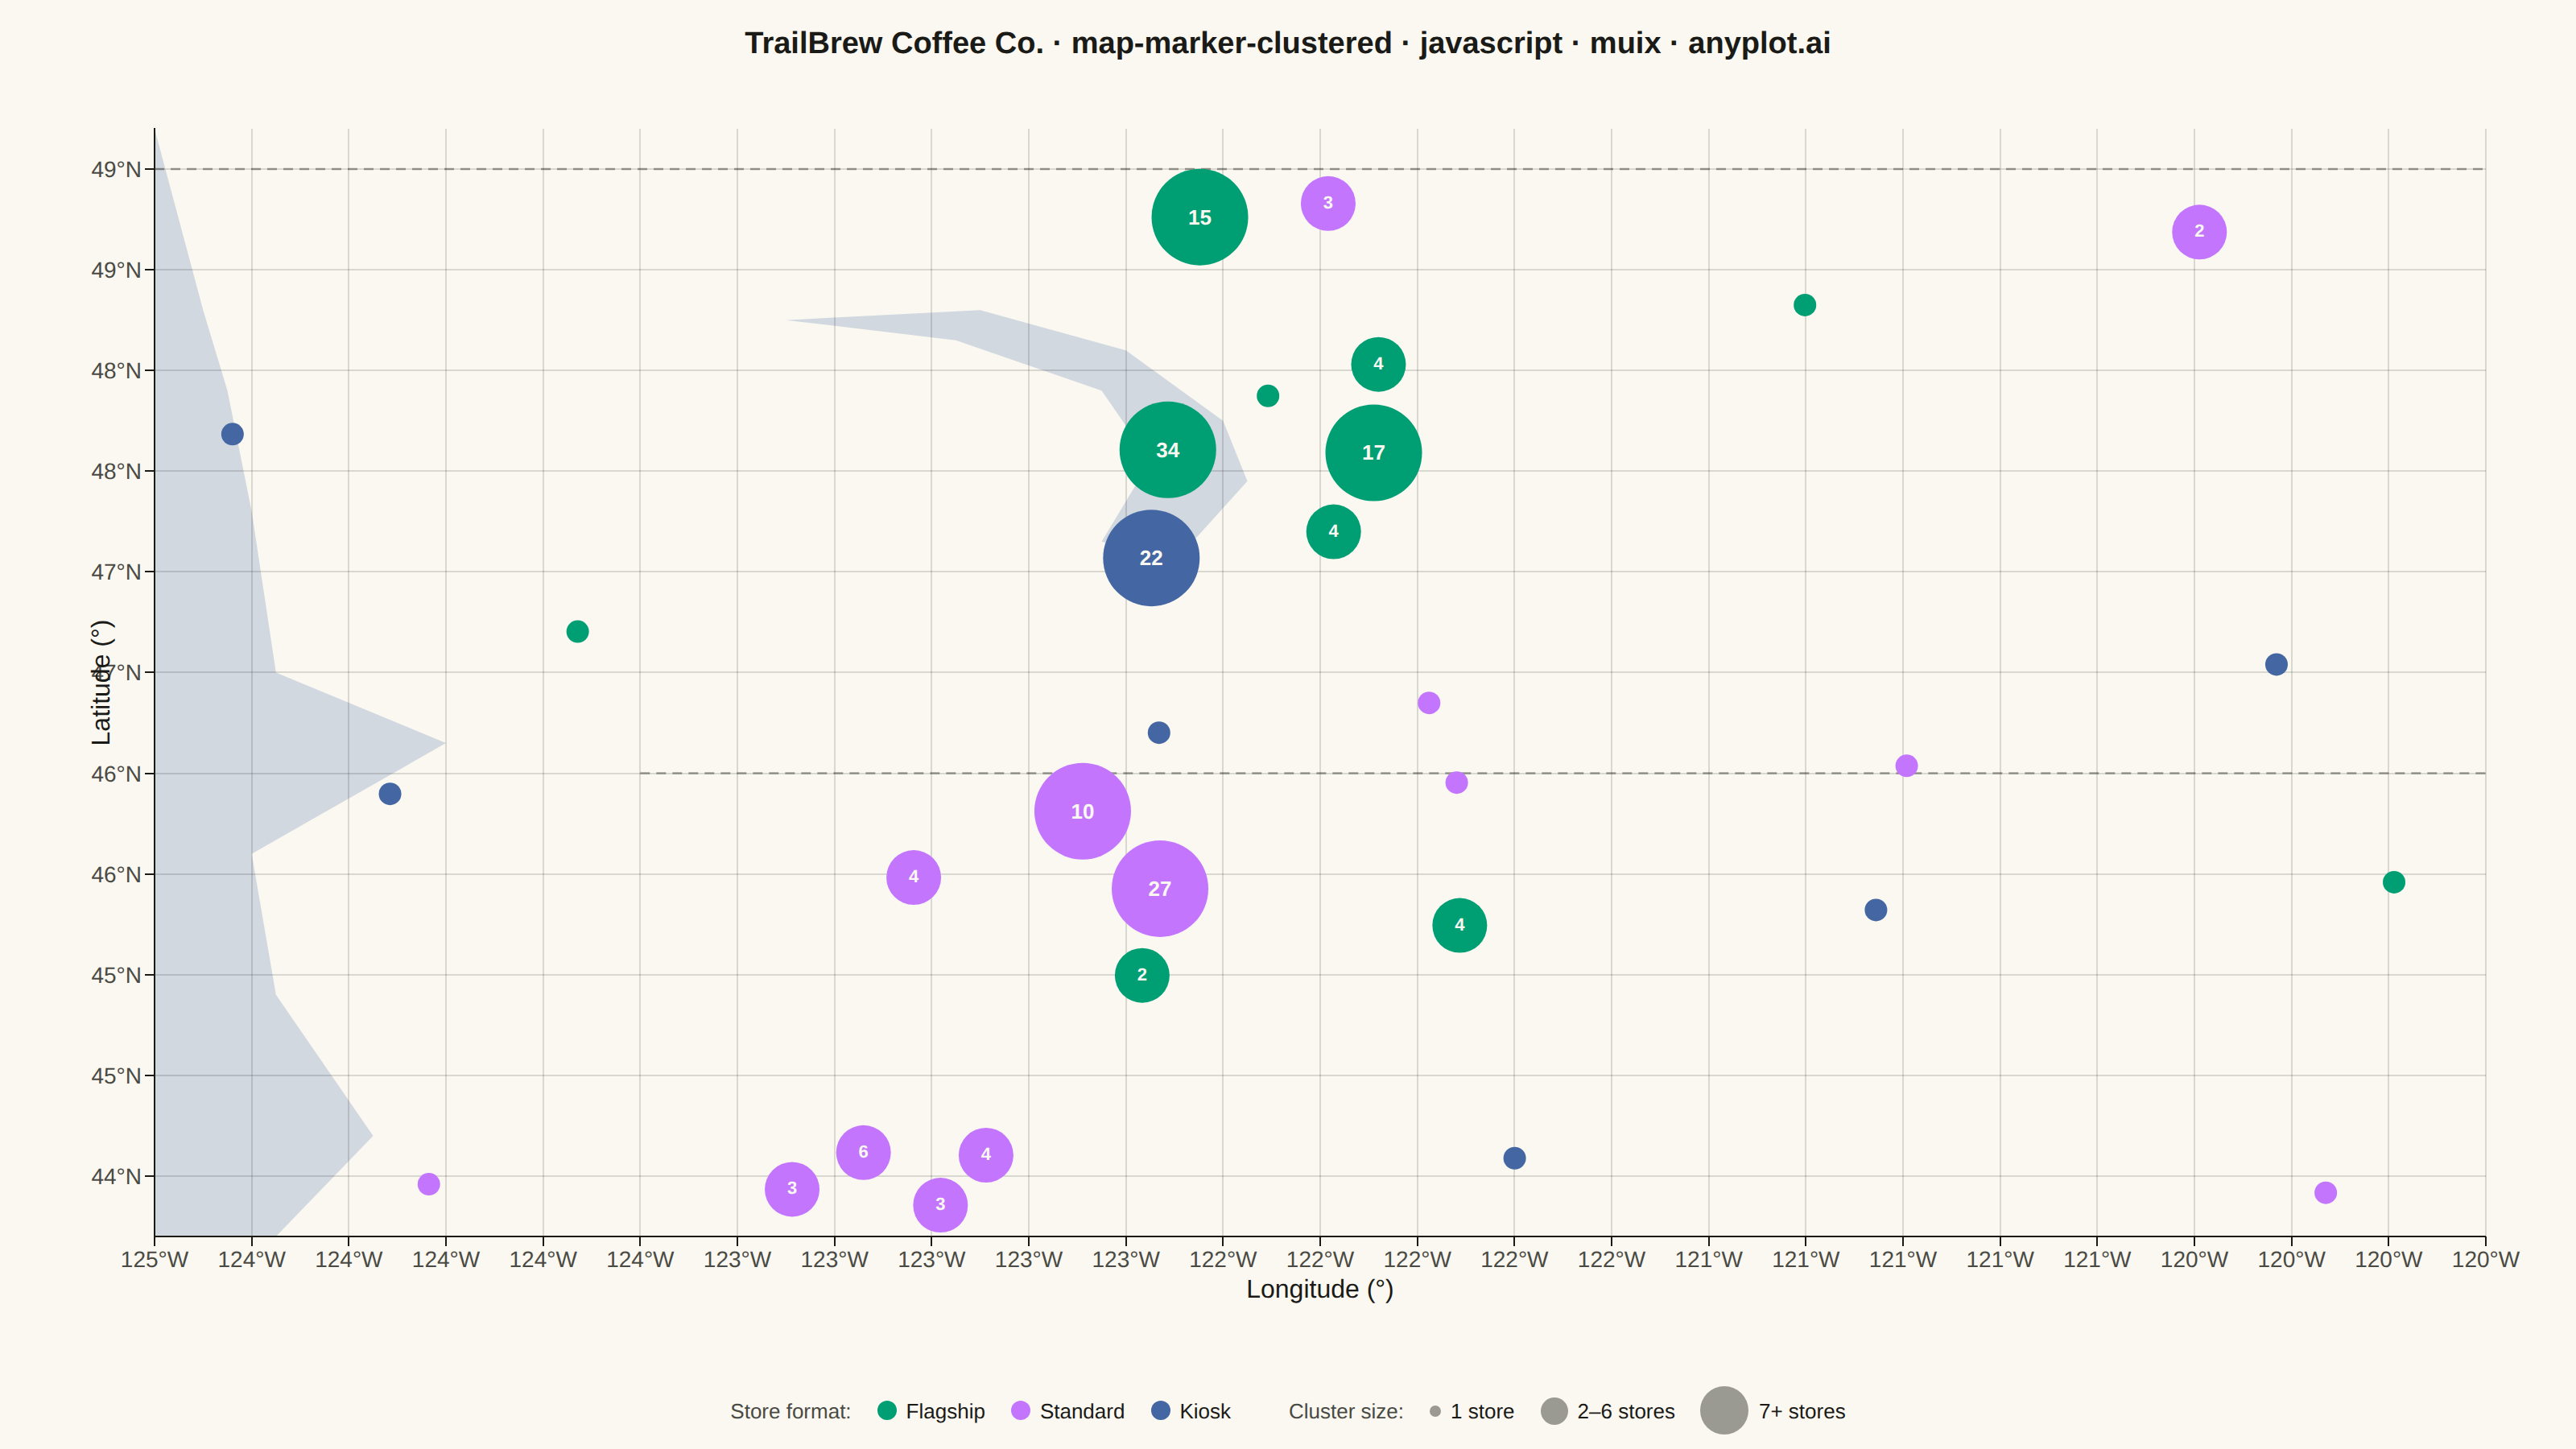
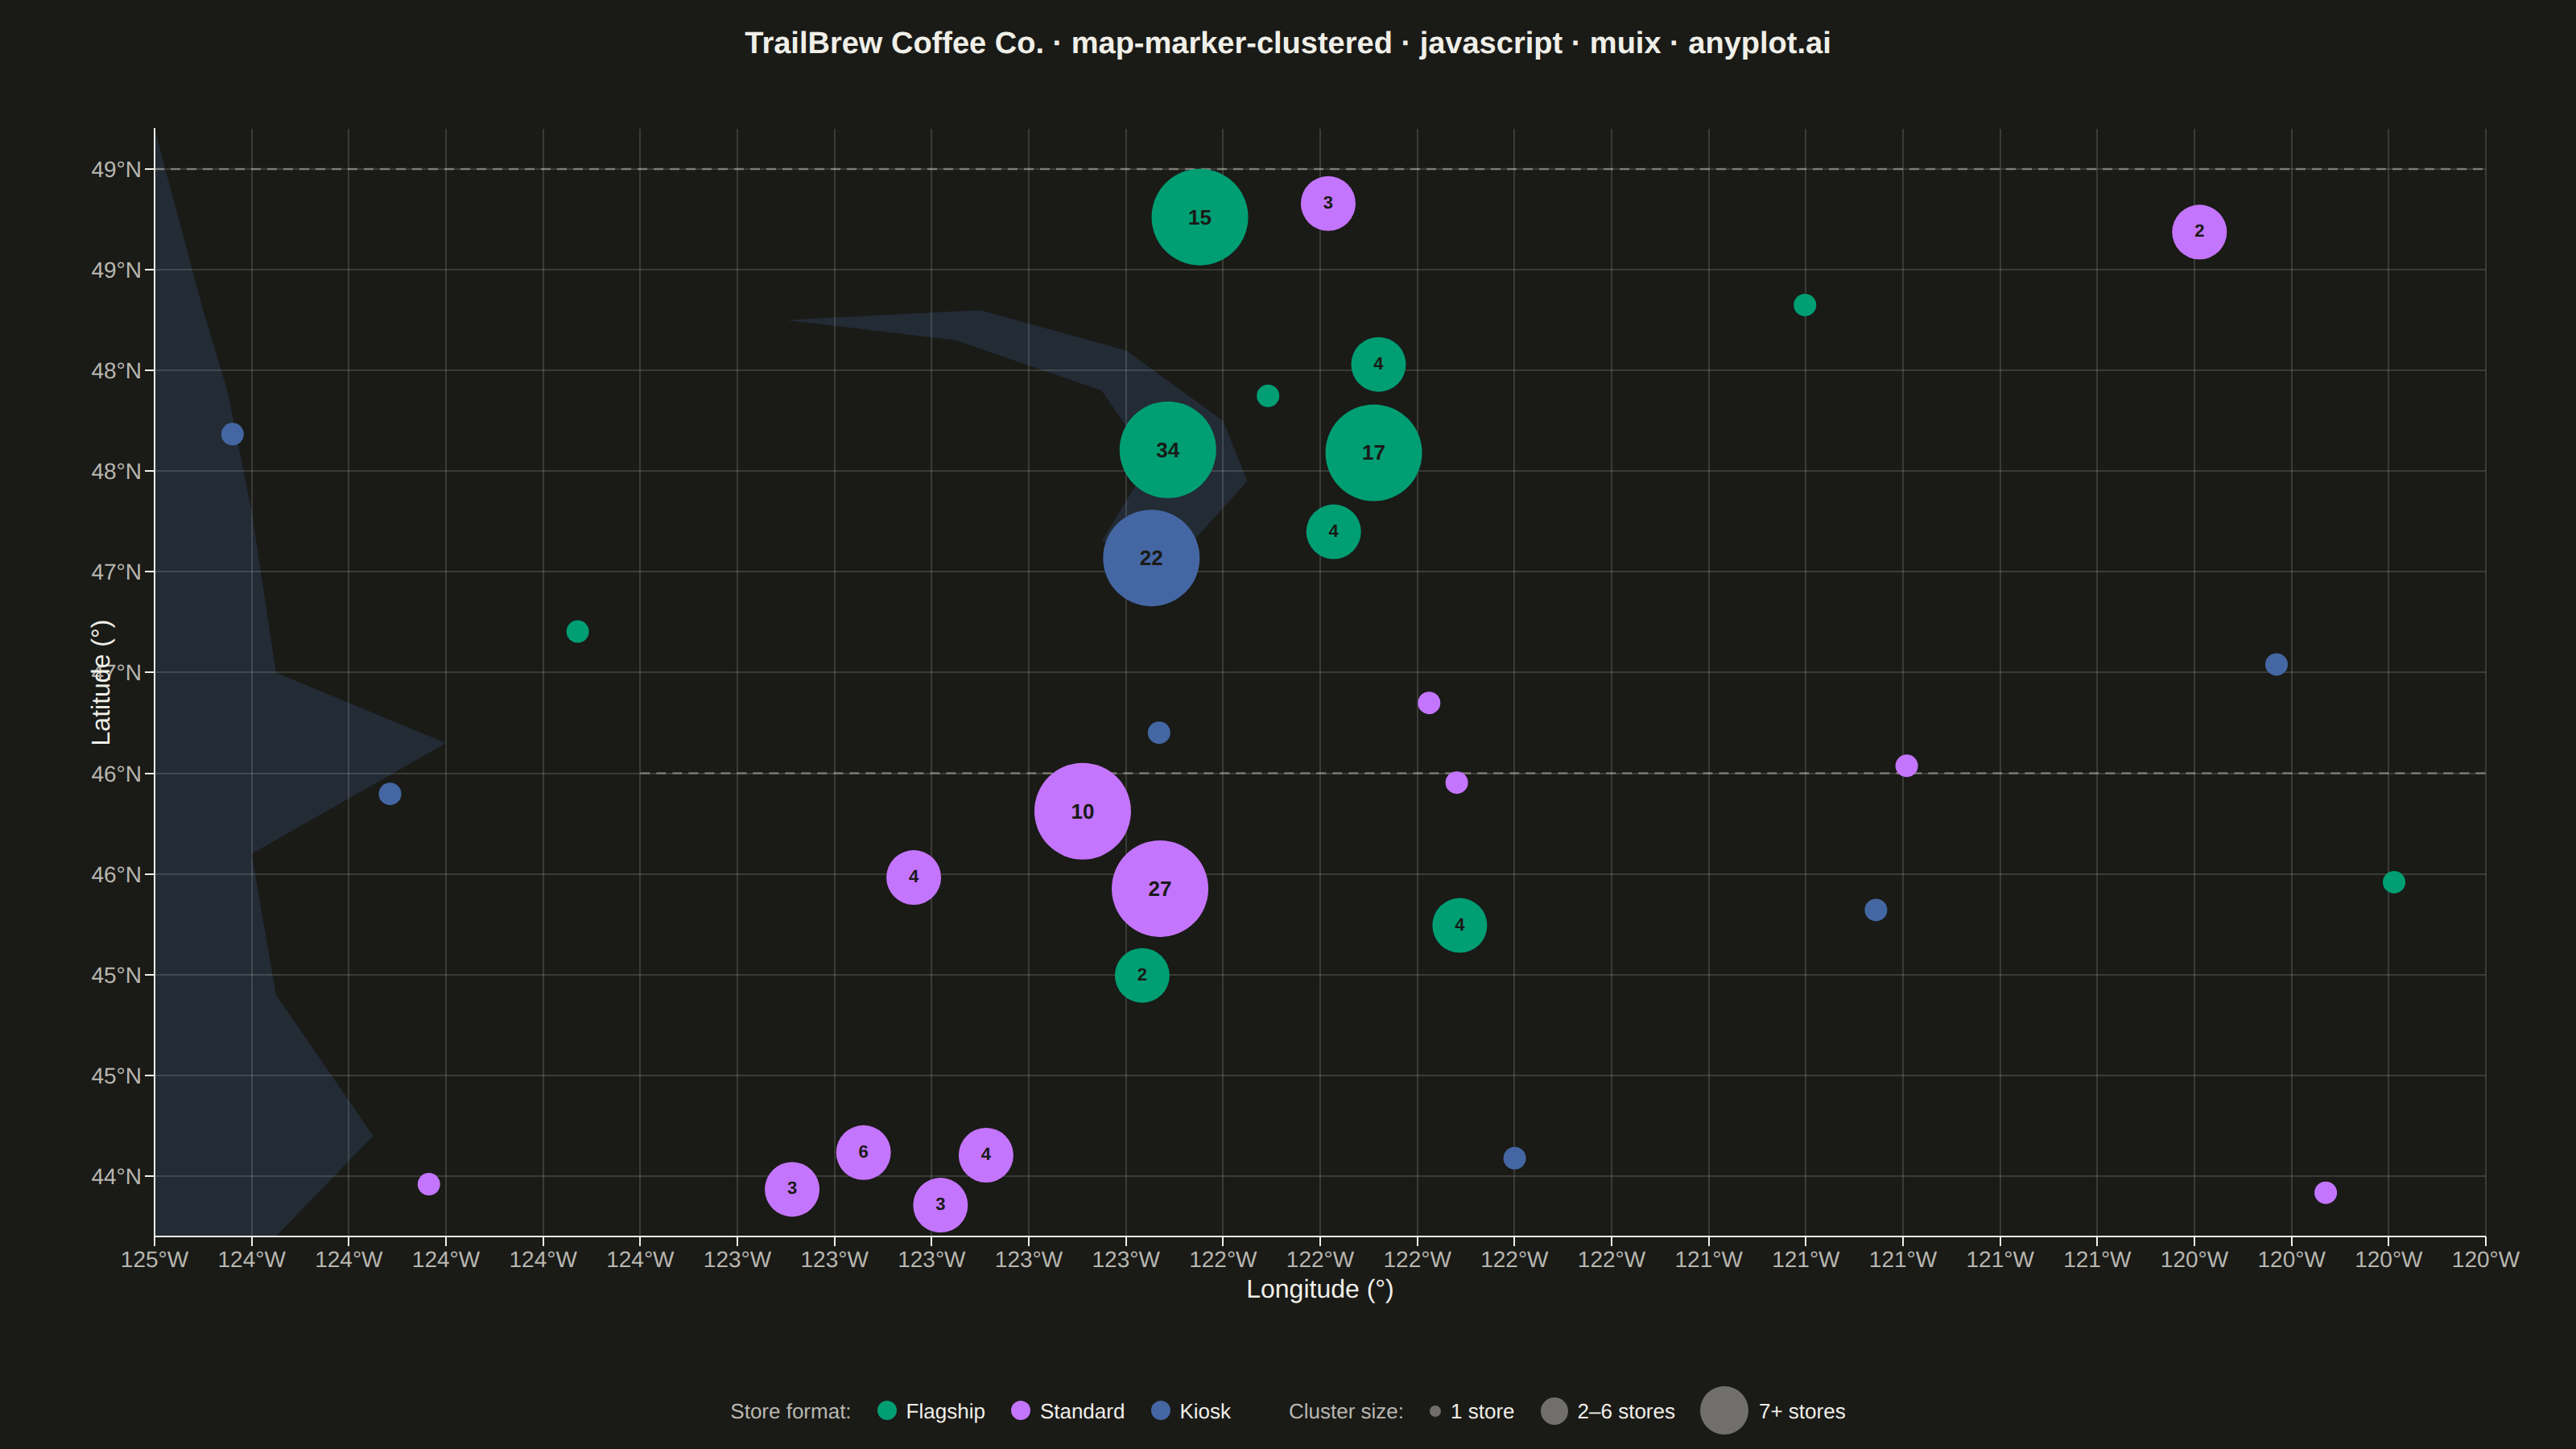
A geographic map that dynamically clusters nearby markers based on the current zoom level. At lower zoom levels, clusters aggregate multiple points into a single marker displaying the count, while zooming in progressively expands clusters to reveal individual markers. This visualization is essential for efficiently displaying large geographic datasets without visual clutter, enabling users to see both the overall distribution and specific locations through interactive exploration.
// anyplot.ai
// map-marker-clustered: Clustered Marker Map
// Library: muix 7.29.1 | JavaScript 22.23.2
// Quality: 81/100 | Created: 2026-09-02

import { ChartContainer } from "@mui/x-charts/ChartContainer";
import { ScatterPlot } from "@mui/x-charts/ScatterChart";
import { ChartsXAxis } from "@mui/x-charts/ChartsXAxis";
import { ChartsYAxis } from "@mui/x-charts/ChartsYAxis";
import { ChartsGrid } from "@mui/x-charts/ChartsGrid";
import { ChartsTooltip } from "@mui/x-charts/ChartsTooltip";
import { useXScale, useYScale } from "@mui/x-charts/hooks";

const t = window.ANYPLOT_TOKENS;
const { width, height } = window.ANYPLOT_SIZE;
const MARGIN = { top: 24, right: 56, bottom: 84, left: 96 };
const TITLE_HEIGHT = 56;
const LEGEND_HEIGHT = 48;

// --- Reproducible LCG (seed 42) — no Math.random() in the browser harness ---
let seed = 42;
function rng() {
  seed = (1664525 * seed + 1013904223) >>> 0;
  return seed / 4294967296;
}
function randomNormal(mean, stdDev) {
  const u1 = Math.max(rng(), 1e-9);
  const u2 = rng();
  const z = Math.sqrt(-2 * Math.log(u1)) * Math.cos(2 * Math.PI * u2);
  return mean + z * stdDev;
}

// --- Data: TrailBrew Coffee Co. store locations across the Pacific Northwest,
// grid-clustered the way a marker-cluster map aggregates pins at a fixed zoom
// level — dense city hubs collapse into count-labeled clusters, rural stores
// stay as individual markers. -------------------------------------------------
const CATEGORIES = ["Flagship", "Standard", "Kiosk"];

const HUBS = [
  { lat: 47.6062, lon: -122.3321, count: 55, spread: 0.22, categoryBias: 0 }, // Seattle
  { lat: 45.5152, lon: -122.6784, count: 42, spread: 0.2, categoryBias: 1 }, // Portland
  { lat: 47.2529, lon: -122.4443, count: 26, spread: 0.16, categoryBias: 2 }, // Tacoma
  { lat: 48.7519, lon: -122.4787, count: 18, spread: 0.14, categoryBias: 0 }, // Bellingham
  { lat: 44.0582, lon: -123.0868, count: 16, spread: 0.14, categoryBias: 1 }, // Eugene
];

const LAT_RANGE = [43.7, 49.2];
const LON_RANGE = [-124.6, -119.8];
const RURAL_STORE_COUNT = 22;

const stores = [];
HUBS.forEach((hub) => {
  for (let i = 0; i < hub.count; i++) {
    const categoryIndex =
      rng() < 0.65 ? hub.categoryBias : Math.floor(rng() * CATEGORIES.length);
    stores.push({
      lat: hub.lat + randomNormal(0, hub.spread),
      lon: hub.lon + randomNormal(0, hub.spread * 1.3),
      category: CATEGORIES[categoryIndex],
    });
  }
});
for (let i = 0; i < RURAL_STORE_COUNT; i++) {
  stores.push({
    lat: LAT_RANGE[0] + rng() * (LAT_RANGE[1] - LAT_RANGE[0]),
    lon: LON_RANGE[0] + rng() * (LON_RANGE[1] - LON_RANGE[0]),
    category: CATEGORIES[Math.floor(rng() * CATEGORIES.length)],
  });
}

// --- Grid-based proximity clustering (fixed zoom level) ---------------------
// Cell size tuned so adjacent cluster bubbles don't visually overlap at this
// canvas scale (larger cells merge nearby stores into a single bubble
// instead of leaving crowded neighbors).
const LAT_CELL = 0.55;
const LON_CELL = 0.75;

const cells = new Map();
stores.forEach((store) => {
  const key = `${Math.floor(store.lat / LAT_CELL)}_${Math.floor(store.lon / LON_CELL)}`;
  if (!cells.has(key)) cells.set(key, []);
  cells.get(key).push(store);
});

function dominantCategory(members) {
  const counts = {};
  members.forEach((m) => {
    counts[m.category] = (counts[m.category] || 0) + 1;
  });
  return CATEGORIES.reduce(
    (best, cat) => ((counts[cat] || 0) > (counts[best] || 0) ? cat : best),
    CATEGORIES[0],
  );
}

const clusters = Array.from(cells.values()).map((members, i) => ({
  id: `cluster-${i}`,
  x: members.reduce((sum, m) => sum + m.lon, 0) / members.length,
  y: members.reduce((sum, m) => sum + m.lat, 0) / members.length,
  z: dominantCategory(members),
  count: members.length,
}));

// Bubble radius (px) per cluster-size tier — MUI X's ScatterPlot `markerSize`
// is the marker *radius* in CSS px (confirmed by measuring the rendered PNG:
// a markerSize=17 bubble paints a 33-34px-diameter circle), so these match
// the `markerSize` values passed to the series below directly.
function radiusPxFor(count) {
  if (count > 6) return 30;
  if (count >= 2) return 17;
  return 7;
}

// Nudge overlapping cluster centroids apart in lon/lat space so every
// bubble's full circumference stays visible, converting the pixel-space
// circle-circle separation back through the known linear axis scale.
const plotWidthPx = width - MARGIN.left - MARGIN.right;
const plotHeightPx = height - TITLE_HEIGHT - LEGEND_HEIGHT - MARGIN.top - MARGIN.bottom;
const pxPerLon = plotWidthPx / (LON_RANGE[1] - LON_RANGE[0]);
const pxPerLat = plotHeightPx / (LAT_RANGE[1] - LAT_RANGE[0]);
const MIN_GAP_PX = 8;
for (let pass = 0; pass < 40; pass++) {
  let moved = false;
  for (let i = 0; i < clusters.length; i++) {
    for (let j = i + 1; j < clusters.length; j++) {
      const a = clusters[i];
      const b = clusters[j];
      const dxPx = (b.x - a.x) * pxPerLon;
      const dyPx = (b.y - a.y) * pxPerLat;
      const distPx = Math.hypot(dxPx, dyPx) || 0.001;
      const minDistPx = radiusPxFor(a.count) + radiusPxFor(b.count) + MIN_GAP_PX;
      if (distPx < minDistPx) {
        const pushPx = (minDistPx - distPx) / 2;
        const nx = dxPx / distPx;
        const ny = dyPx / distPx;
        a.x -= (nx * pushPx) / pxPerLon;
        a.y -= (ny * pushPx) / pxPerLat;
        b.x += (nx * pushPx) / pxPerLon;
        b.y += (ny * pushPx) / pxPerLat;
        moved = true;
      }
    }
  }
  if (!moved) break;
}

const individualStores = clusters.filter((c) => c.count === 1);
const smallClusters = clusters.filter((c) => c.count >= 2 && c.count <= 6);
const largeClusters = clusters.filter((c) => c.count > 6);

// --- Chrome ------------------------------------------------------------------
const categoryColors = [t.palette[0], t.palette[1], t.palette[2]];

const TITLE =
  "TrailBrew Coffee Co. · map-marker-clustered · javascript · muix · anyplot.ai";
const TITLE_FONT_DEFAULT = 22;
const titleFontSize =
  TITLE.length > 67 ? Math.round(TITLE_FONT_DEFAULT * (67 / TITLE.length)) : TITLE_FONT_DEFAULT;

const SIZE_LEGEND = [
  { label: "1 store", diameter: 7 },
  { label: "2–6 stores", diameter: 17 },
  { label: "7+ stores", diameter: 30 },
];

// --- Lightweight static basemap approximation --------------------------------
// MUI X community has no tile/geo layer, so the geographic context the spec
// asks for ("a basemap with appropriate geographic context") is drawn as a
// simplified vector coastline + strait/sound inlet + state/international
// boundary lines, positioned in real lon/lat and projected through the live
// axis scale — the same technique ClusterCountLabels already uses.
const PACIFIC_COAST = [
  [-124.35, 43.7],
  [-124.15, 44.2],
  [-124.35, 44.9],
  [-124.4, 45.6],
  [-124.0, 46.15],
  [-124.35, 46.5],
  [-124.4, 47.3],
  [-124.45, 47.9],
  [-124.5, 48.3],
];

const PUGET_SOUND = [
  [-123.3, 48.25],
  [-122.9, 48.3],
  [-122.6, 48.1],
  [-122.4, 47.75],
  [-122.35, 47.45],
  [-122.5, 47.05],
  [-122.65, 47.15],
  [-122.55, 47.55],
  [-122.65, 47.9],
  [-122.95, 48.15],
];

// Straight-line approximations, close enough at this zoom level.
const CANADA_BORDER_LAT = 49.0;
const WA_OR_BORDER_LAT = 46.0;

function GeographicBackdrop() {
  const xScale = useXScale();
  const yScale = useYScale();
  if (!xScale || !yScale) return null;

  const project = ([lon, lat]) => `${xScale(lon)},${yScale(lat)}`;

  // Ocean strip: coastline plus the two viewport corners on the west edge
  // (lon = LON_RANGE[0]) so the shape closes into a clean west-of-coast fill.
  const oceanPoints = [
    [LON_RANGE[0], LAT_RANGE[0]],
    ...PACIFIC_COAST,
    [LON_RANGE[0], LAT_RANGE[1]],
  ]
    .map(project)
    .join(" ");

  const soundPoints = PUGET_SOUND.map(project).join(" ");

  // "Water → blue" per the Imprint semantic-color convention, at low alpha
  // so it reads as a tint rather than a data series.
  const waterColor = t.palette[2];

  return (
    <g pointerEvents="none">
      <polygon points={oceanPoints} fill={waterColor} opacity={0.22} stroke="none" />
      <polygon points={soundPoints} fill={waterColor} opacity={0.22} stroke="none" />
      <line
        x1={xScale(LON_RANGE[0])}
        y1={yScale(CANADA_BORDER_LAT)}
        x2={xScale(LON_RANGE[1])}
        y2={yScale(CANADA_BORDER_LAT)}
        stroke={t.inkSoft}
        strokeWidth={1.25}
        strokeDasharray="6 4"
        opacity={0.5}
      />
      <line
        x1={xScale(-123.6)}
        y1={yScale(WA_OR_BORDER_LAT)}
        x2={xScale(LON_RANGE[1])}
        y2={yScale(WA_OR_BORDER_LAT)}
        stroke={t.inkSoft}
        strokeWidth={1.25}
        strokeDasharray="6 4"
        opacity={0.5}
      />
    </g>
  );
}

// Cluster-count labels, drawn at the live axis scale so each count sits
// exactly centered on its bubble — the honest way to show "how many
// markers this cluster represents" without faking a hover tooltip in the
// static PNG.
function ClusterCountLabels() {
  const xScale = useXScale();
  const yScale = useYScale();
  if (!xScale || !yScale) return null;

  return (
    <g pointerEvents="none">
      {[...smallClusters, ...largeClusters].map((c) => (
        <text
          key={c.id}
          x={xScale(c.x)}
          y={yScale(c.y)}
          fontSize={c.count > 6 ? 13 : 11}
          fontWeight={600}
          fill={t.pageBg}
          textAnchor="middle"
          dominantBaseline="central"
        >
          {c.count}
        </text>
      ))}
    </g>
  );
}

export default function Chart() {
  const chartHeight = height - TITLE_HEIGHT - LEGEND_HEIGHT;

  return (
    <div style={{ width, height, backgroundColor: t.pageBg }}>
      <div
        style={{
          height: TITLE_HEIGHT,
          display: "flex",
          alignItems: "center",
          justifyContent: "center",
          fontSize: titleFontSize,
          fontWeight: 600,
          color: t.ink,
        }}
      >
        {TITLE}
      </div>
      <ChartContainer
        width={width}
        height={chartHeight}
        margin={MARGIN}
        series={[
          {
            type: "scatter",
            id: "individual",
            data: individualStores,
            label: "Single location",
            markerSize: 7,
            zAxisId: "category",
          },
          {
            type: "scatter",
            id: "small-cluster",
            data: smallClusters,
            label: "Small cluster (2–6 stores)",
            markerSize: 17,
            zAxisId: "category",
          },
          {
            type: "scatter",
            id: "large-cluster",
            data: largeClusters,
            label: "Large cluster (7+ stores)",
            markerSize: 30,
            zAxisId: "category",
          },
        ]}
        zAxis={[
          {
            id: "category",
            colorMap: { type: "ordinal", values: CATEGORIES, colors: categoryColors },
          },
        ]}
        xAxis={[
          {
            scaleType: "linear",
            min: LON_RANGE[0],
            max: LON_RANGE[1],
            label: "Longitude (°)",
            valueFormatter: (v) => `${Math.abs(v).toFixed(0)}°${v < 0 ? "W" : "E"}`,
            tickLabelStyle: { fontSize: 14, fill: t.inkSoft },
            labelStyle: { fontSize: 16, fill: t.ink },
          },
        ]}
        yAxis={[
          {
            scaleType: "linear",
            min: LAT_RANGE[0],
            max: LAT_RANGE[1],
            label: "Latitude (°)",
            valueFormatter: (v) => `${Math.abs(v).toFixed(0)}°${v < 0 ? "S" : "N"}`,
            tickLabelStyle: { fontSize: 14, fill: t.inkSoft },
            labelStyle: { fontSize: 16, fill: t.ink },
          },
        ]}
        sx={{
          "& .MuiChartsAxis-line": { stroke: t.inkSoft },
          "& .MuiChartsAxis-tick": { stroke: t.inkSoft },
          "& .MuiChartsGrid-line": { stroke: t.grid, strokeWidth: 1 },
        }}
      >
        <GeographicBackdrop />
        <ChartsGrid horizontal vertical />
        <ScatterPlot skipAnimation />
        <ClusterCountLabels />
        <ChartsXAxis tickLabelStyle={{ fontSize: 14, fill: t.inkSoft }} labelStyle={{ fontSize: 16, fill: t.ink }} />
        <ChartsYAxis tickLabelStyle={{ fontSize: 14, fill: t.inkSoft }} labelStyle={{ fontSize: 16, fill: t.ink }} />
        <ChartsTooltip trigger="item" />
      </ChartContainer>
      <div
        style={{
          height: LEGEND_HEIGHT,
          display: "flex",
          alignItems: "center",
          justifyContent: "center",
          gap: 36,
        }}
      >
        <div style={{ display: "flex", alignItems: "center", gap: 16 }}>
          <span style={{ fontSize: 13, color: t.inkSoft }}>Store format:</span>
          {CATEGORIES.map((cat, i) => (
            <div key={cat} style={{ display: "flex", alignItems: "center", gap: 6 }}>
              <span
                style={{
                  width: 12,
                  height: 12,
                  borderRadius: "50%",
                  backgroundColor: categoryColors[i],
                  flexShrink: 0,
                }}
              />
              <span style={{ fontSize: 13, color: t.ink }}>{cat}</span>
            </div>
          ))}
        </div>
        <div style={{ display: "flex", alignItems: "center", gap: 16 }}>
          <span style={{ fontSize: 13, color: t.inkSoft }}>Cluster size:</span>
          {SIZE_LEGEND.map((entry) => (
            <div key={entry.label} style={{ display: "flex", alignItems: "center", gap: 6 }}>
              <span
                style={{
                  width: entry.diameter,
                  height: entry.diameter,
                  borderRadius: "50%",
                  backgroundColor: t.inkSoft,
                  opacity: 0.55,
                  flexShrink: 0,
                }}
              />
              <span style={{ fontSize: 13, color: t.ink }}>{entry.label}</span>
            </div>
          ))}
        </div>
      </div>
    </div>
  );
}
Runnable source as JSON, for any HTTP client: https://api.anyplot.ai/specs/map-marker-clustered/muix/code. Any spec id and library id listed in llms-full.txt fit the same URL shape; every URL below is complete and callable.
{
  "spec_id": "map-marker-clustered",
  "language": "javascript",
  "library": "muix",
  "page": "https://anyplot.ai/map-marker-clustered/javascript/muix",
  "hub": "https://anyplot.ai/map-marker-clustered",
  "code_json": "https://api.anyplot.ai/specs/map-marker-clustered/muix/code",
  "spec_json": "https://api.anyplot.ai/specs/map-marker-clustered",
  "render_light_png": "https://storage.googleapis.com/anyplot-images/plots/map-marker-clustered/javascript/muix/plot-light.png",
  "render_dark_png": "https://storage.googleapis.com/anyplot-images/plots/map-marker-clustered/javascript/muix/plot-dark.png",
  "interactive_light_html": "https://storage.googleapis.com/anyplot-images/plots/map-marker-clustered/javascript/muix/plot-light.html",
  "interactive_dark_html": "https://storage.googleapis.com/anyplot-images/plots/map-marker-clustered/javascript/muix/plot-dark.html",
  "quality_score": 81.0,
  "license": "MIT",
  "guide": "https://anyplot.ai/llms.txt"
}
Part of Clustered Marker Map on anyplot.ai.