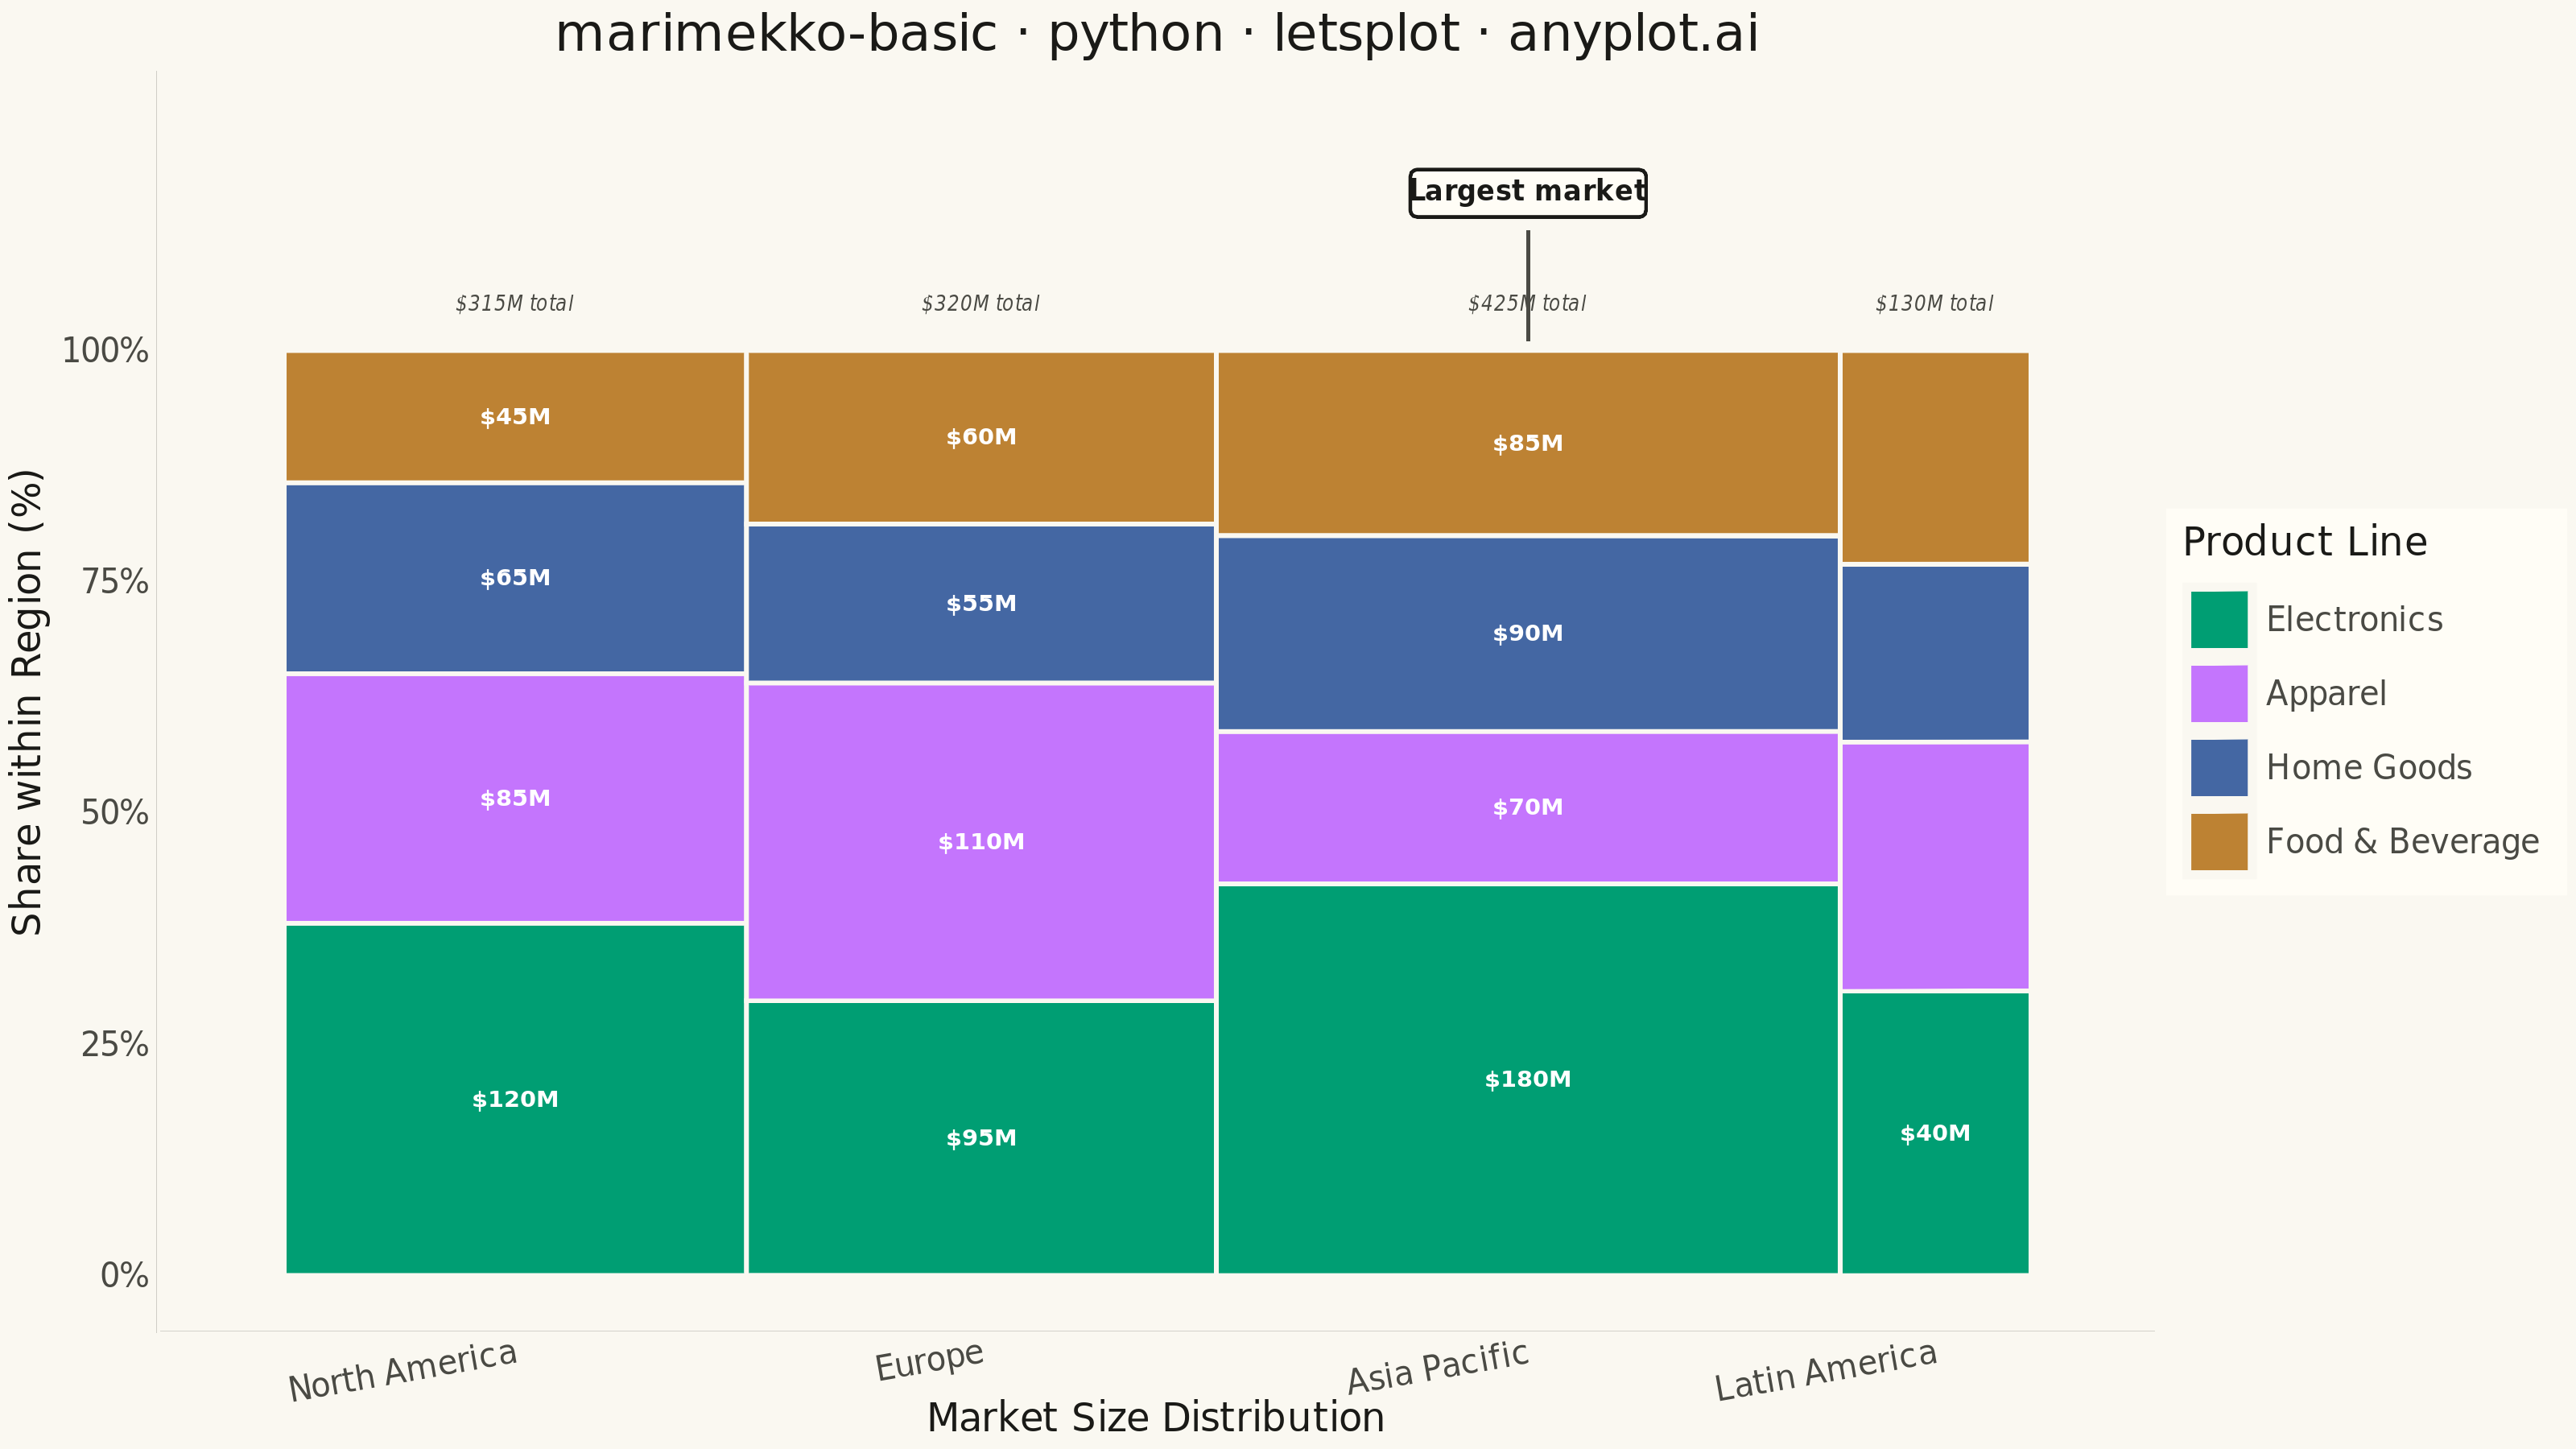
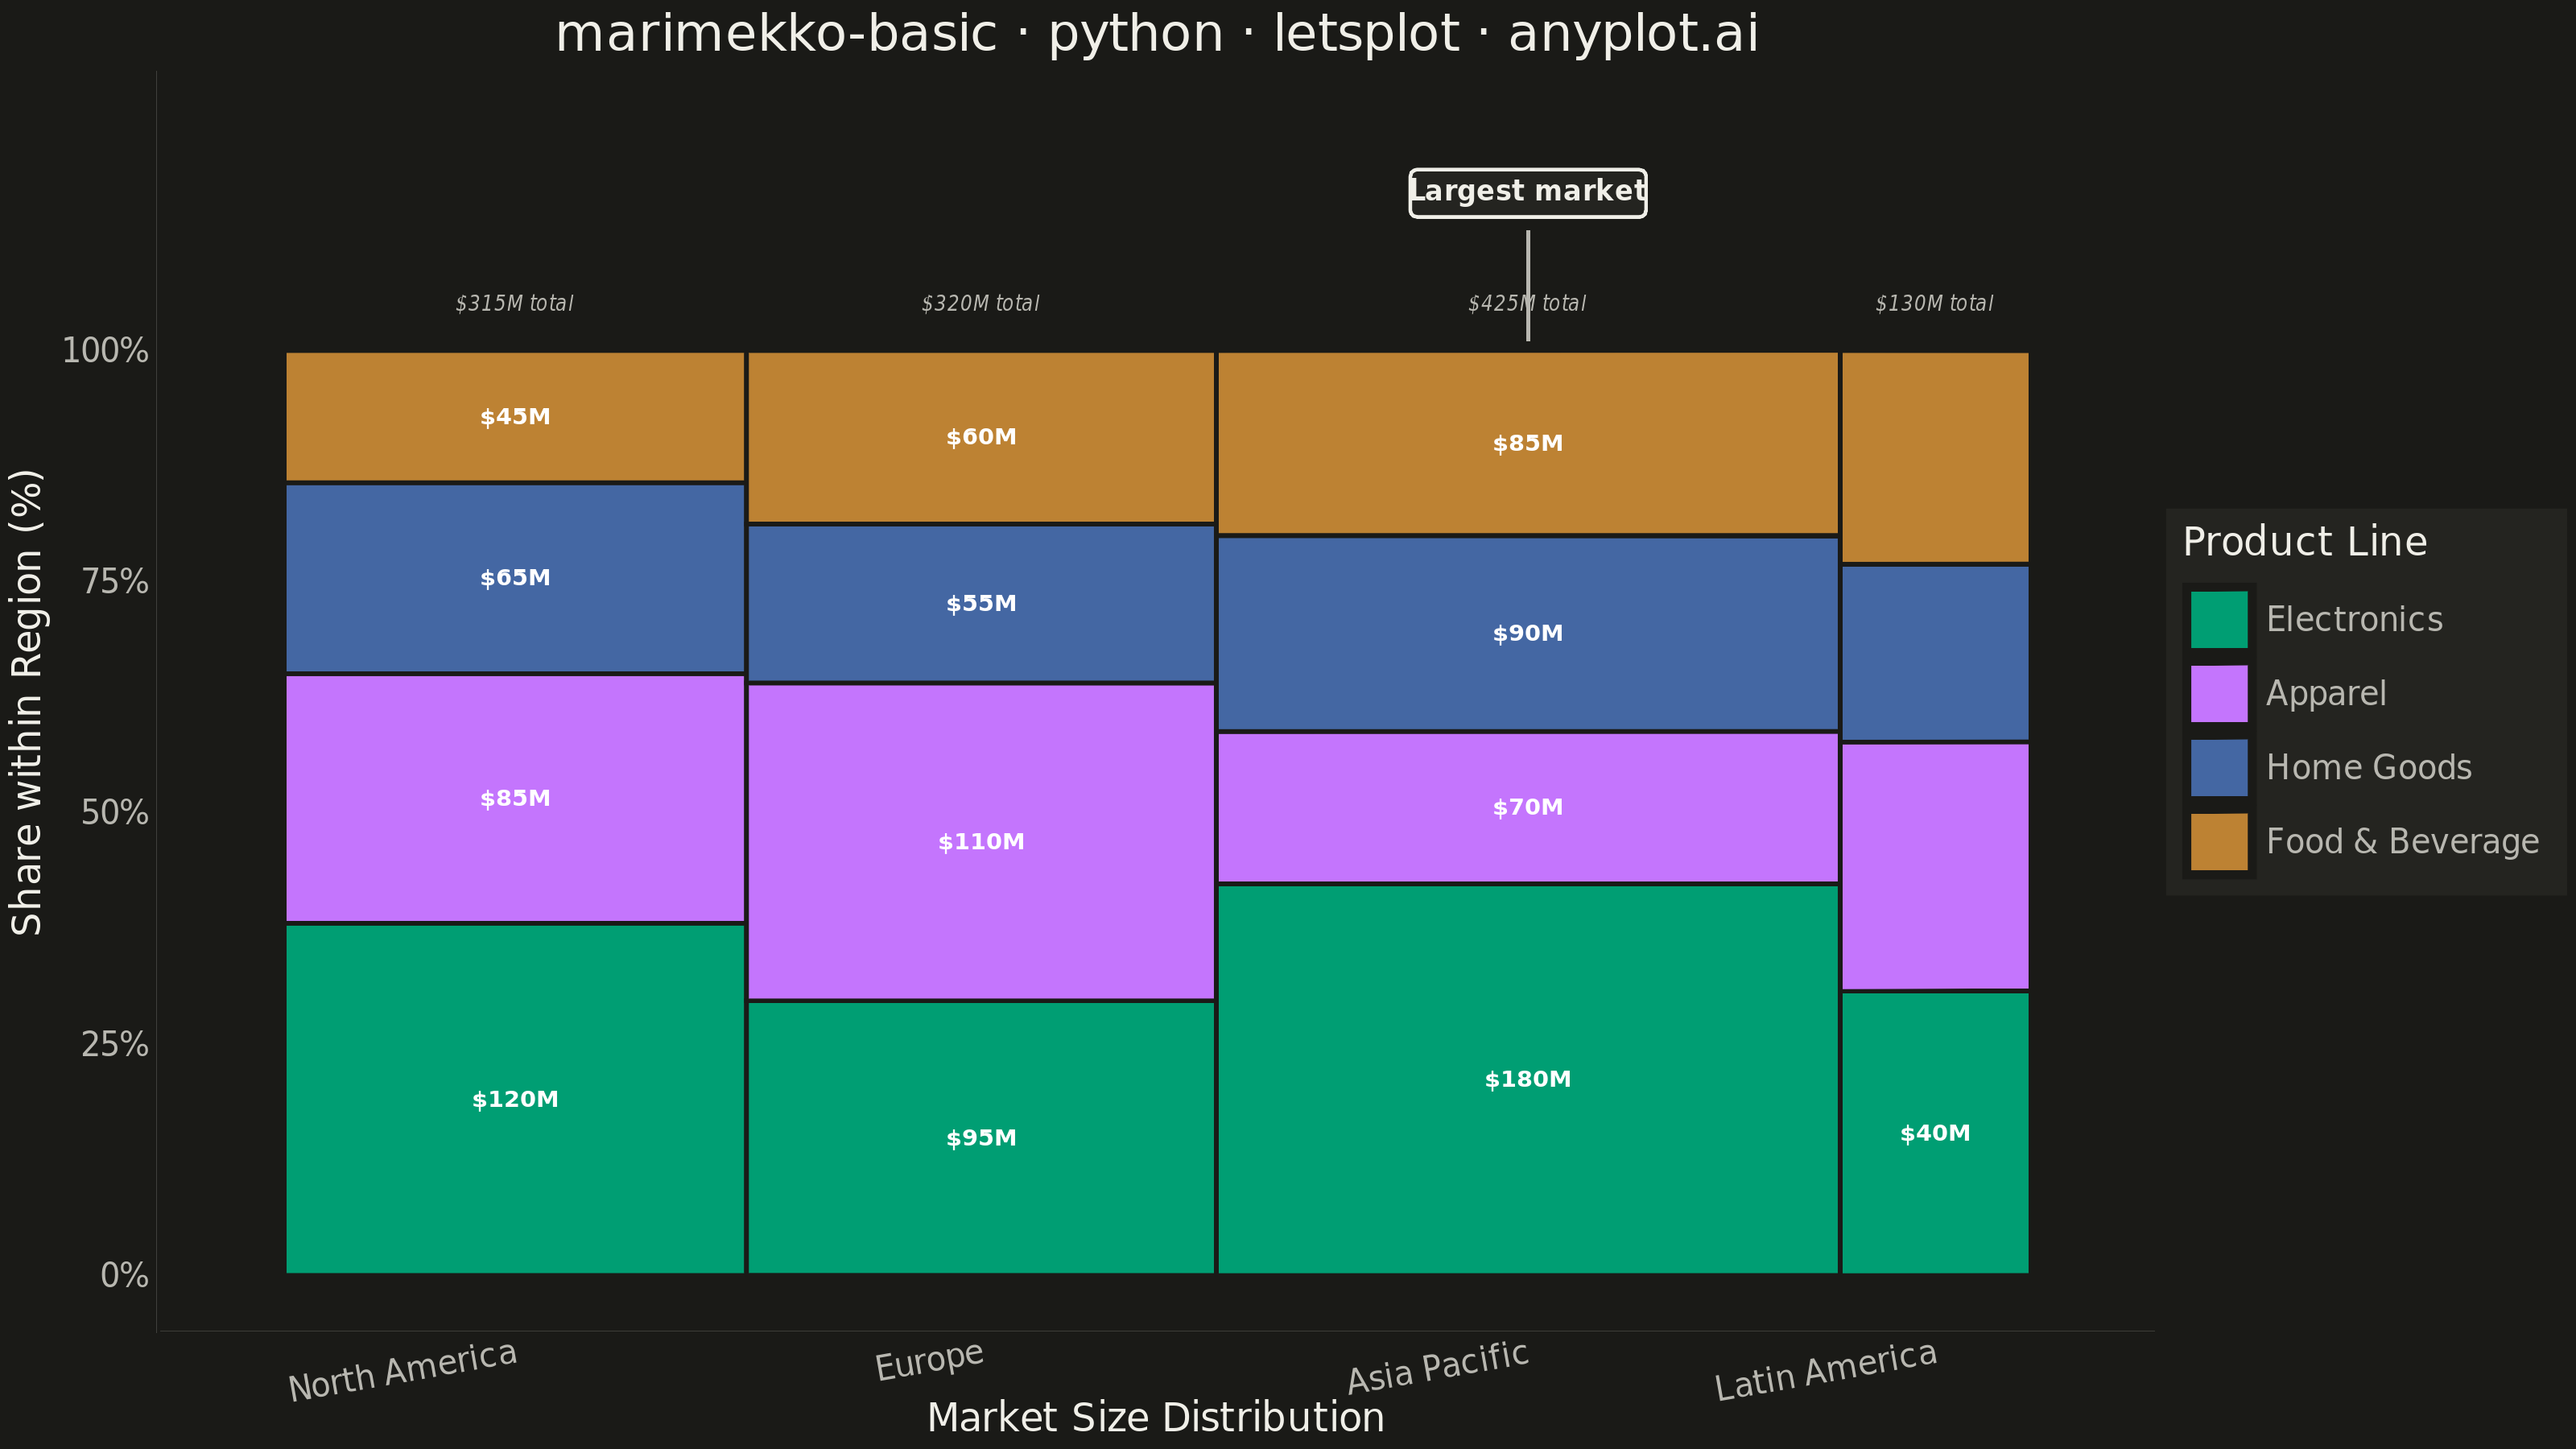
A Marimekko chart (also called mekko or mosaic plot) is a stacked bar chart where both the width and height of segments represent data values. This visualization shows two categorical dimensions simultaneously with proportional areas, making it ideal for understanding how parts relate to wholes across categories of different sizes.
Preview render from the lets-plot implementation.