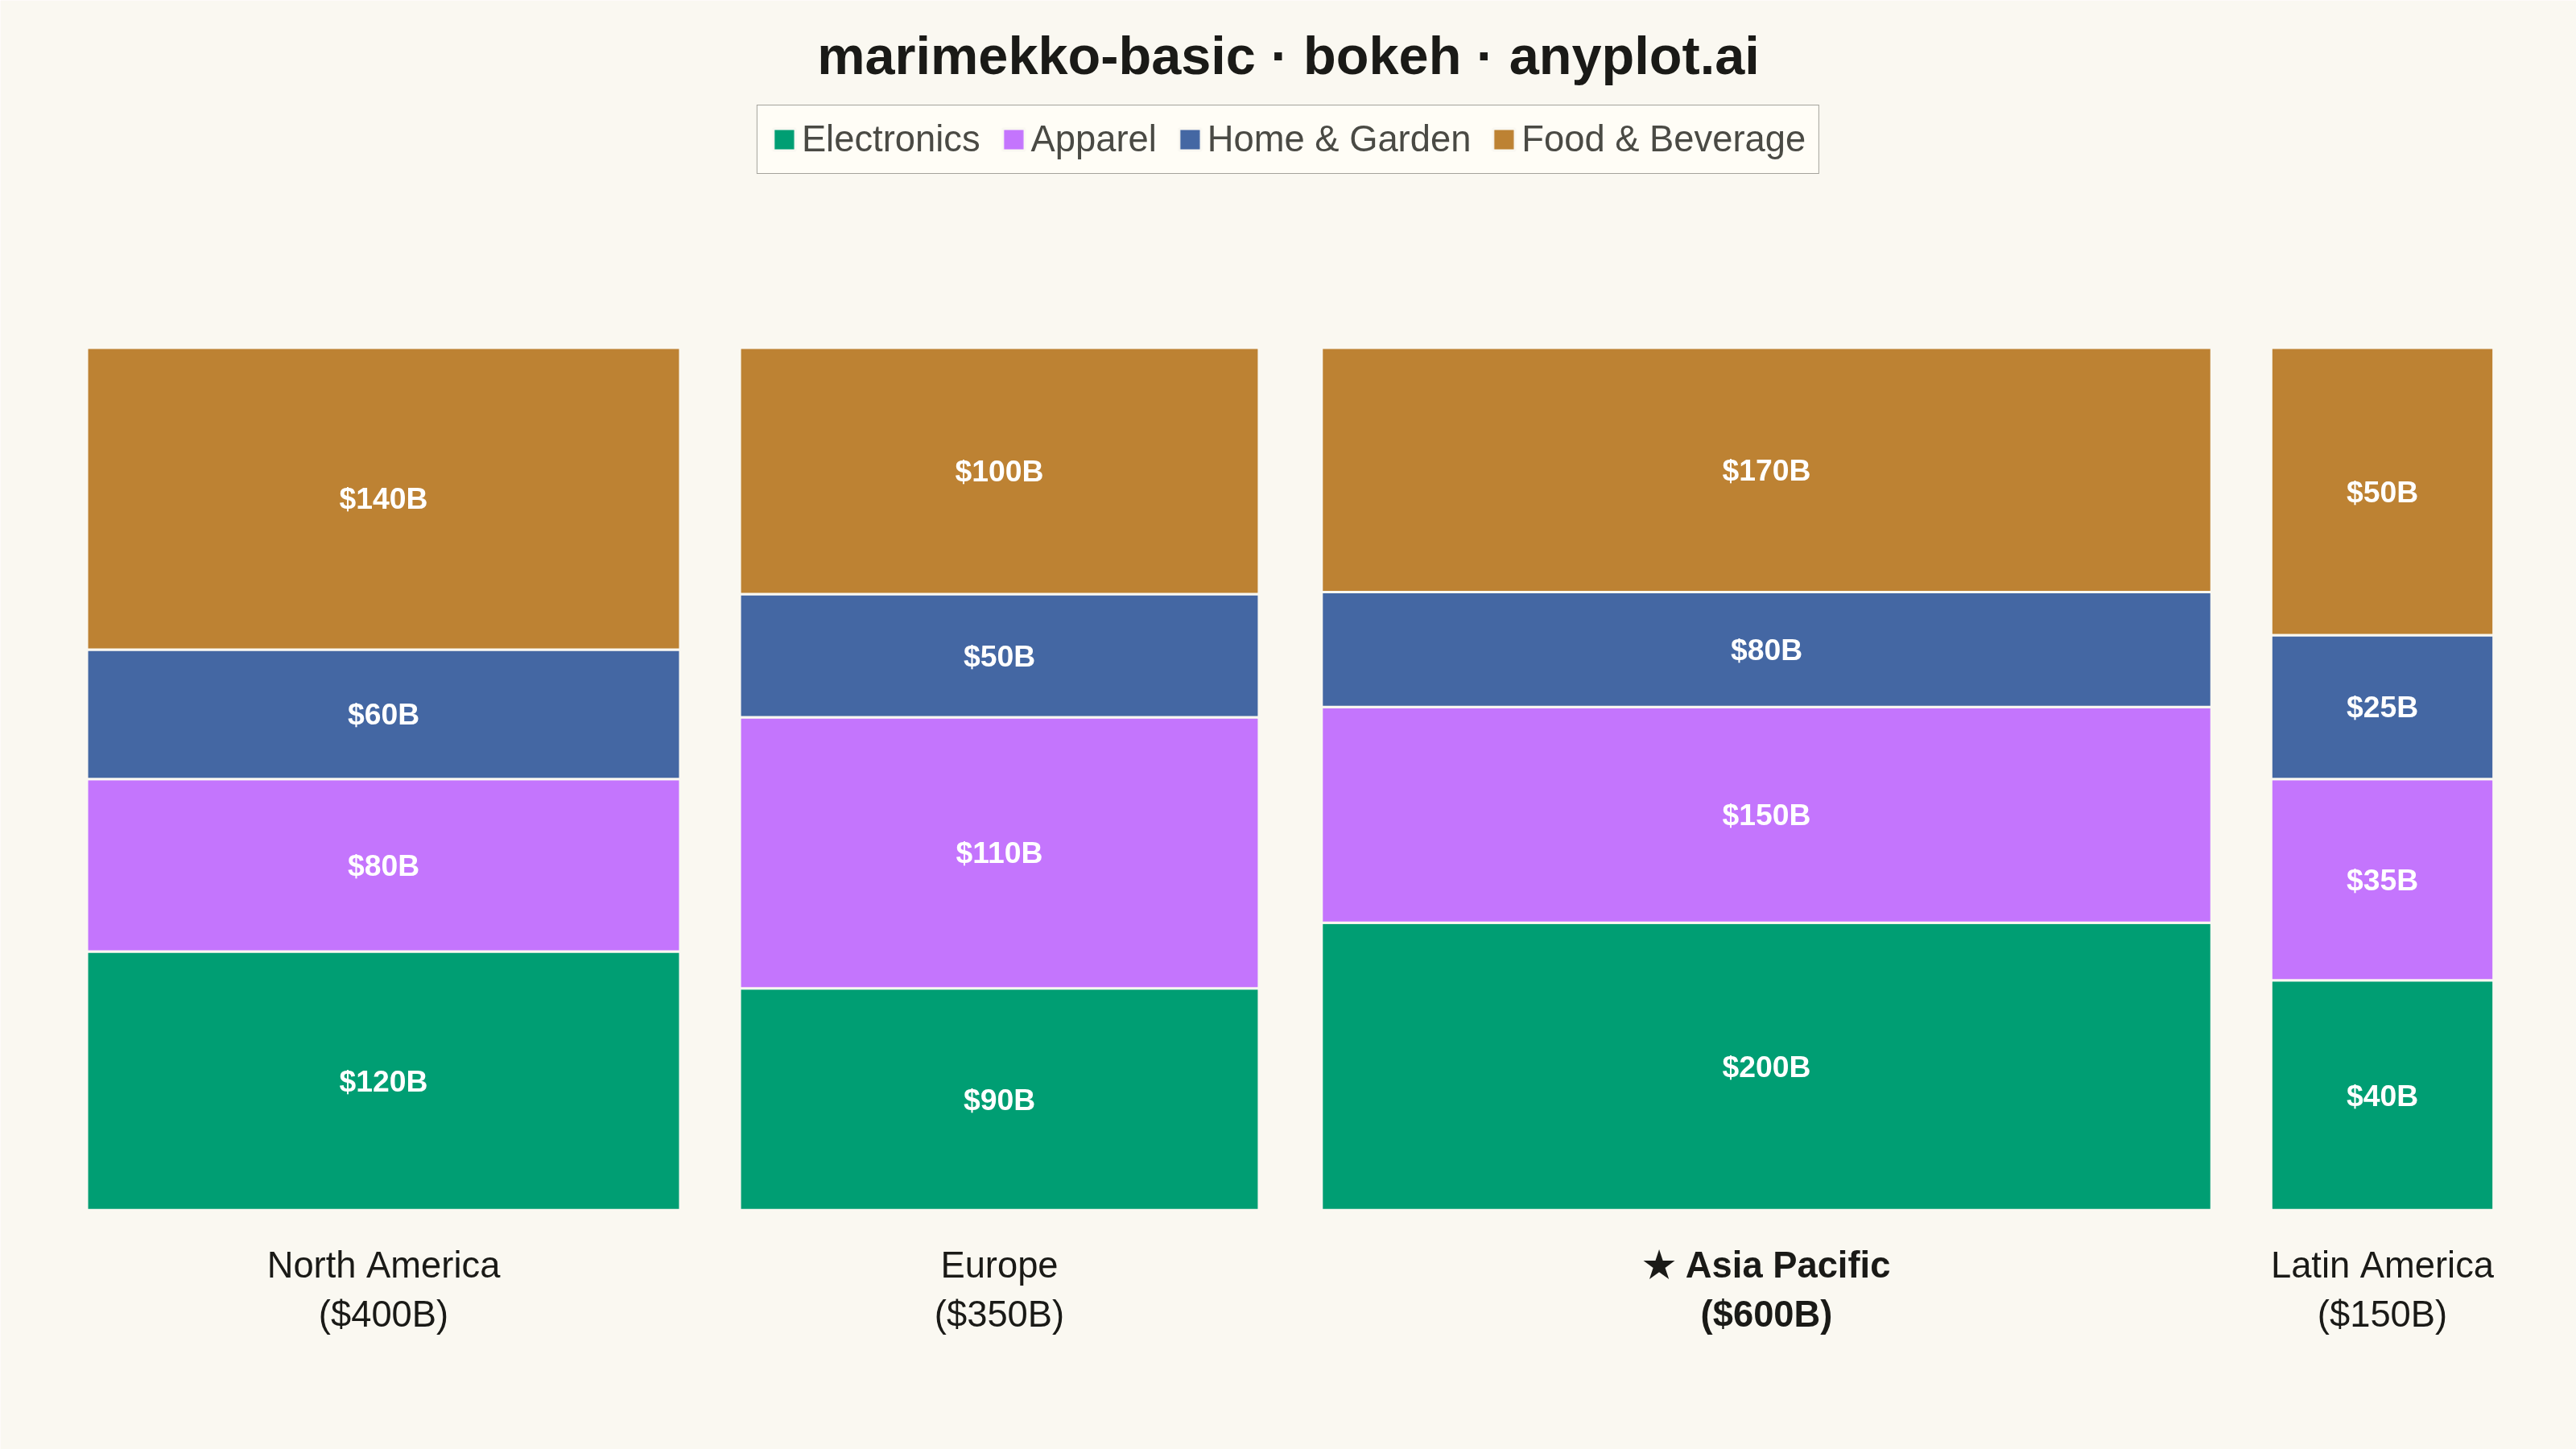
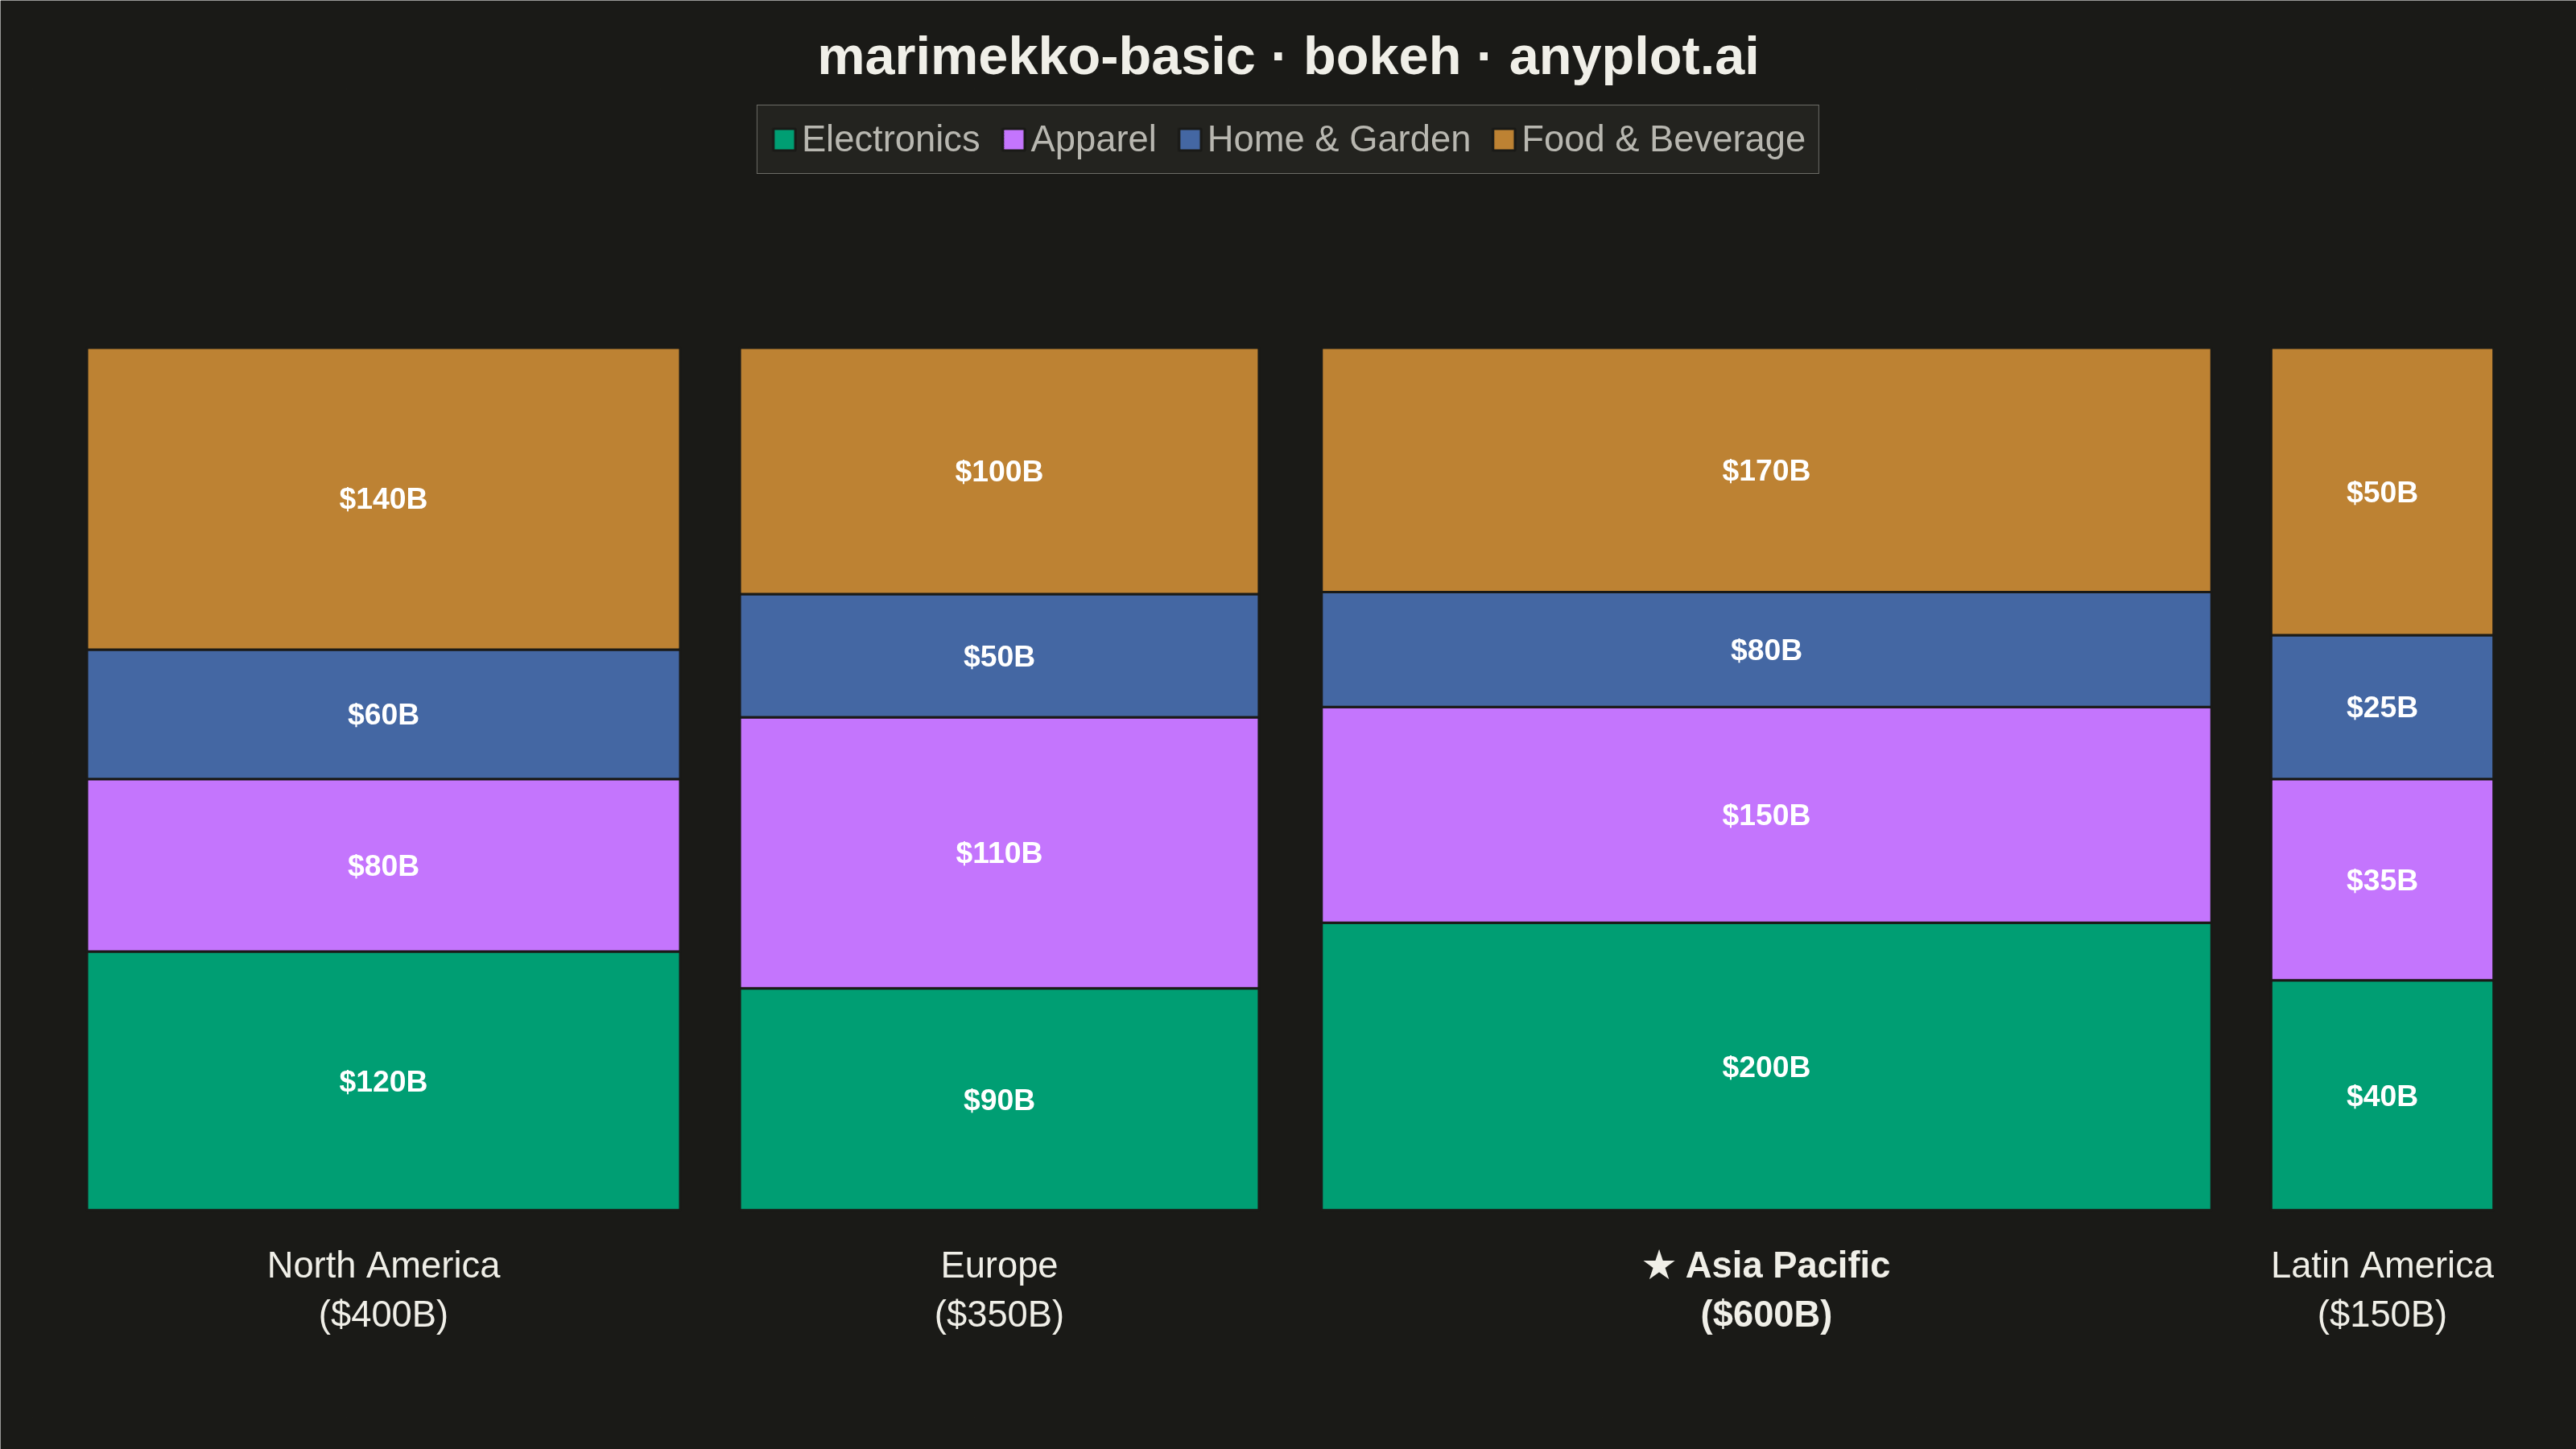
A Marimekko chart (also called mekko or mosaic plot) is a stacked bar chart where both the width and height of segments represent data values. This visualization shows two categorical dimensions simultaneously with proportional areas, making it ideal for understanding how parts relate to wholes across categories of different sizes.
""" anyplot.ai
marimekko-basic: Basic Marimekko Chart
Library: bokeh 3.9.1 | Python 3.13.14
Quality: 94/100 | Updated: 2026-07-24
"""

import os
import sys


# Prevent self-import: this file is named bokeh.py, which shadows the installed
# bokeh package when its directory sits at the front of sys.path.
_this_dir = os.path.dirname(os.path.abspath(__file__))
sys.path = [p for p in sys.path if os.path.abspath(p or ".") != _this_dir]

import time
from pathlib import Path

from bokeh.io import output_file, save
from bokeh.models import ColumnDataSource, HoverTool, Label, LabelSet
from bokeh.plotting import figure
from selenium import webdriver
from selenium.webdriver.chrome.options import Options


# Theme tokens
THEME = os.getenv("ANYPLOT_THEME", "light")
PAGE_BG = "#FAF8F1" if THEME == "light" else "#1A1A17"
ELEVATED_BG = "#FFFDF6" if THEME == "light" else "#242420"
INK = "#1A1A17" if THEME == "light" else "#F0EFE8"
INK_SOFT = "#4A4A44" if THEME == "light" else "#B8B7B0"

# Imprint palette (positions 1-4)
IMPRINT = ["#009E73", "#C475FD", "#4467A3", "#BD8233"]

# Data: Market share across regions with varying market sizes
regions = ["North America", "Europe", "Asia Pacific", "Latin America"]
products = ["Electronics", "Apparel", "Home & Garden", "Food & Beverage"]

market_data = {
    "North America": {"Electronics": 120, "Apparel": 80, "Home & Garden": 60, "Food & Beverage": 140},
    "Europe": {"Electronics": 90, "Apparel": 110, "Home & Garden": 50, "Food & Beverage": 100},
    "Asia Pacific": {"Electronics": 200, "Apparel": 150, "Home & Garden": 80, "Food & Beverage": 170},
    "Latin America": {"Electronics": 40, "Apparel": 35, "Home & Garden": 25, "Food & Beverage": 50},
}

# Calculate totals for each region (determines bar width)
region_totals = {region: sum(market_data[region].values()) for region in regions}
total_all = sum(region_totals.values())
leading_region = max(regions, key=lambda r: region_totals[r])

# Calculate normalized widths (proportional to region total)
bar_gap = 0.02
total_width = 1.0 - (len(regions) - 1) * bar_gap
widths = {region: (region_totals[region] / total_all) * total_width for region in regions}

# Build rectangle data for each segment (bottom-up stacking within each bar)
rect_x, rect_y, rect_widths, rect_heights = [], [], [], []
rect_colors, rect_products, rect_regions, rect_values, rect_percentages = [], [], [], [], []

current_x = 0.0
for region in regions:
    bar_width = widths[region]
    bar_center_x = current_x + bar_width / 2
    current_y = 0.0
    region_total = region_totals[region]

    for i, product in enumerate(products):
        value = market_data[region][product]
        height = value / region_total

        rect_x.append(bar_center_x)
        rect_y.append(current_y + height / 2)
        rect_widths.append(bar_width * 0.98)
        rect_heights.append(height)
        rect_colors.append(IMPRINT[i])
        rect_products.append(product)
        rect_regions.append(region)
        rect_values.append(value)
        rect_percentages.append(f"{height * 100:.1f}%")

        current_y += height

    current_x += bar_width + bar_gap

# Plot — extra headroom above (legend) and below (region labels) the [0, 1]
# stacked-share band keeps both off the bar body, unlike a bar-body overlay.
p = figure(
    width=3200,
    height=1800,
    title="marimekko-basic · bokeh · anyplot.ai",
    x_range=(-0.02, 1.02),
    y_range=(-0.24, 1.30),
    tools="",
    toolbar_location=None,
    min_border_top=110,
    min_border_bottom=40,
    min_border_left=40,
    min_border_right=40,
)

# One renderer per product (rather than a single factor-colored renderer) so
# bokeh builds a real, auto-placed Legend from legend_label= instead of a
# manual quad+text stand-in.
rect_renderers = []
for i, product in enumerate(products):
    idx = [j for j, prod in enumerate(rect_products) if prod == product]
    product_source = ColumnDataSource(
        data={
            "x": [rect_x[j] for j in idx],
            "y": [rect_y[j] for j in idx],
            "width": [rect_widths[j] for j in idx],
            "height": [rect_heights[j] for j in idx],
            "region": [rect_regions[j] for j in idx],
            "product": [product] * len(idx),
            "value": [rect_values[j] for j in idx],
            "percentage": [rect_percentages[j] for j in idx],
        }
    )
    renderer = p.rect(
        x="x",
        y="y",
        width="width",
        height="height",
        color=IMPRINT[i],
        source=product_source,
        line_color=PAGE_BG,
        line_width=3,
        legend_label=product,
    )
    rect_renderers.append(renderer)

hover = HoverTool(
    renderers=rect_renderers,
    tooltips=[("Region", "@region"), ("Product", "@product"), ("Value", "$@value B"), ("Share", "@percentage")],
)
p.add_tools(hover)

# Value labels on larger segments
label_x, label_y, label_text = [], [], []
for i in range(len(rect_x)):
    if rect_heights[i] > 0.12 and rect_widths[i] > 0.08:
        label_x.append(rect_x[i])
        label_y.append(rect_y[i])
        label_text.append(f"${rect_values[i]}B")

label_source = ColumnDataSource(data={"x": label_x, "y": label_y, "text": label_text})
p.add_layout(
    LabelSet(
        x="x",
        y="y",
        text="text",
        source=label_source,
        text_align="center",
        text_baseline="middle",
        text_color="white",
        text_font_size="28pt",
        text_font_style="bold",
    )
)

# Region labels below each bar — the leading region gets a star + bold weight
# as a focal point calling out the dominant market (data storytelling).
current_x = 0.0
for region in regions:
    bar_width = widths[region]
    is_leader = region == leading_region
    text = f"{'★ ' if is_leader else ''}{region}\n(${region_totals[region]}B)"
    p.add_layout(
        Label(
            x=current_x + bar_width / 2,
            y=-0.04,
            text=text,
            text_align="center",
            text_baseline="top",
            text_color=INK,
            text_font_size="34pt",
            text_font_style="bold" if is_leader else "normal",
        )
    )
    current_x += bar_width + bar_gap

# Style
p.background_fill_color = PAGE_BG
p.border_fill_color = PAGE_BG
# Match (not None) the frame outline to the page background — bokeh's headless
# Chrome screenshot renders a faint default outline even with outline_line_color
# unset, so blending it into the surface is the reliable way to hide it.
p.outline_line_color = PAGE_BG

p.title.text_font_size = "50pt"
p.title.align = "center"
p.title.text_color = INK

p.xaxis.visible = False
p.yaxis.visible = False
p.xgrid.visible = False
p.ygrid.visible = False

# Auto-generated legend (from legend_label= above), pinned in the headroom
# band above the bars so it never overlaps the data — fixes the previous
# manual legend sitting on top of the Asia Pacific bar.
p.legend.location = "top_center"
p.legend.orientation = "horizontal"
p.legend.click_policy = "hide"
p.legend.background_fill_color = ELEVATED_BG
p.legend.border_line_color = INK_SOFT
p.legend.label_text_color = INK_SOFT
p.legend.label_text_font_size = "34pt"
p.legend.glyph_height = 34
p.legend.glyph_width = 34
p.legend.spacing = 24
p.legend.margin = 20
p.legend.padding = 16

# Save — the interactive HTML is a required catalog artifact, and the PNG is
# screenshotted with headless Chrome rather than bokeh.io.export_png, which
# depends on a chromedriver snap shim unavailable in this environment.
output_file(f"plot-{THEME}.html")
save(p)

W, H = 3200, 1800
opts = Options()
for arg in (
    "--headless=new",
    "--no-sandbox",
    "--disable-dev-shm-usage",
    "--disable-gpu",
    f"--window-size={W},{H}",
    "--hide-scrollbars",
):
    opts.add_argument(arg)
driver = webdriver.Chrome(options=opts)
driver.set_window_size(W, H)
driver.get(f"file://{Path(f'plot-{THEME}.html').resolve()}")
# Headless Chrome's --window-size sets the OUTER window, which still reserves
# a phantom title-bar height even headless — pin the viewport exactly via CDP
# so the screenshot lands on the canonical 3200x1800 pixel target.
driver.execute_cdp_cmd(
    "Emulation.setDeviceMetricsOverride", {"width": W, "height": H, "deviceScaleFactor": 1, "mobile": False}
)
time.sleep(3)  # let bokeh's JS render the canvas
driver.save_screenshot(f"plot-{THEME}.png")
driver.quit()
Runnable source as JSON, for any HTTP client: https://api.anyplot.ai/specs/marimekko-basic/bokeh/code. Any spec id and library id listed in llms-full.txt fit the same URL shape; every URL below is complete and callable.
{
  "spec_id": "marimekko-basic",
  "language": "python",
  "library": "bokeh",
  "page": "https://anyplot.ai/marimekko-basic/python/bokeh",
  "hub": "https://anyplot.ai/marimekko-basic",
  "code_json": "https://api.anyplot.ai/specs/marimekko-basic/bokeh/code",
  "spec_json": "https://api.anyplot.ai/specs/marimekko-basic",
  "render_light_png": "https://storage.googleapis.com/anyplot-images/plots/marimekko-basic/python/bokeh/plot-light.png",
  "render_dark_png": "https://storage.googleapis.com/anyplot-images/plots/marimekko-basic/python/bokeh/plot-dark.png",
  "interactive_light_html": "https://storage.googleapis.com/anyplot-images/plots/marimekko-basic/python/bokeh/plot-light.html",
  "interactive_dark_html": "https://storage.googleapis.com/anyplot-images/plots/marimekko-basic/python/bokeh/plot-dark.html",
  "quality_score": 94.0,
  "license": "MIT",
  "guide": "https://anyplot.ai/llms.txt"
}
Part of Basic Marimekko Chart on anyplot.ai.