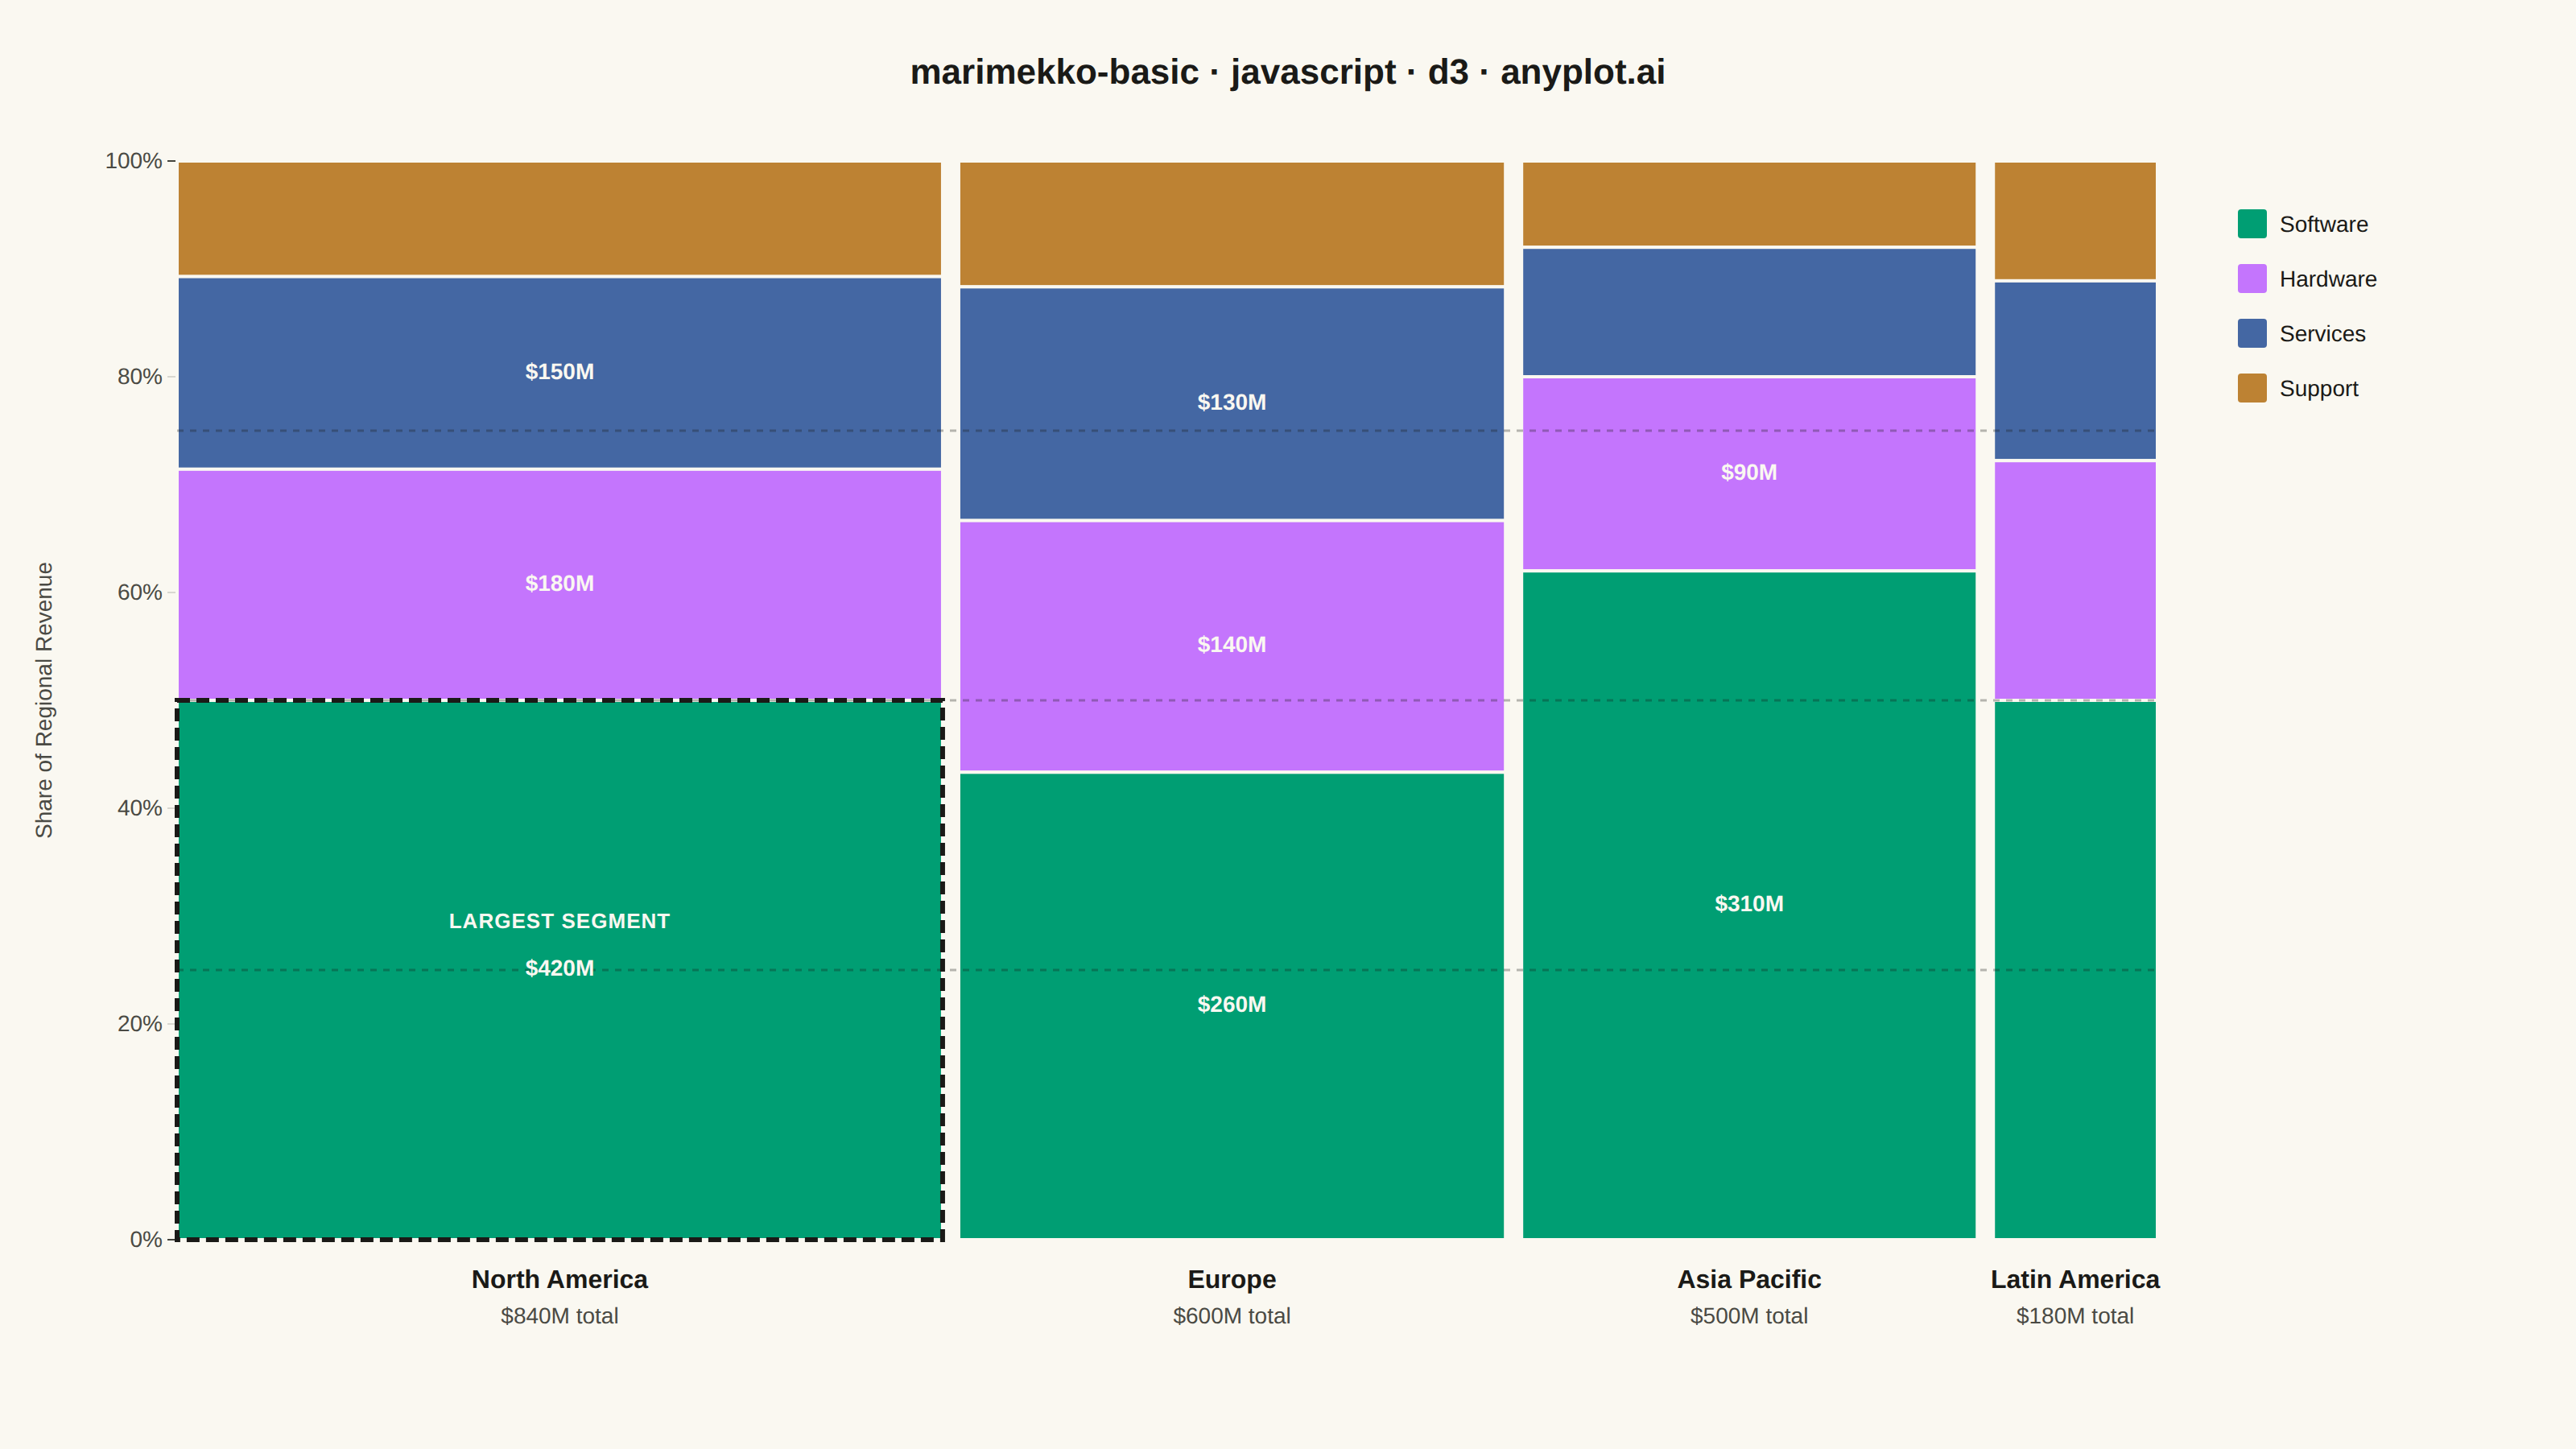
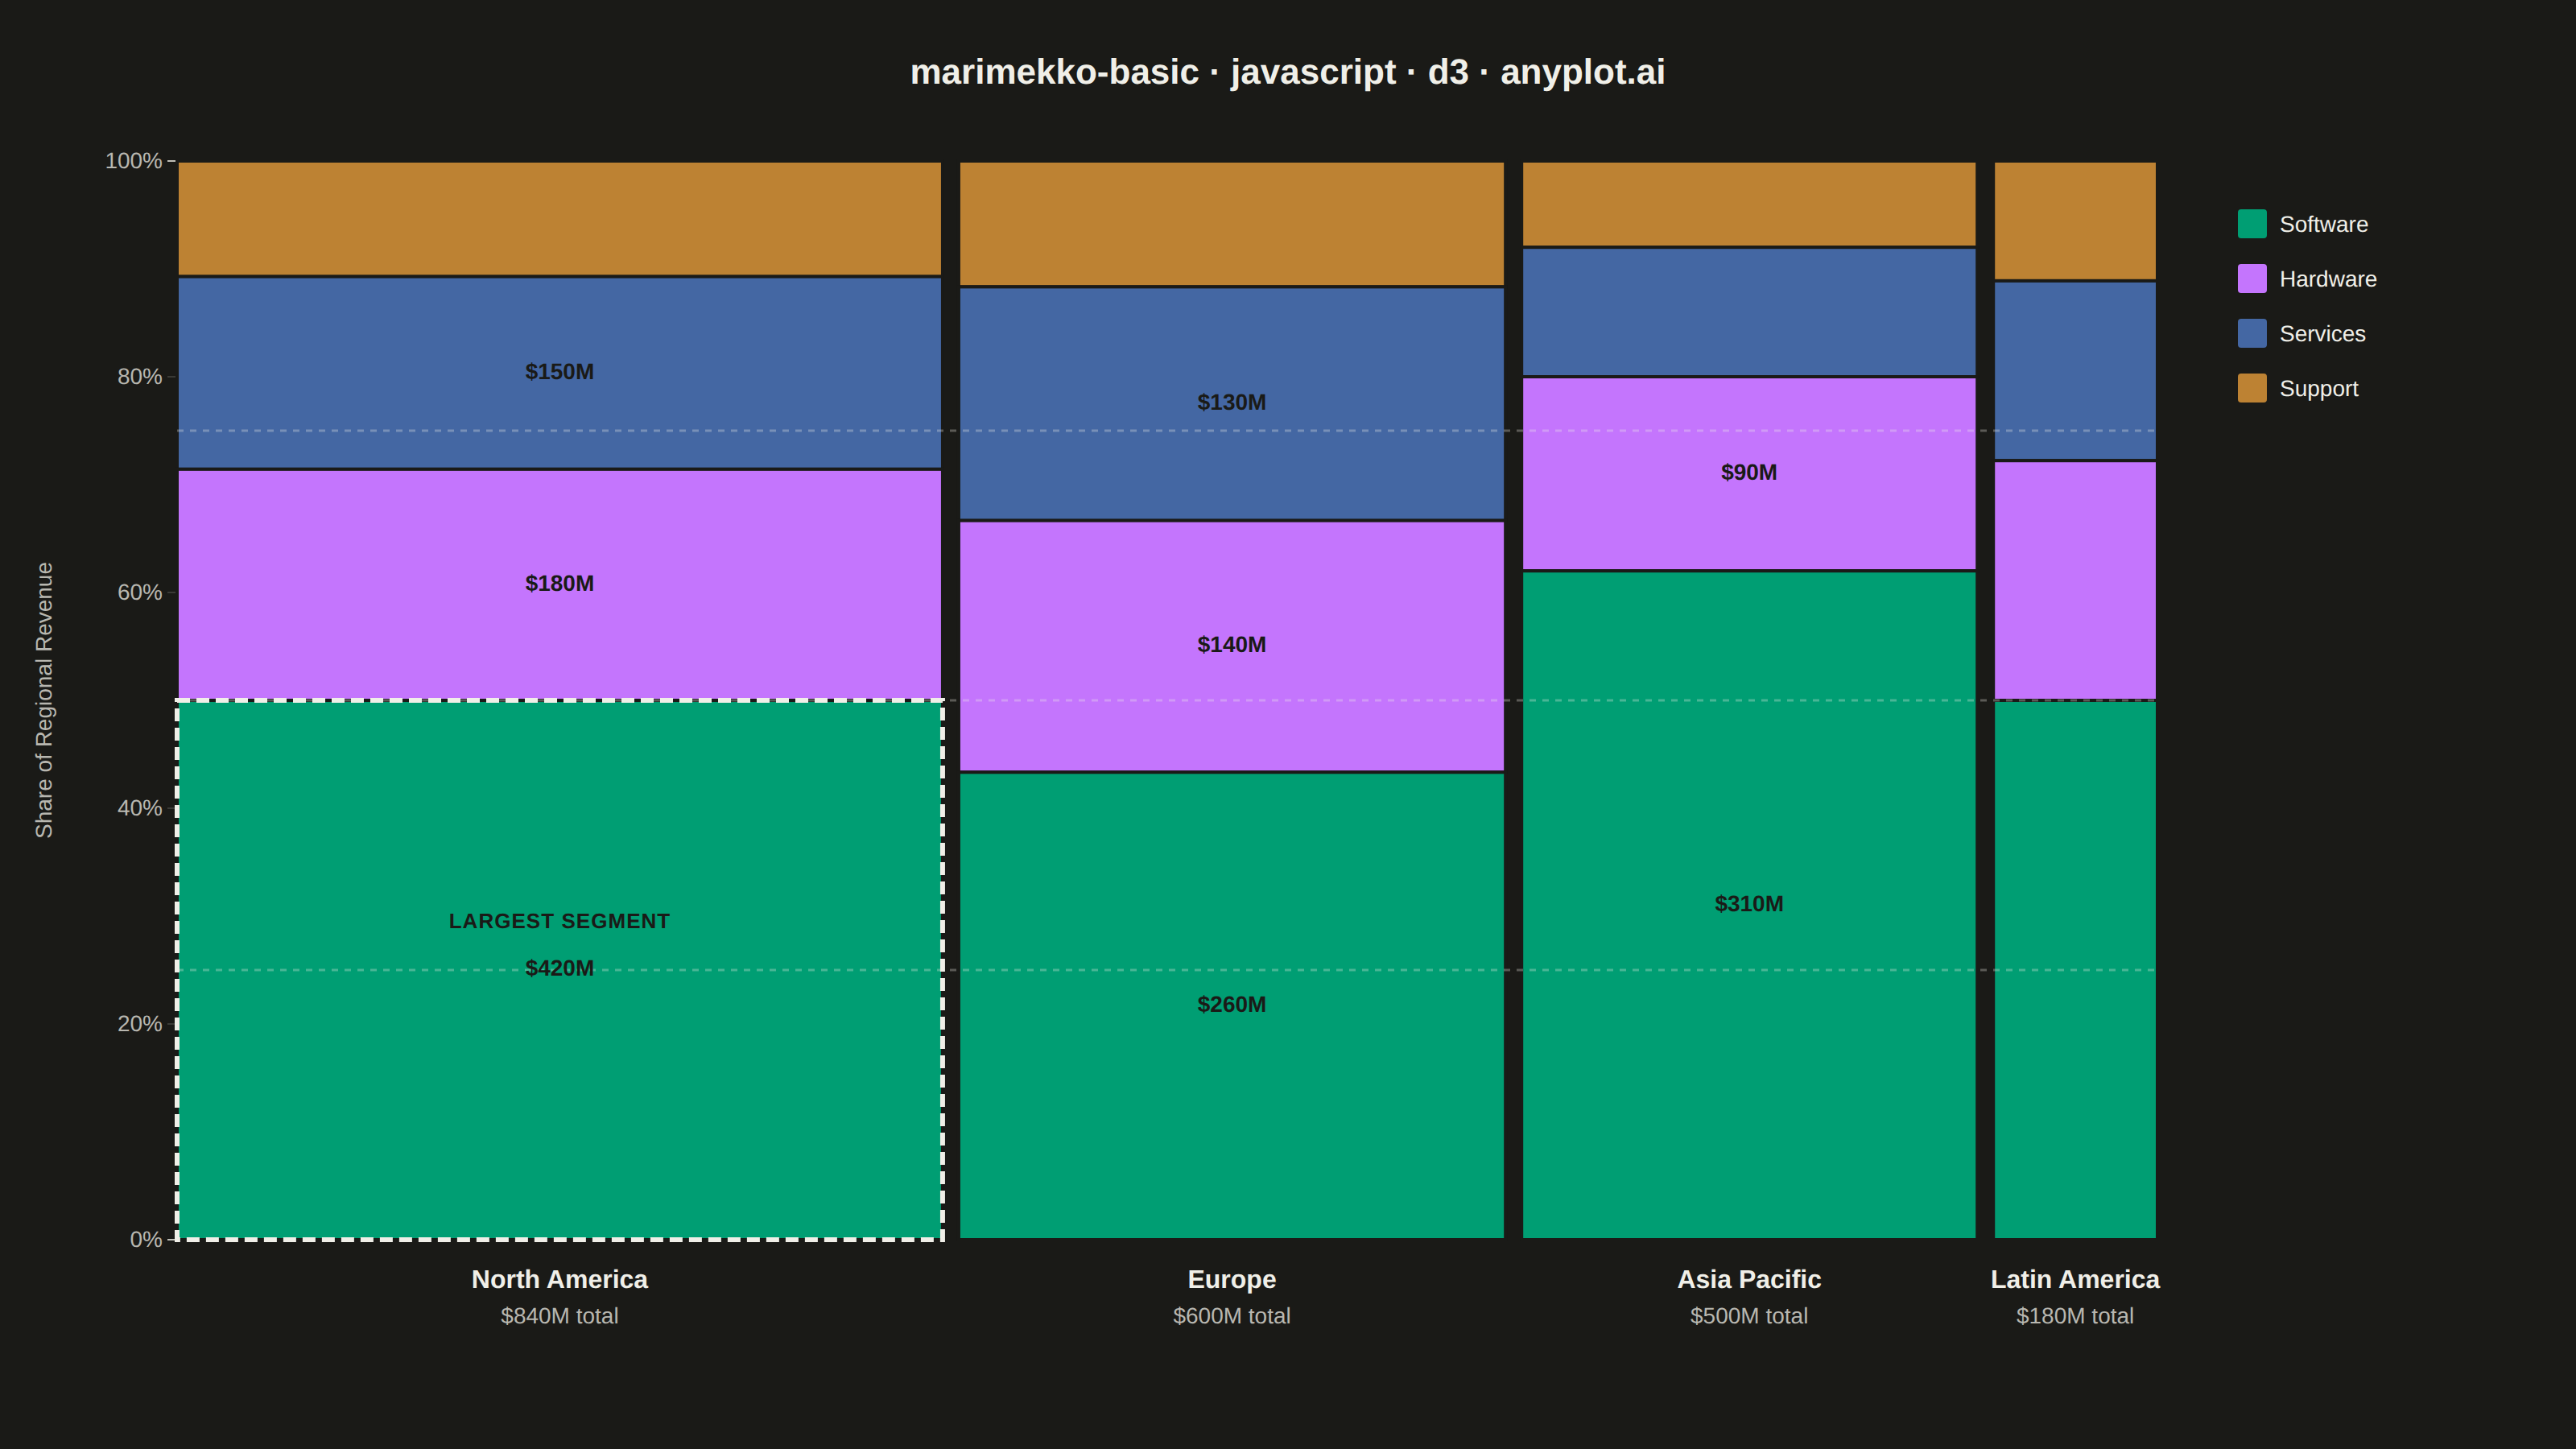
The same plot in 14 other libraries — JavaScript: Chart.js, Apache ECharts, Highcharts, MUI X Charts; Python: Altair, Bokeh, lets-plot, Matplotlib, Plotly, plotnine, Pygal, Seaborn; R: ggplot2; Julia: Makie.jl. Compare all 15 side by side: Basic Marimekko Chart in Python, R, Julia and JavaScript.
A Marimekko chart (also called mekko or mosaic plot) is a stacked bar chart where both the width and height of segments represent data values. This visualization shows two categorical dimensions simultaneously with proportional areas, making it ideal for understanding how parts relate to wholes across categories of different sizes.
// anyplot.ai
// marimekko-basic: Basic Marimekko Chart
// Library: d3 7.9.0 | JavaScript 22.23.1
// Quality: 90/100 | Created: 2026-07-24

const t = window.ANYPLOT_TOKENS;
const { width, height } = window.ANYPLOT_SIZE;
const margin = { top: 100, right: 260, bottom: 130, left: 110 };
const iw = width - margin.left - margin.right;
const ih = height - margin.top - margin.bottom;

// --- Data (in-memory, deterministic) ----------------------------------------
// Revenue ($M) by region (bar width) and product line (segment height share)
const yCategories = ["Software", "Hardware", "Services", "Support"];
const data = [
  { x: "North America", values: { Software: 420, Hardware: 180, Services: 150, Support: 90 } },
  { x: "Europe", values: { Software: 260, Hardware: 140, Services: 130, Support: 70 } },
  { x: "Asia Pacific", values: { Software: 310, Hardware: 90, Services: 60, Support: 40 } },
  { x: "Latin America", values: { Software: 90, Hardware: 40, Services: 30, Support: 20 } },
];

// Columns pre-sorted largest-to-smallest total revenue, reinforcing an
// implicit left-to-right visual hierarchy.
const regionTotal = (d) => d3.sum(yCategories, (cat) => d.values[cat]);
const sortedData = [...data].sort((a, b) => regionTotal(b) - regionTotal(a));

// --- d3-hierarchy layout: dice-then-slice treemap tiling ---------------------
// The canonical D3 technique for a Marimekko/mosaic layout: build a two-level
// hierarchy (region -> product line) and tile it with a custom function that
// dices the root's children (columns, widths proportional to region totals)
// then slices each column's children (segments, heights proportional to share).
// Stacking order matches a conventional stacked bar: first category at the
// bottom of each column, so product lines are fed to the slice in reverse.
const stackOrder = [...yCategories].reverse();
const root = d3
  .hierarchy({
    children: sortedData.map((d) => ({
      name: d.x,
      children: stackOrder.map((cat) => ({ name: cat, cat, value: d.values[cat] })),
    })),
  })
  .sum((d) => d.value);

const gap = 10;
function marimekkoTile(node, x0, y0, x1, y1) {
  if (node.depth === 0) {
    const n = node.children.length;
    d3.treemapDice(node, x0, y0, x1 - gap * (n - 1), y1);
    let shift = 0;
    node.children.forEach((c, i) => {
      c.x0 += shift;
      c.x1 += shift;
      if (i < n - 1) shift += gap;
    });
  } else {
    d3.treemapSlice(node, x0, y0, x1, y1);
  }
}

d3.treemap().tile(marimekkoTile).size([iw, ih])(root);

const columns = root.children; // depth-1 nodes: one per region
const leaves = root.leaves(); // depth-2 nodes: one per region/product-line segment
const color = d3.scaleOrdinal().domain(yCategories).range(t.palette);

// Single largest segment across the whole dataset — the design flourish
// called out for review: emphasize the key insight instead of a plain default.
const largestLeaf = leaves.reduce((a, b) => (b.value > a.value ? b : a));

// --- SVG mount ----------------------------------------------------------------
const svg = d3.select("#container").append("svg").attr("width", width).attr("height", height);
const g = svg.append("g").attr("transform", `translate(${margin.left},${margin.top})`);

// --- Y axis (share of column revenue) ------------------------------------------
const shareScale = d3.scaleLinear().domain([0, 1]).range([ih, 0]);
const yAxis = g.append("g").call(d3.axisLeft(shareScale).ticks(4).tickFormat(d3.format(".0%")));
yAxis.selectAll("text").attr("fill", t.inkSoft).style("font-size", "14px");
yAxis.selectAll("line").attr("stroke", t.grid);
yAxis.select(".domain").attr("stroke", t.inkSoft);

g.append("text")
  .attr("transform", "rotate(-90)")
  .attr("x", -ih / 2)
  .attr("y", -78)
  .attr("text-anchor", "middle")
  .attr("fill", t.inkSoft)
  .style("font-size", "14px")
  .text("Share of Regional Revenue");

// --- Columns (variable-width stacked bars) -------------------------------------
g.selectAll("rect.segment")
  .data(leaves)
  .join("rect")
  .attr("class", "segment")
  .attr("x", (d) => d.x0)
  .attr("y", (d) => d.y0)
  .attr("width", (d) => d.x1 - d.x0)
  .attr("height", (d) => d.y1 - d.y0)
  .attr("fill", (d) => color(d.data.cat))
  .attr("stroke", t.pageBg)
  .attr("stroke-width", 2);

// --- Reference gridlines (quartile shares), drawn above the bars at low ------
// opacity so they read as an intentional reference layer instead of dead code
// hidden underneath the opaque columns.
g.selectAll("line.grid")
  .data([0.25, 0.5, 0.75])
  .join("line")
  .attr("class", "grid")
  .attr("x1", 0)
  .attr("x2", iw)
  .attr("y1", (d) => shareScale(d))
  .attr("y2", (d) => shareScale(d))
  .attr("stroke", t.ink)
  .attr("stroke-width", 1.5)
  .attr("stroke-dasharray", "4,4")
  .attr("opacity", 0.3);

// Dashed outline calling out the single largest segment in the dataset.
g.append("rect")
  .attr("x", largestLeaf.x0)
  .attr("y", largestLeaf.y0)
  .attr("width", largestLeaf.x1 - largestLeaf.x0)
  .attr("height", largestLeaf.y1 - largestLeaf.y0)
  .attr("fill", "none")
  .attr("stroke", t.ink)
  .attr("stroke-width", 3)
  .attr("stroke-dasharray", "8,4");

// Value labels on segments large enough to hold them legibly
const labeled = leaves.filter((d) => d.x1 - d.x0 > 140 && d.y1 - d.y0 > 90);
g.selectAll("text.segment-label")
  .data(labeled)
  .join("text")
  .attr("class", "segment-label")
  .attr("x", (d) => (d.x0 + d.x1) / 2)
  .attr("y", (d) => (d.y0 + d.y1) / 2)
  .attr("text-anchor", "middle")
  .attr("dominant-baseline", "middle")
  .attr("fill", t.pageBg)
  .style("font-size", "14px")
  .style("font-weight", "600")
  .text((d) => `$${d3.format(",")(d.value)}M`);

// Callout badge for the largest segment, stacked above its value label.
g.append("text")
  .attr("x", (largestLeaf.x0 + largestLeaf.x1) / 2)
  .attr("y", (largestLeaf.y0 + largestLeaf.y1) / 2 - 26)
  .attr("text-anchor", "middle")
  .attr("fill", t.pageBg)
  .style("font-size", "13px")
  .style("font-weight", "700")
  .style("letter-spacing", "0.04em")
  .text("LARGEST SEGMENT");

// --- X-axis labels (region name + column total, centered under each bar) ------
const xLabels = g
  .selectAll("g.x-label")
  .data(columns)
  .join("g")
  .attr("transform", (d) => `translate(${(d.x0 + d.x1) / 2},${ih})`);

xLabels
  .append("text")
  .attr("y", 30)
  .attr("text-anchor", "middle")
  .attr("fill", t.ink)
  .style("font-size", "16px")
  .style("font-weight", "600")
  .text((d) => d.data.name);

xLabels
  .append("text")
  .attr("y", 52)
  .attr("text-anchor", "middle")
  .attr("fill", t.inkSoft)
  .style("font-size", "14px")
  .text((d) => `$${d3.format(",")(d.value)}M total`);

// --- Legend ---------------------------------------------------------------------
const legend = svg
  .append("g")
  .attr("transform", `translate(${margin.left + iw + 50},${margin.top + 30})`);

const legendItems = legend
  .selectAll("g.legend-item")
  .data(yCategories)
  .join("g")
  .attr("class", "legend-item")
  .attr("transform", (d, i) => `translate(0,${i * 34})`);

legendItems
  .append("rect")
  .attr("width", 18)
  .attr("height", 18)
  .attr("rx", 2)
  .attr("fill", (d) => color(d));

legendItems
  .append("text")
  .attr("x", 26)
  .attr("y", 14)
  .attr("fill", t.ink)
  .style("font-size", "14px")
  .text((d) => d);

// --- Title -----------------------------------------------------------------------
svg
  .append("text")
  .attr("x", width / 2)
  .attr("y", 52)
  .attr("text-anchor", "middle")
  .attr("fill", t.ink)
  .style("font-size", "22px")
  .style("font-weight", "600")
  .text("marimekko-basic · javascript · d3 · anyplot.ai");
Runnable source as JSON, for any HTTP client: https://api.anyplot.ai/specs/marimekko-basic/d3/code. Any spec id and library id listed in llms-full.txt fit the same URL shape; every URL below is complete and callable.
{
  "spec_id": "marimekko-basic",
  "language": "javascript",
  "library": "d3",
  "page": "https://anyplot.ai/marimekko-basic/javascript/d3",
  "hub": "https://anyplot.ai/marimekko-basic",
  "code_json": "https://api.anyplot.ai/specs/marimekko-basic/d3/code",
  "spec_json": "https://api.anyplot.ai/specs/marimekko-basic",
  "render_light_png": "https://storage.googleapis.com/anyplot-images/plots/marimekko-basic/javascript/d3/plot-light.png",
  "render_dark_png": "https://storage.googleapis.com/anyplot-images/plots/marimekko-basic/javascript/d3/plot-dark.png",
  "interactive_light_html": "https://storage.googleapis.com/anyplot-images/plots/marimekko-basic/javascript/d3/plot-light.html",
  "interactive_dark_html": "https://storage.googleapis.com/anyplot-images/plots/marimekko-basic/javascript/d3/plot-dark.html",
  "quality_score": 90.0,
  "license": "MIT",
  "guide": "https://anyplot.ai/llms.txt"
}
Part of Basic Marimekko Chart on anyplot.ai.