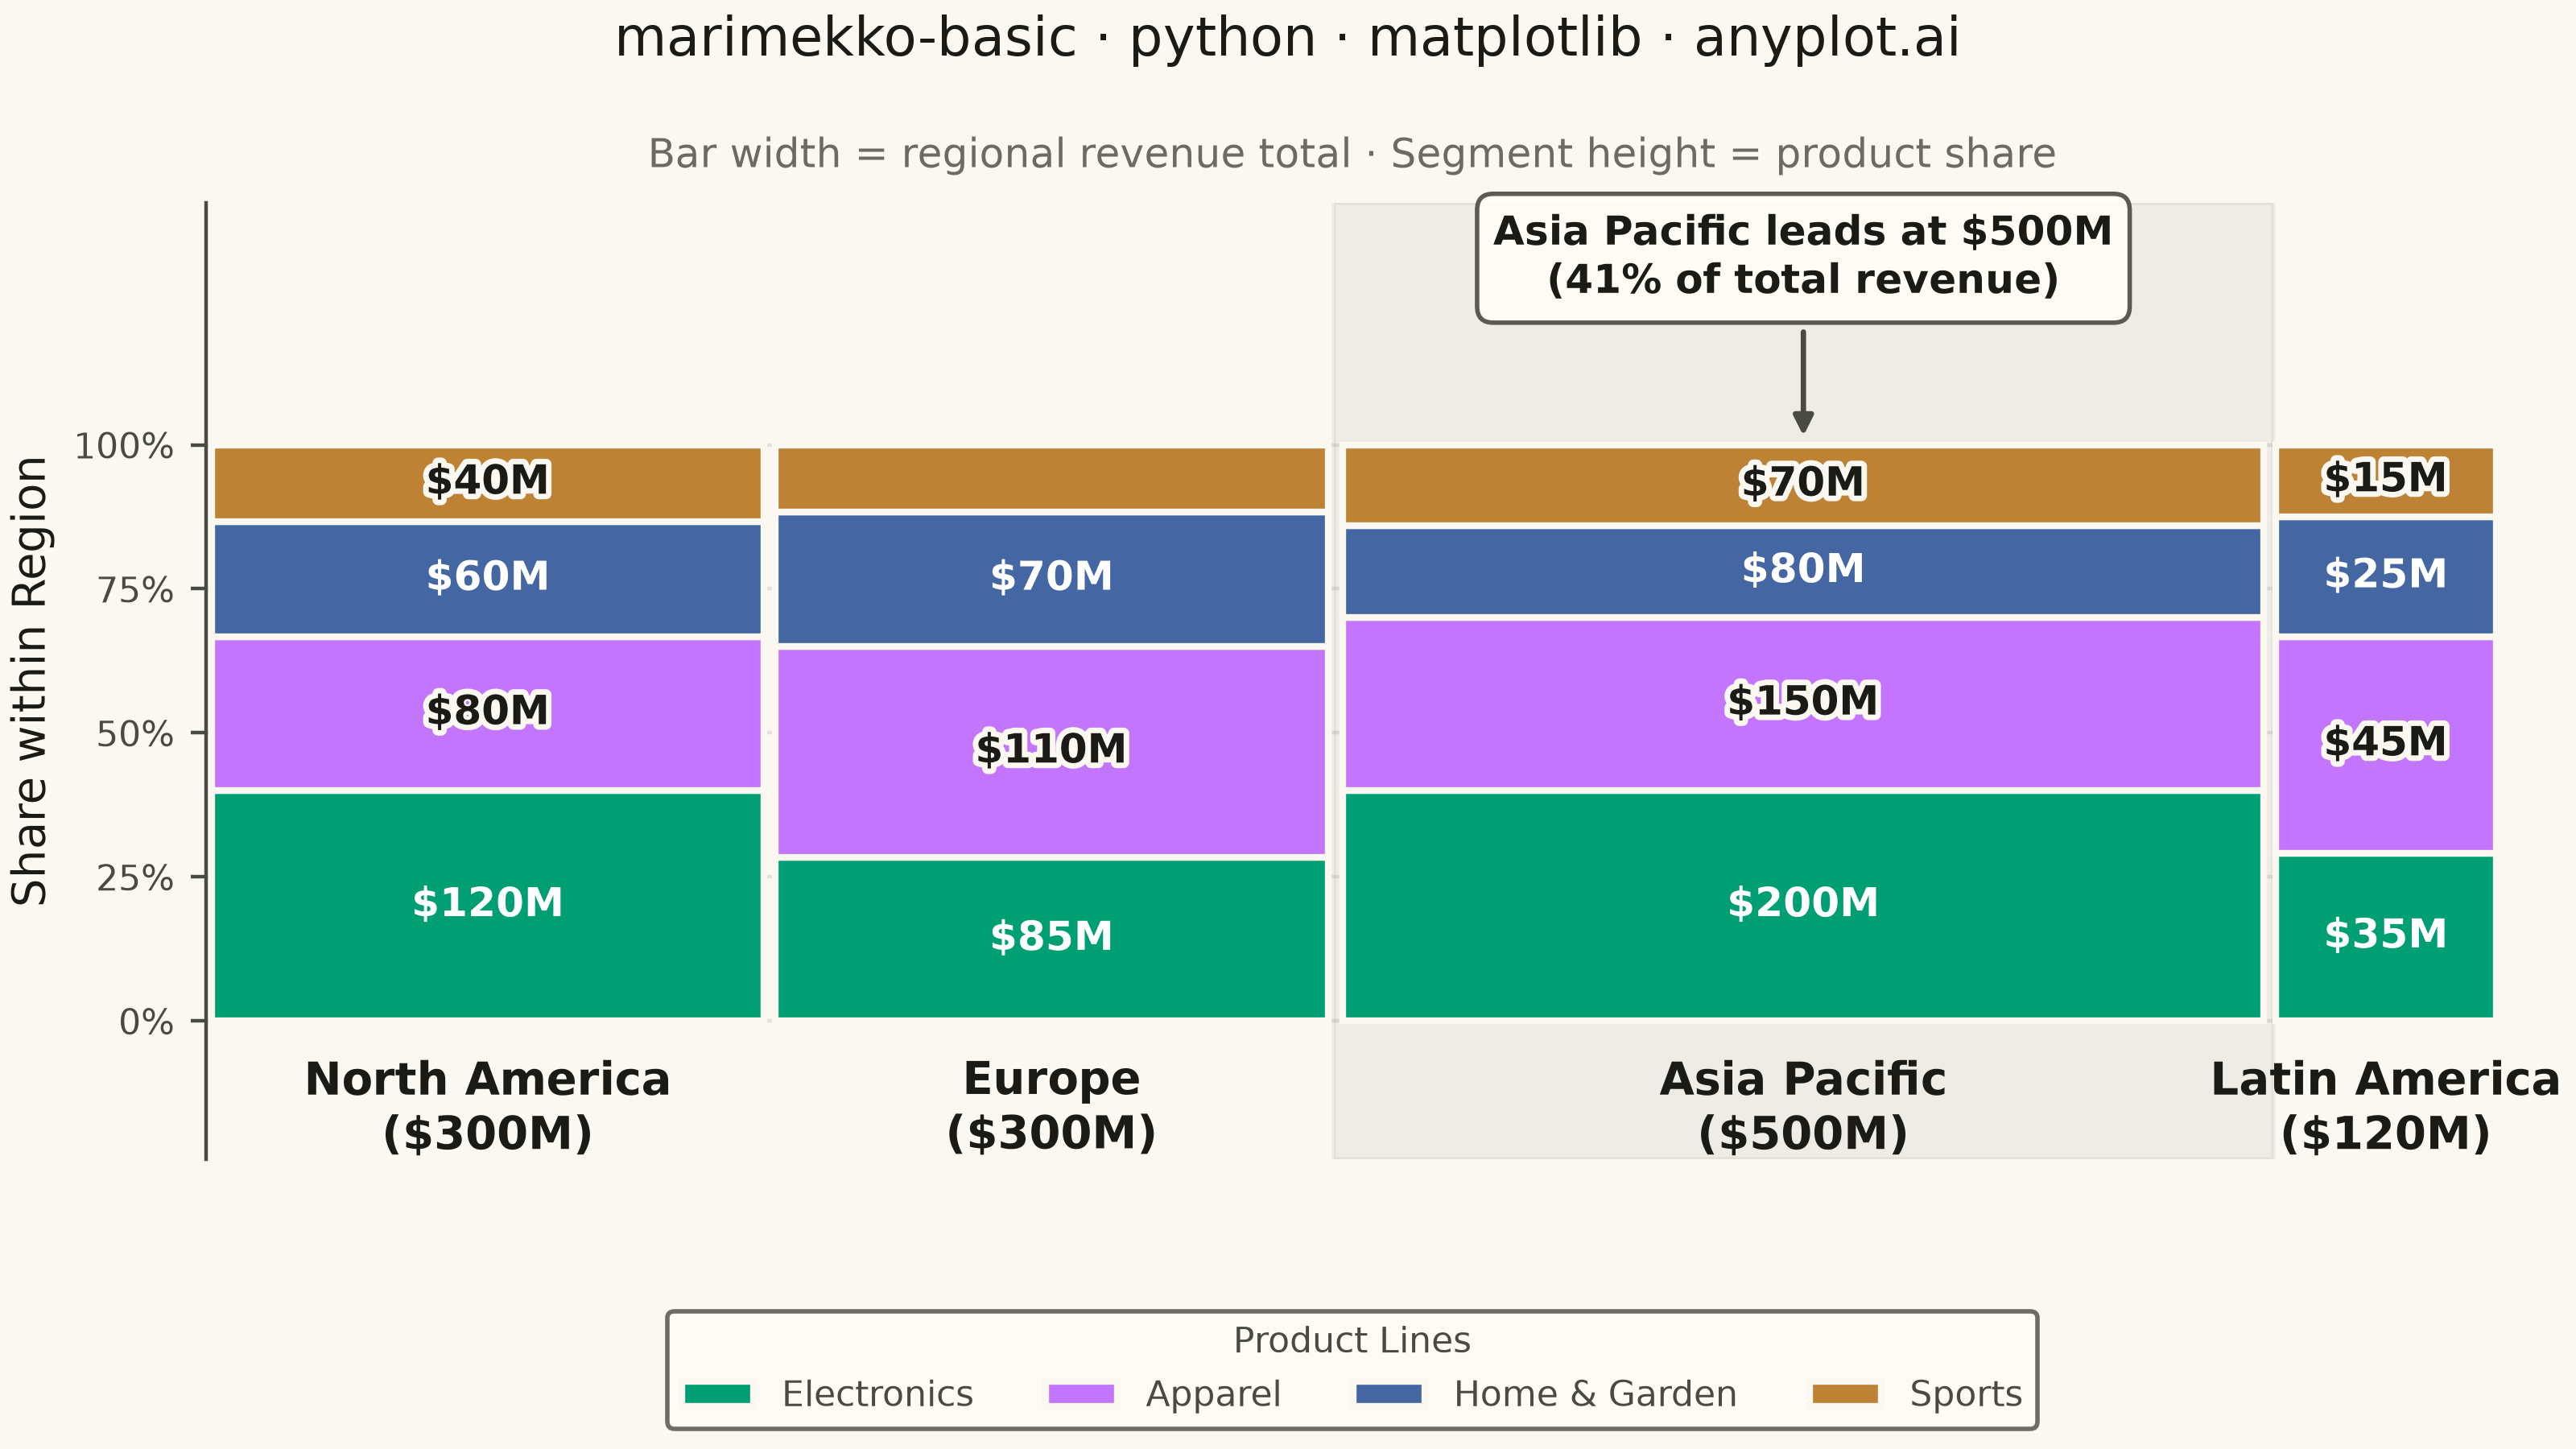
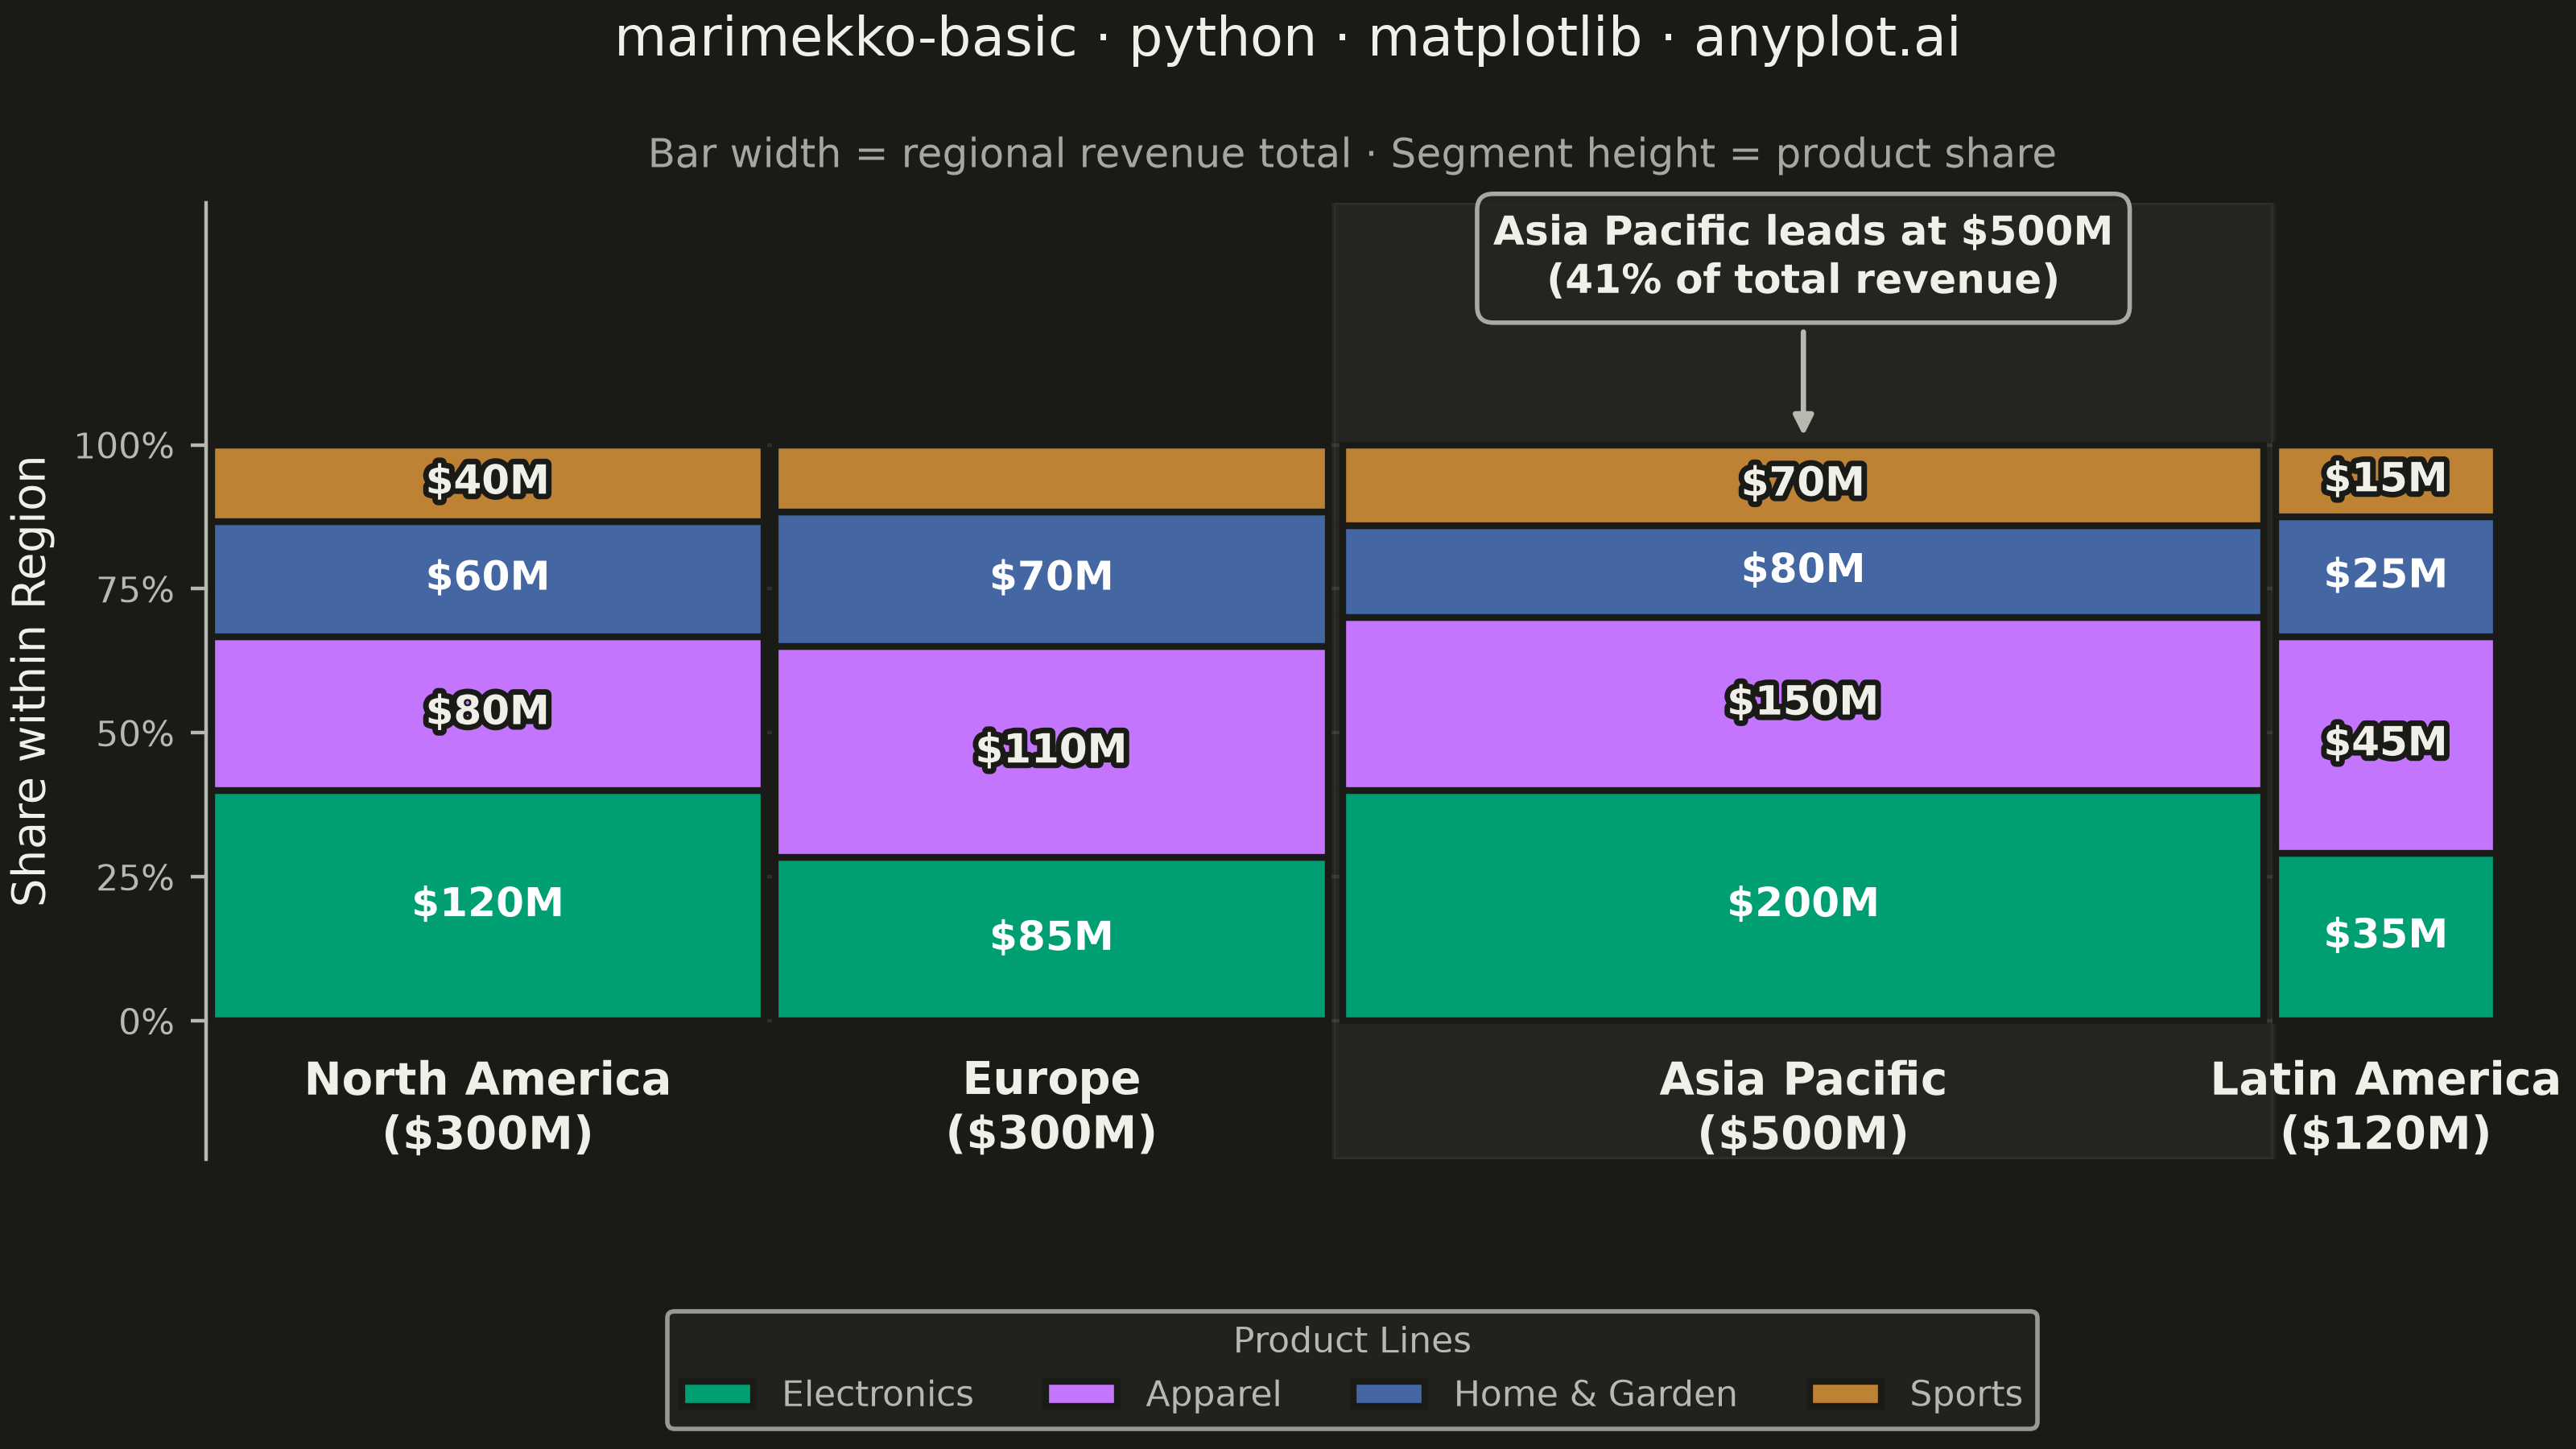
A Marimekko chart (also called mekko or mosaic plot) is a stacked bar chart where both the width and height of segments represent data values. This visualization shows two categorical dimensions simultaneously with proportional areas, making it ideal for understanding how parts relate to wholes across categories of different sizes.
""" anyplot.ai
marimekko-basic: Basic Marimekko Chart
Library: matplotlib 3.11.1 | Python 3.13.14
Quality: 92/100 | Updated: 2026-07-24
"""

import os

import matplotlib.patheffects as pe
import matplotlib.pyplot as plt
import numpy as np


# Theme tokens
THEME = os.getenv("ANYPLOT_THEME", "light")
PAGE_BG = "#FAF8F1" if THEME == "light" else "#1A1A17"
ELEVATED_BG = "#FFFDF6" if THEME == "light" else "#242420"
INK = "#1A1A17" if THEME == "light" else "#F0EFE8"
INK_SOFT = "#4A4A44" if THEME == "light" else "#B8B7B0"
INK_MUTED = "#6B6A63" if THEME == "light" else "#A8A79F"

# Data: Market share by region (x-category) and product line (y-category)
regions = ["North America", "Europe", "Asia Pacific", "Latin America"]
products = ["Electronics", "Apparel", "Home & Garden", "Sports"]

# Values matrix: rows = products, columns = regions
# Each column total determines that region's bar width
values = np.array(
    [
        [120, 85, 200, 35],  # Electronics
        [80, 110, 150, 45],  # Apparel
        [60, 70, 80, 25],  # Home & Garden
        [40, 35, 70, 15],  # Sports
    ]
)

# Imprint palette (positions 1-4 in canonical order)
IMPRINT = ["#009E73", "#C475FD", "#4467A3", "#BD8233"]
# Per-segment label contrast, chosen by contrast ratio against each fill (WCAG large-text >=3:1):
# green/blue are dark enough for white text; lavender/ochre read better with dark ink text.
label_colors = ["white", INK, "white", INK]

# Calculate bar widths (proportional to column totals)
column_totals = values.sum(axis=0)
total = column_totals.sum()
bar_widths = column_totals / total
cum_widths = np.concatenate([[0], np.cumsum(bar_widths)[:-1]])

# Focal region: the dominant market by total revenue
focal_idx = int(np.argmax(column_totals))
focal_share = column_totals[focal_idx] / total * 100

# Plot
fig, ax = plt.subplots(figsize=(8, 4.5), dpi=400, facecolor=PAGE_BG)
ax.set_facecolor(PAGE_BG)

# Subtle highlight band behind the focal region to establish visual hierarchy
ax.axvspan(cum_widths[focal_idx], cum_widths[focal_idx] + bar_widths[focal_idx], color=INK, alpha=0.05, zorder=0)

# Cream halo crisps up dark ink labels on the lighter fills; white labels on the
# dark/saturated fills already clear WCAG large-text contrast without a stroke,
# and a light-on-light halo there would blur rather than help.
ink_stroke = [pe.withStroke(linewidth=2.5, foreground=PAGE_BG)]

for i, (product, color, label_color) in enumerate(zip(products, IMPRINT, label_colors, strict=True)):
    heights = values[i] / column_totals
    bottoms = values[:i].sum(axis=0) / column_totals if i > 0 else np.zeros(len(regions))

    for j in range(len(regions)):
        ax.bar(
            cum_widths[j] + bar_widths[j] / 2,
            heights[j],
            width=bar_widths[j] * 0.98,
            bottom=bottoms[j],
            color=color,
            edgecolor=PAGE_BG,
            linewidth=1.5,
            label=product if j == 0 else None,
            zorder=2,
        )

        if heights[j] > 0.12:
            ax.text(
                cum_widths[j] + bar_widths[j] / 2,
                bottoms[j] + heights[j] / 2,
                f"${values[i, j]}M",
                ha="center",
                va="center",
                fontsize=9,
                fontweight="bold",
                color=label_color,
                path_effects=ink_stroke if label_color == INK else None,
                zorder=3,
            )

# Region labels below bars
for j, region in enumerate(regions):
    ax.text(
        cum_widths[j] + bar_widths[j] / 2,
        -0.06,
        f"{region}\n(${column_totals[j]:.0f}M)",
        ha="center",
        va="top",
        fontsize=10,
        fontweight="bold",
        color=INK,
    )

# Callout: emphasize the dominant region's revenue share (the key insight)
ax.annotate(
    f"{regions[focal_idx]} leads at ${column_totals[focal_idx]:.0f}M\n({focal_share:.0f}% of total revenue)",
    xy=(cum_widths[focal_idx] + bar_widths[focal_idx] / 2, 1.0),
    xytext=(cum_widths[focal_idx] + bar_widths[focal_idx] / 2, 1.24),
    ha="center",
    va="bottom",
    fontsize=9,
    fontweight="bold",
    color=INK,
    arrowprops={"arrowstyle": "-|>", "color": INK_SOFT, "lw": 1.2},
    bbox={"boxstyle": "round,pad=0.4", "facecolor": ELEVATED_BG, "edgecolor": INK_SOFT, "alpha": 0.9},
    zorder=4,
)

# Style
ax.set_xlim(0, 1)
ax.set_ylim(-0.24, 1.42)
ax.set_ylabel("Share within Region", fontsize=10, color=INK)

title = "marimekko-basic · python · matplotlib · anyplot.ai"
fig.suptitle(title, fontsize=12, fontweight="medium", color=INK, y=0.99)
ax.set_title("Bar width = regional revenue total · Segment height = product share", fontsize=9, color=INK_MUTED, pad=8)

ax.set_yticks([0, 0.25, 0.5, 0.75, 1.0])
ax.set_yticklabels(["0%", "25%", "50%", "75%", "100%"])
ax.tick_params(axis="y", labelsize=8, colors=INK_SOFT)
ax.set_xticks([])

# Legend below the chart, horizontal layout
leg = ax.legend(
    loc="upper center",
    bbox_to_anchor=(0.5, -0.14),
    ncol=len(products),
    fontsize=8,
    title="Product Lines",
    title_fontsize=8,
    frameon=True,
)
leg.get_frame().set_facecolor(ELEVATED_BG)
leg.get_frame().set_edgecolor(INK_SOFT)
plt.setp(leg.get_texts(), color=INK_SOFT)
leg.get_title().set_color(INK_SOFT)

# Grid and spines
ax.yaxis.grid(True, alpha=0.10, linewidth=0.8, color=INK)
ax.set_axisbelow(True)
ax.spines["top"].set_visible(False)
ax.spines["right"].set_visible(False)
ax.spines["bottom"].set_visible(False)
ax.spines["left"].set_color(INK_SOFT)

fig.subplots_adjust(left=0.08, right=0.97, top=0.86, bottom=0.20)

plt.savefig(f"plot-{THEME}.png", dpi=400, facecolor=PAGE_BG)
Runnable source as JSON, for any HTTP client: https://api.anyplot.ai/specs/marimekko-basic/matplotlib/code. Any spec id and library id listed in llms-full.txt fit the same URL shape; every URL below is complete and callable.
{
  "spec_id": "marimekko-basic",
  "language": "python",
  "library": "matplotlib",
  "page": "https://anyplot.ai/marimekko-basic/python/matplotlib",
  "hub": "https://anyplot.ai/marimekko-basic",
  "code_json": "https://api.anyplot.ai/specs/marimekko-basic/matplotlib/code",
  "spec_json": "https://api.anyplot.ai/specs/marimekko-basic",
  "render_light_png": "https://storage.googleapis.com/anyplot-images/plots/marimekko-basic/python/matplotlib/plot-light.png",
  "render_dark_png": "https://storage.googleapis.com/anyplot-images/plots/marimekko-basic/python/matplotlib/plot-dark.png",
  "quality_score": 92.0,
  "license": "MIT",
  "guide": "https://anyplot.ai/llms.txt"
}
Part of Basic Marimekko Chart on anyplot.ai.