The same plot in 14 other libraries — JavaScript: Chart.js, D3.js, Apache ECharts, Highcharts; Python: Altair, Bokeh, lets-plot, Matplotlib, Plotly, plotnine, Pygal, Seaborn; R: ggplot2; Julia: Makie.jl. Compare all 15 side by side: Basic Marimekko Chart in Python, R, Julia and JavaScript.
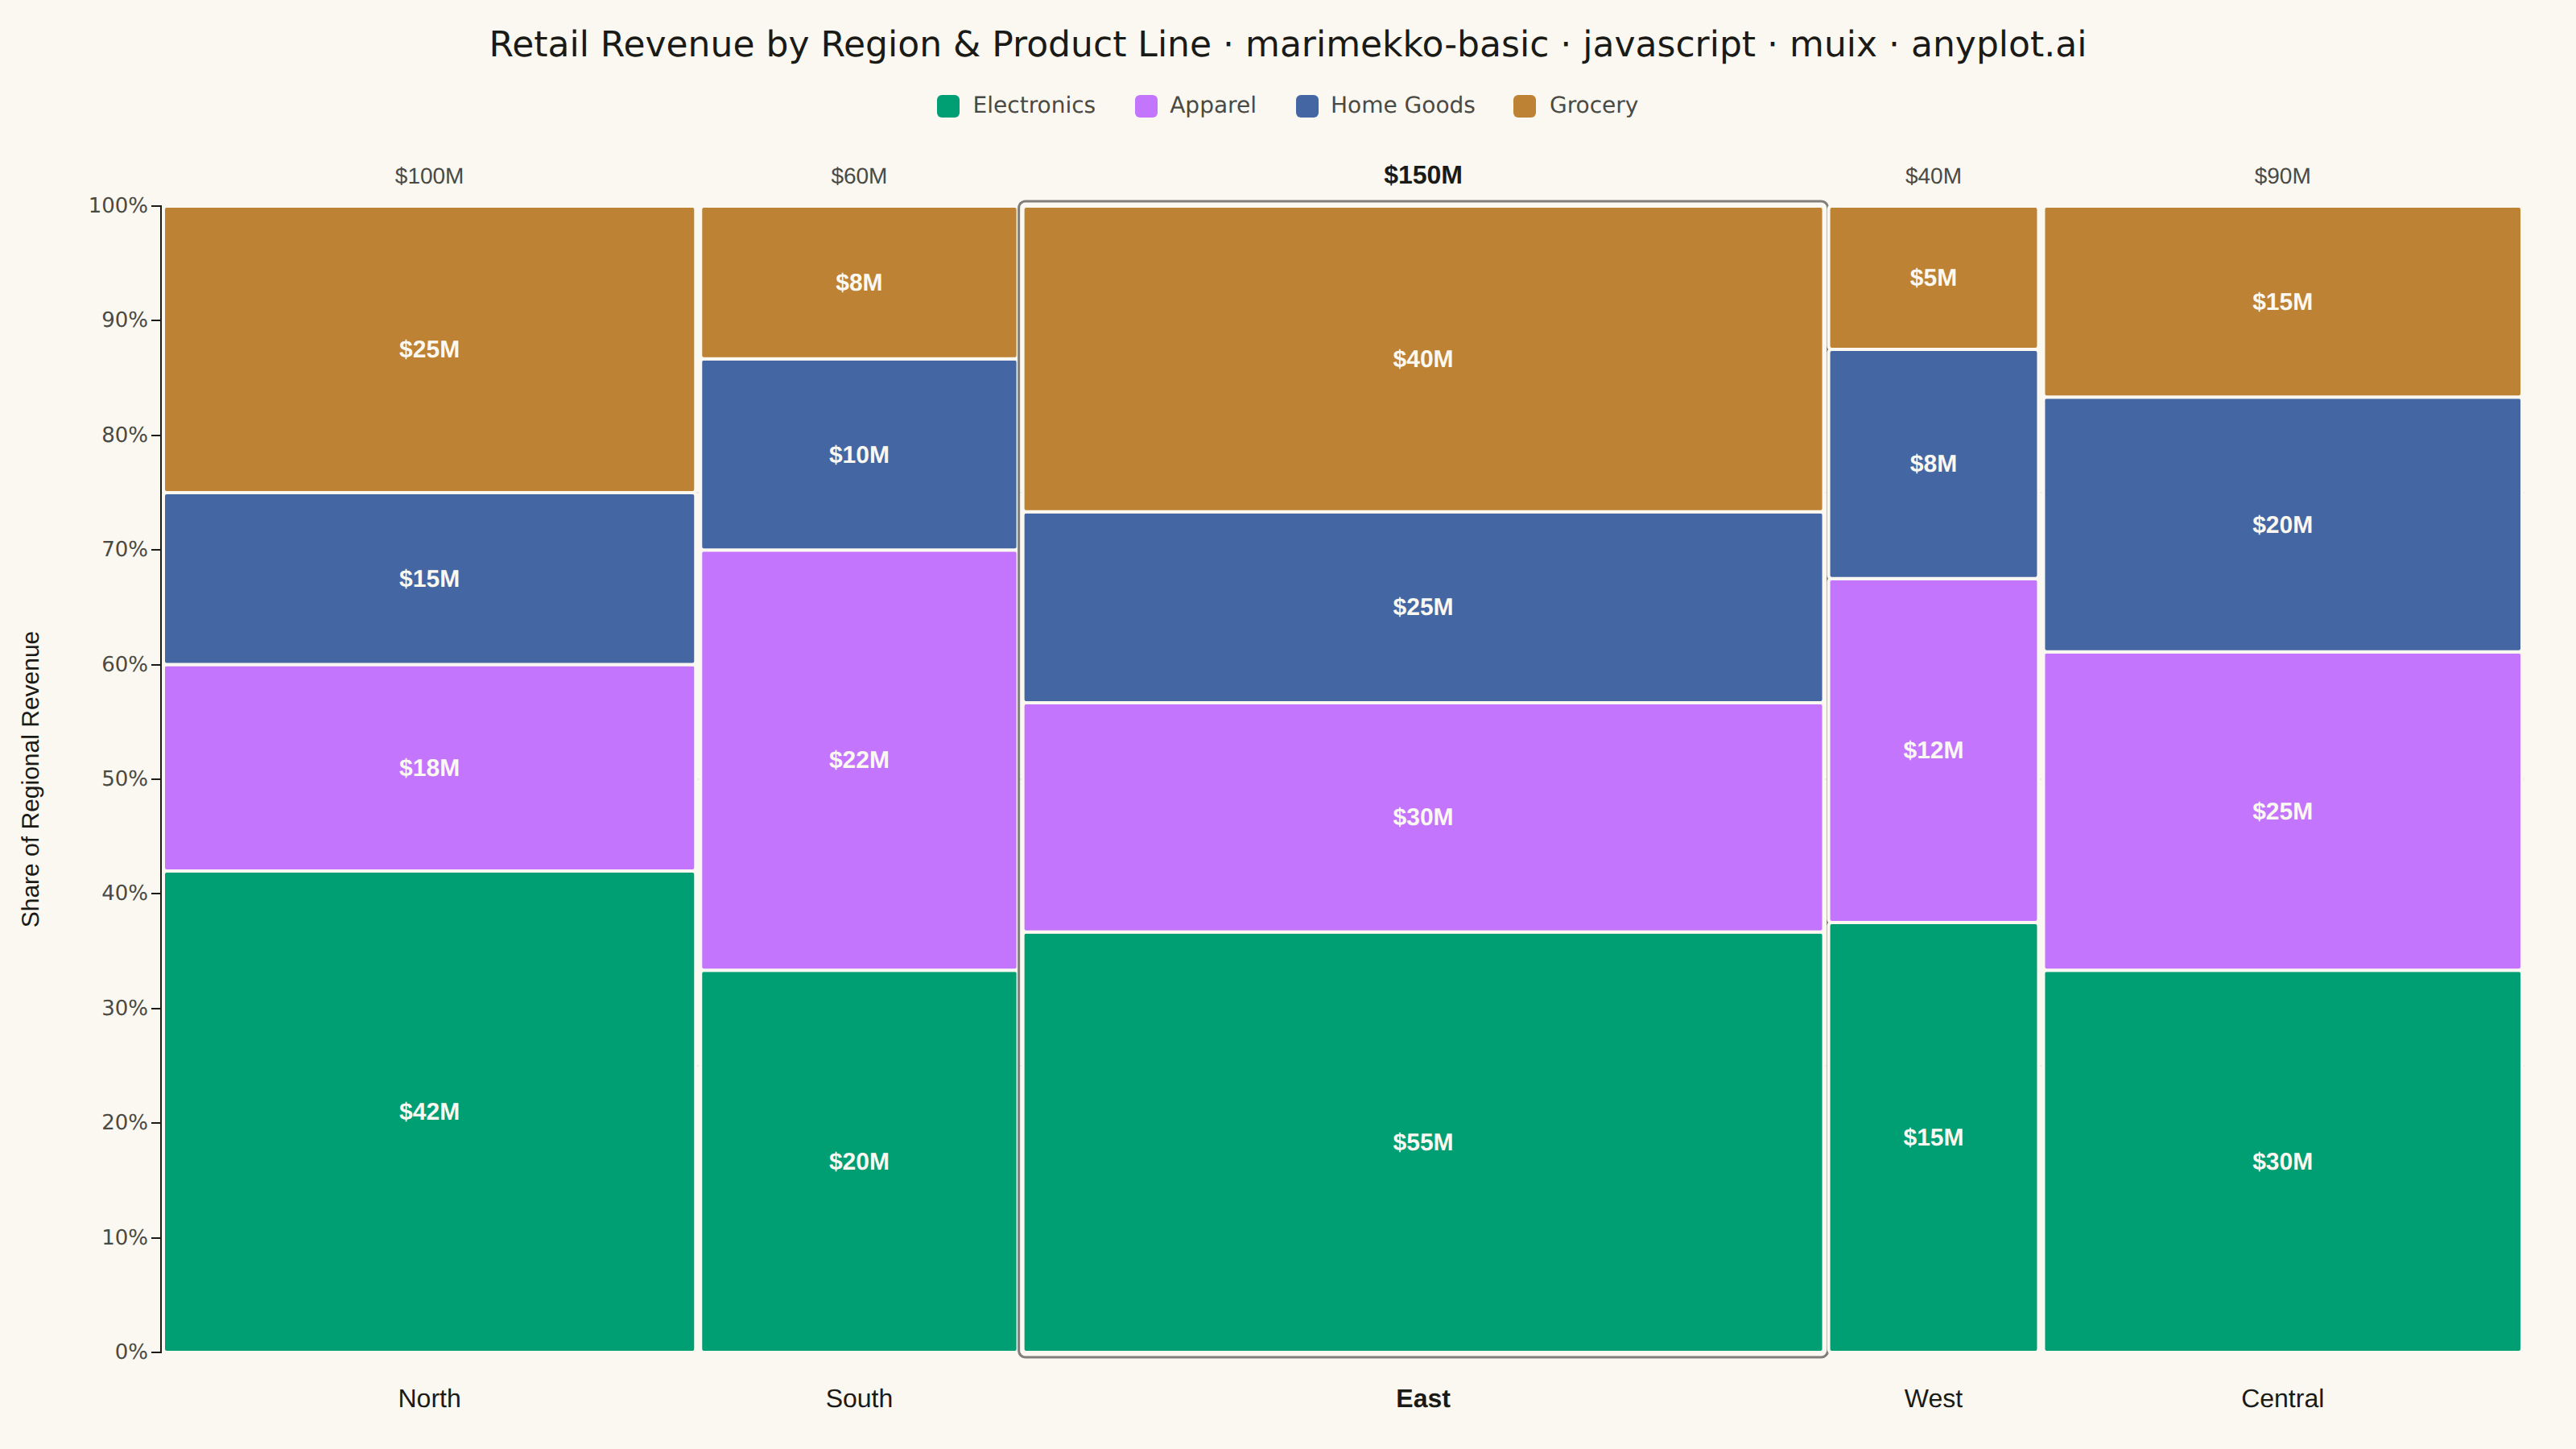
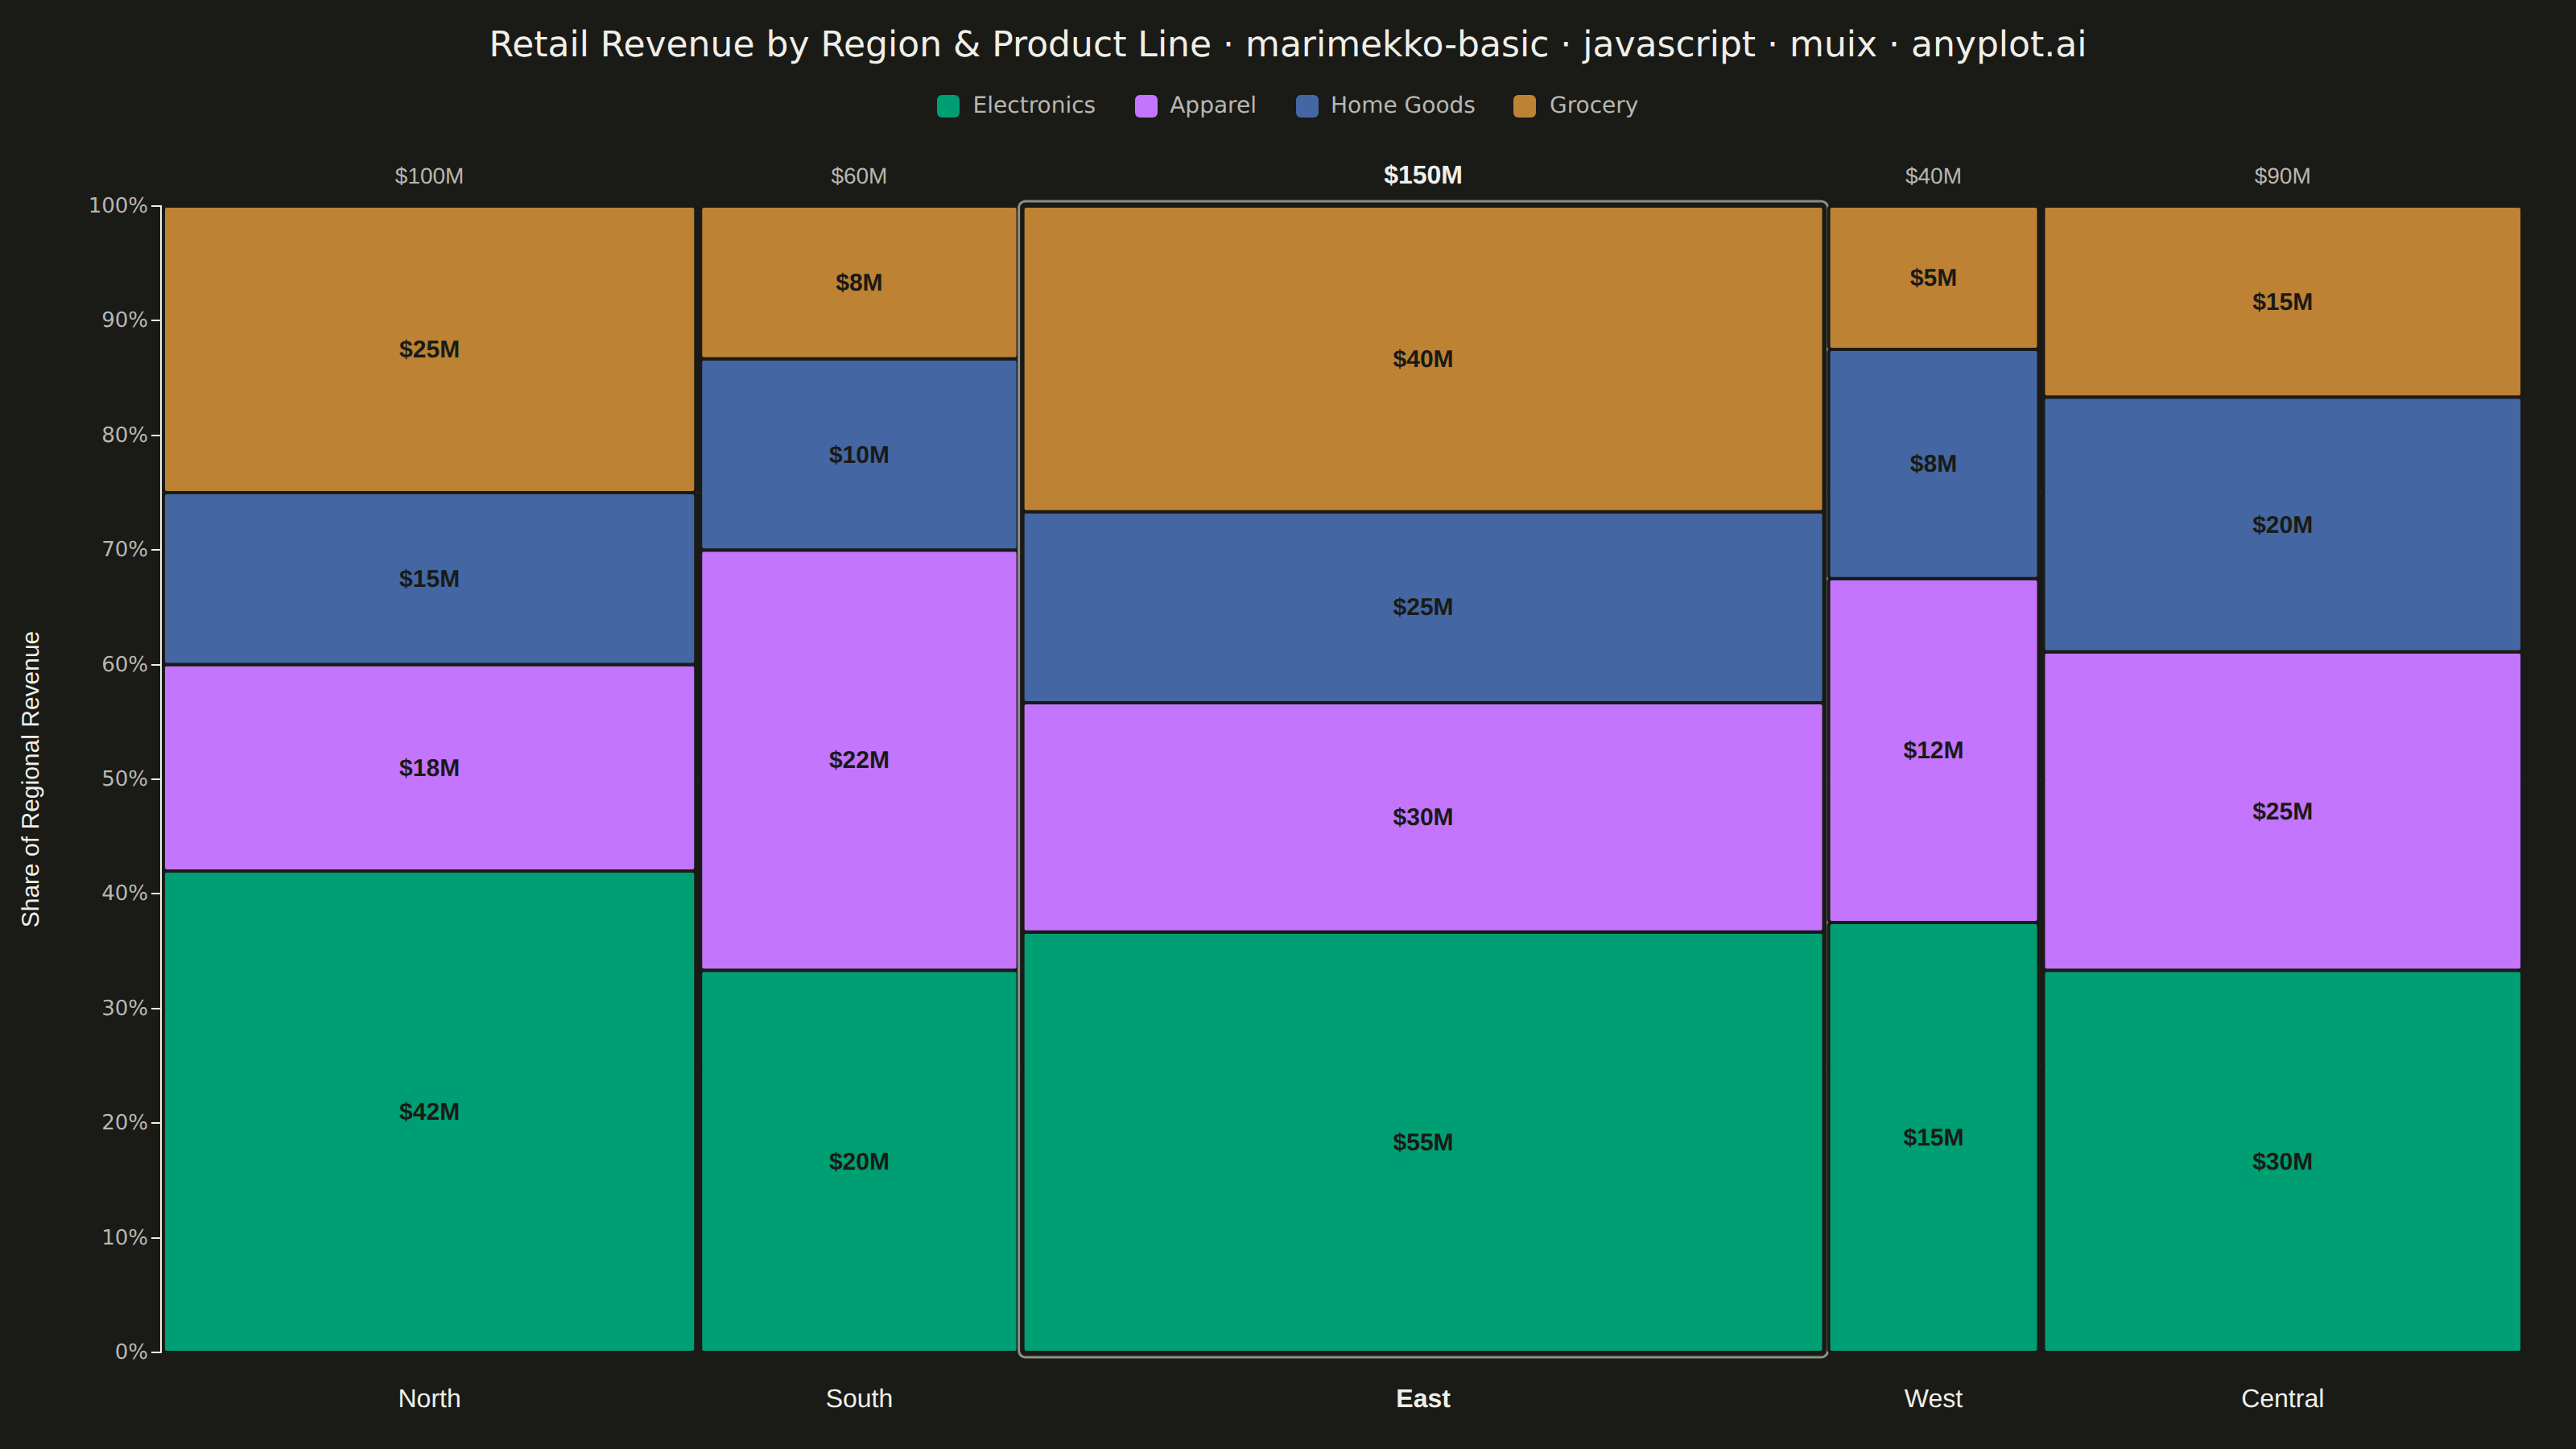
A Marimekko chart (also called mekko or mosaic plot) is a stacked bar chart where both the width and height of segments represent data values. This visualization shows two categorical dimensions simultaneously with proportional areas, making it ideal for understanding how parts relate to wholes across categories of different sizes.
// anyplot.ai
// marimekko-basic: Basic Marimekko Chart
// Library: muix 7.29.1 | JavaScript 22.23.1
// Quality: 94/100 | Created: 2026-07-24
//# anyplot-orientation: landscape
// anyplot.ai
// marimekko-basic: Basic Marimekko Chart
// Library: muix 7.29.1 | JavaScript 22.23.1
// Quality: pending | Created: 2026-07-24
import * as React from "react";
import Box from "@mui/material/Box";
import Typography from "@mui/material/Typography";
import { useTheme } from "@mui/material/styles";
import { ChartContainer } from "@mui/x-charts/ChartContainer";
import { ChartsYAxis } from "@mui/x-charts/ChartsYAxis";
import { ChartsText } from "@mui/x-charts/ChartsText";
import { useXScale, useYScale, useDrawingArea } from "@mui/x-charts/hooks";
const t = window.ANYPLOT_TOKENS;
const FONT = "system-ui, -apple-system, sans-serif";
const X_AXIS_ID = "region-axis";
const Y_AXIS_ID = "share-axis";
// --- Data (in-memory, deterministic) ----------------------------------------
// Quarterly revenue ($M) by store region (column width) and product line
// (segment height within each column).
const regions = ["North", "South", "East", "West", "Central"];
const products = ["Electronics", "Apparel", "Home Goods", "Grocery"];
const revenueByRegion = [
[42, 18, 15, 25], // North
[20, 22, 10, 8], // South
[55, 30, 25, 40], // East
[15, 12, 8, 5], // West
[30, 25, 20, 15], // Central
];
const columnTotals = revenueByRegion.map((row) =>
row.reduce((sum, v) => sum + v, 0),
);
const grandTotal = columnTotals.reduce((sum, v) => sum + v, 0);
const columnStarts = columnTotals.reduce((acc, total, i) => {
acc.push(i === 0 ? 0 : acc[i - 1] + columnTotals[i - 1]);
return acc;
}, []);
// The single standout column (largest revenue total) gets a subtle visual
// accent so the reader sees the headline insight immediately instead of
// having to compare all five totals themselves.
const leaderTotal = Math.max(...columnTotals);
const leaderIndex = columnTotals.indexOf(leaderTotal);
// MUI X has no built-in mekko/mosaic series, so the tiles are drawn as plain
// SVG rects positioned with the scales ChartContainer already computed from
// the declared xAxis/yAxis config — the community-package way to compose a
// chart type the library doesn't ship a dedicated component for.
function MekkoTiles() {
const xScale = useXScale(X_AXIS_ID);
const yScale = useYScale(Y_AXIS_ID);
const drawing = useDrawingArea();
const theme = useTheme();
return (
<g>
<ChartsText
x={drawing.left - 76}
y={drawing.top + drawing.height / 2}
text="Share of Regional Revenue"
fill={theme.palette.text.primary}
style={{
fontSize: 15,
textAnchor: "middle",
dominantBaseline: "auto",
angle: -90,
}}
/>
{[0.25, 0.5, 0.75].map((share) => (
<line
key={share}
x1={drawing.left}
x2={drawing.left + drawing.width}
y1={yScale(share)}
y2={yScale(share)}
stroke={t.grid}
strokeWidth={1}
strokeOpacity={0.45}
/>
))}
{regions.map((region, colIndex) => {
const colStart = columnStarts[colIndex];
const colTotal = columnTotals[colIndex];
const x0 = xScale(colStart);
const x1 = xScale(colStart + colTotal);
const colWidth = x1 - x0;
const isLeader = colIndex === leaderIndex;
let cumShare = 0;
return (
<g key={region}>
{revenueByRegion[colIndex].map((value, rowIndex) => {
const shareBottom = cumShare;
const shareTop = cumShare + value / colTotal;
cumShare = shareTop;
const yTop = yScale(shareTop);
const yBottom = yScale(shareBottom);
const segHeight = yBottom - yTop;
const showLabel = colWidth > 70 && segHeight > 46;
return (
<g key={products[rowIndex]}>
<rect
x={x0 + 1.5}
y={yTop}
width={Math.max(colWidth - 3, 0)}
height={Math.max(segHeight, 0)}
rx={2}
fill={t.palette[rowIndex]}
stroke={t.pageBg}
strokeWidth={2}
/>
{showLabel && (
<ChartsText
x={x0 + colWidth / 2}
y={yTop + segHeight / 2}
text={`$${value}M`}
fill={t.pageBg}
style={{
fontSize: 15,
fontWeight: 600,
textAnchor: "middle",
dominantBaseline: "central",
}}
/>
)}
</g>
);
})}
{isLeader && (
<rect
x={x0 - 1}
y={drawing.top - 3}
width={colWidth + 2}
height={drawing.height + 6}
rx={4}
fill="none"
stroke={theme.palette.text.primary}
strokeWidth={1.5}
strokeOpacity={0.55}
/>
)}
<ChartsText
x={x0 + colWidth / 2}
y={drawing.top - 14}
text={`$${colTotal}M`}
fill={
isLeader
? theme.palette.text.primary
: theme.palette.text.secondary
}
style={{
fontSize: isLeader ? 16 : 14,
fontWeight: isLeader ? 700 : 400,
textAnchor: "middle",
dominantBaseline: "auto",
}}
/>
<ChartsText
x={x0 + colWidth / 2}
y={drawing.top + drawing.height + 24}
text={region}
fill={theme.palette.text.primary}
style={{
fontSize: 16,
fontWeight: isLeader ? 700 : 400,
textAnchor: "middle",
dominantBaseline: "hanging",
}}
/>
</g>
);
})}
</g>
);
}
export default function Chart() {
const theme = useTheme();
const { width, height } = window.ANYPLOT_SIZE;
const TITLE_H = 56;
const LEGEND_H = 44;
const CHART_H = height - TITLE_H - LEGEND_H;
return (
<Box
sx={{
width,
height,
bgcolor: t.pageBg,
display: "flex",
flexDirection: "column",
boxSizing: "border-box",
pt: "18px",
}}
>
<Typography
sx={{
color: t.ink,
fontSize: 22,
fontWeight: 500,
textAlign: "center",
fontFamily: FONT,
lineHeight: 1,
mb: "4px",
}}
>
Retail Revenue by Region & Product Line · marimekko-basic ·
javascript · muix · anyplot.ai
</Typography>
<Box
sx={{
height: LEGEND_H,
display: "flex",
alignItems: "center",
justifyContent: "center",
gap: 3,
}}
>
{products.map((product, i) => (
<Box
key={product}
sx={{ display: "flex", alignItems: "center", gap: "8px" }}
>
<Box
sx={{
width: 14,
height: 14,
borderRadius: "3px",
bgcolor: t.palette[i],
}}
/>
<Typography
sx={{
fontSize: 14,
color: theme.palette.text.secondary,
fontFamily: FONT,
}}
>
{product}
</Typography>
</Box>
))}
</Box>
<ChartContainer
width={width}
height={CHART_H}
series={[]}
margin={{ top: 40, right: 32, bottom: 48, left: 100 }}
xAxis={[
{ id: X_AXIS_ID, scaleType: "linear", min: 0, max: grandTotal },
]}
yAxis={[{ id: Y_AXIS_ID, scaleType: "linear", min: 0, max: 1 }]}
>
<ChartsYAxis
axisId={Y_AXIS_ID}
valueFormatter={(value) => `${Math.round(value * 100)}%`}
tickNumber={5}
tickLabelStyle={{ fontSize: 13, fill: t.inkSoft, fontFamily: FONT }}
/>
<MekkoTiles />
</ChartContainer>
</Box>
);
}
Runnable source as JSON, for any HTTP client: https://api.anyplot.ai/specs/marimekko-basic/muix/code. Any spec id and library id listed in llms-full.txt fit the same URL shape; every URL below is complete and callable.
{
  "spec_id": "marimekko-basic",
  "language": "javascript",
  "library": "muix",
  "page": "https://anyplot.ai/marimekko-basic/javascript/muix",
  "hub": "https://anyplot.ai/marimekko-basic",
  "code_json": "https://api.anyplot.ai/specs/marimekko-basic/muix/code",
  "spec_json": "https://api.anyplot.ai/specs/marimekko-basic",
  "render_light_png": "https://storage.googleapis.com/anyplot-images/plots/marimekko-basic/javascript/muix/plot-light.png",
  "render_dark_png": "https://storage.googleapis.com/anyplot-images/plots/marimekko-basic/javascript/muix/plot-dark.png",
  "interactive_light_html": "https://storage.googleapis.com/anyplot-images/plots/marimekko-basic/javascript/muix/plot-light.html",
  "interactive_dark_html": "https://storage.googleapis.com/anyplot-images/plots/marimekko-basic/javascript/muix/plot-dark.html",
  "quality_score": 94.0,
  "license": "MIT",
  "guide": "https://anyplot.ai/llms.txt"
}
Part of Basic Marimekko Chart on anyplot.ai.