The same plot in 14 other libraries — JavaScript: Chart.js, D3.js, Highcharts, MUI X Charts; Python: Altair, Bokeh, lets-plot, Matplotlib, Plotly, plotnine, Pygal, Seaborn; R: ggplot2; Julia: Makie.jl. Compare all 15 side by side: Basic Marimekko Chart in Python, R, Julia and JavaScript.
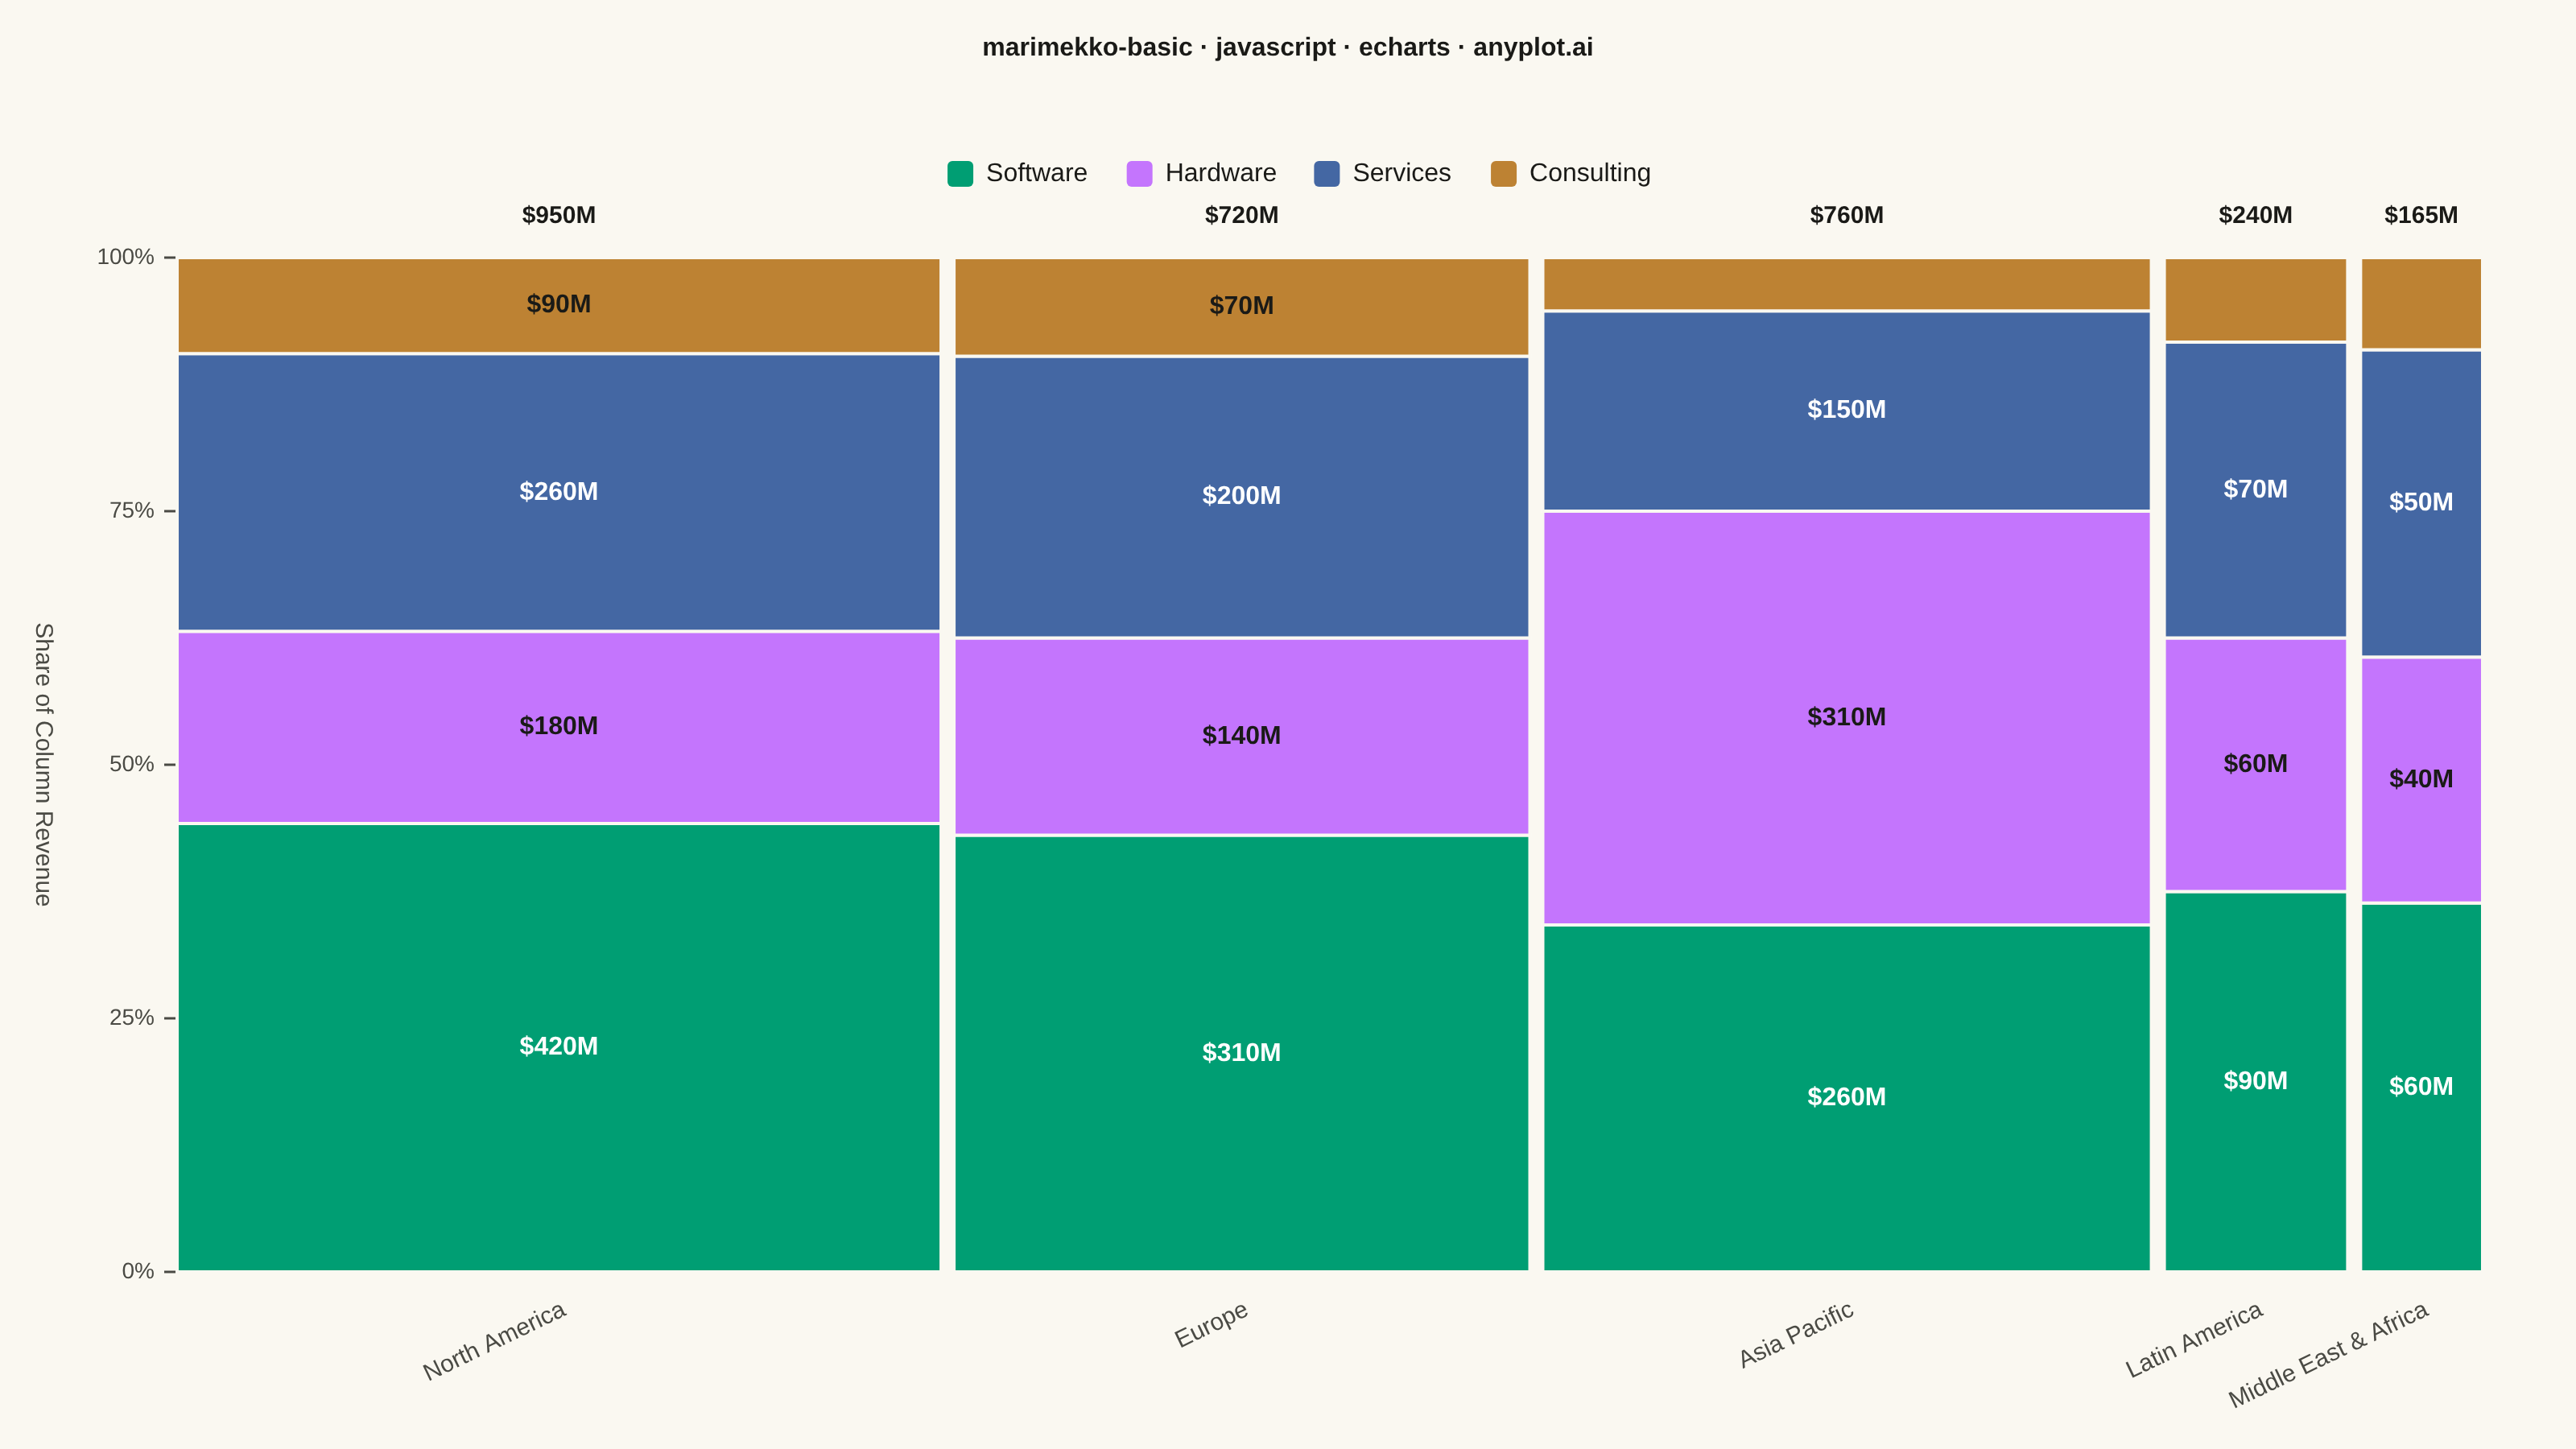
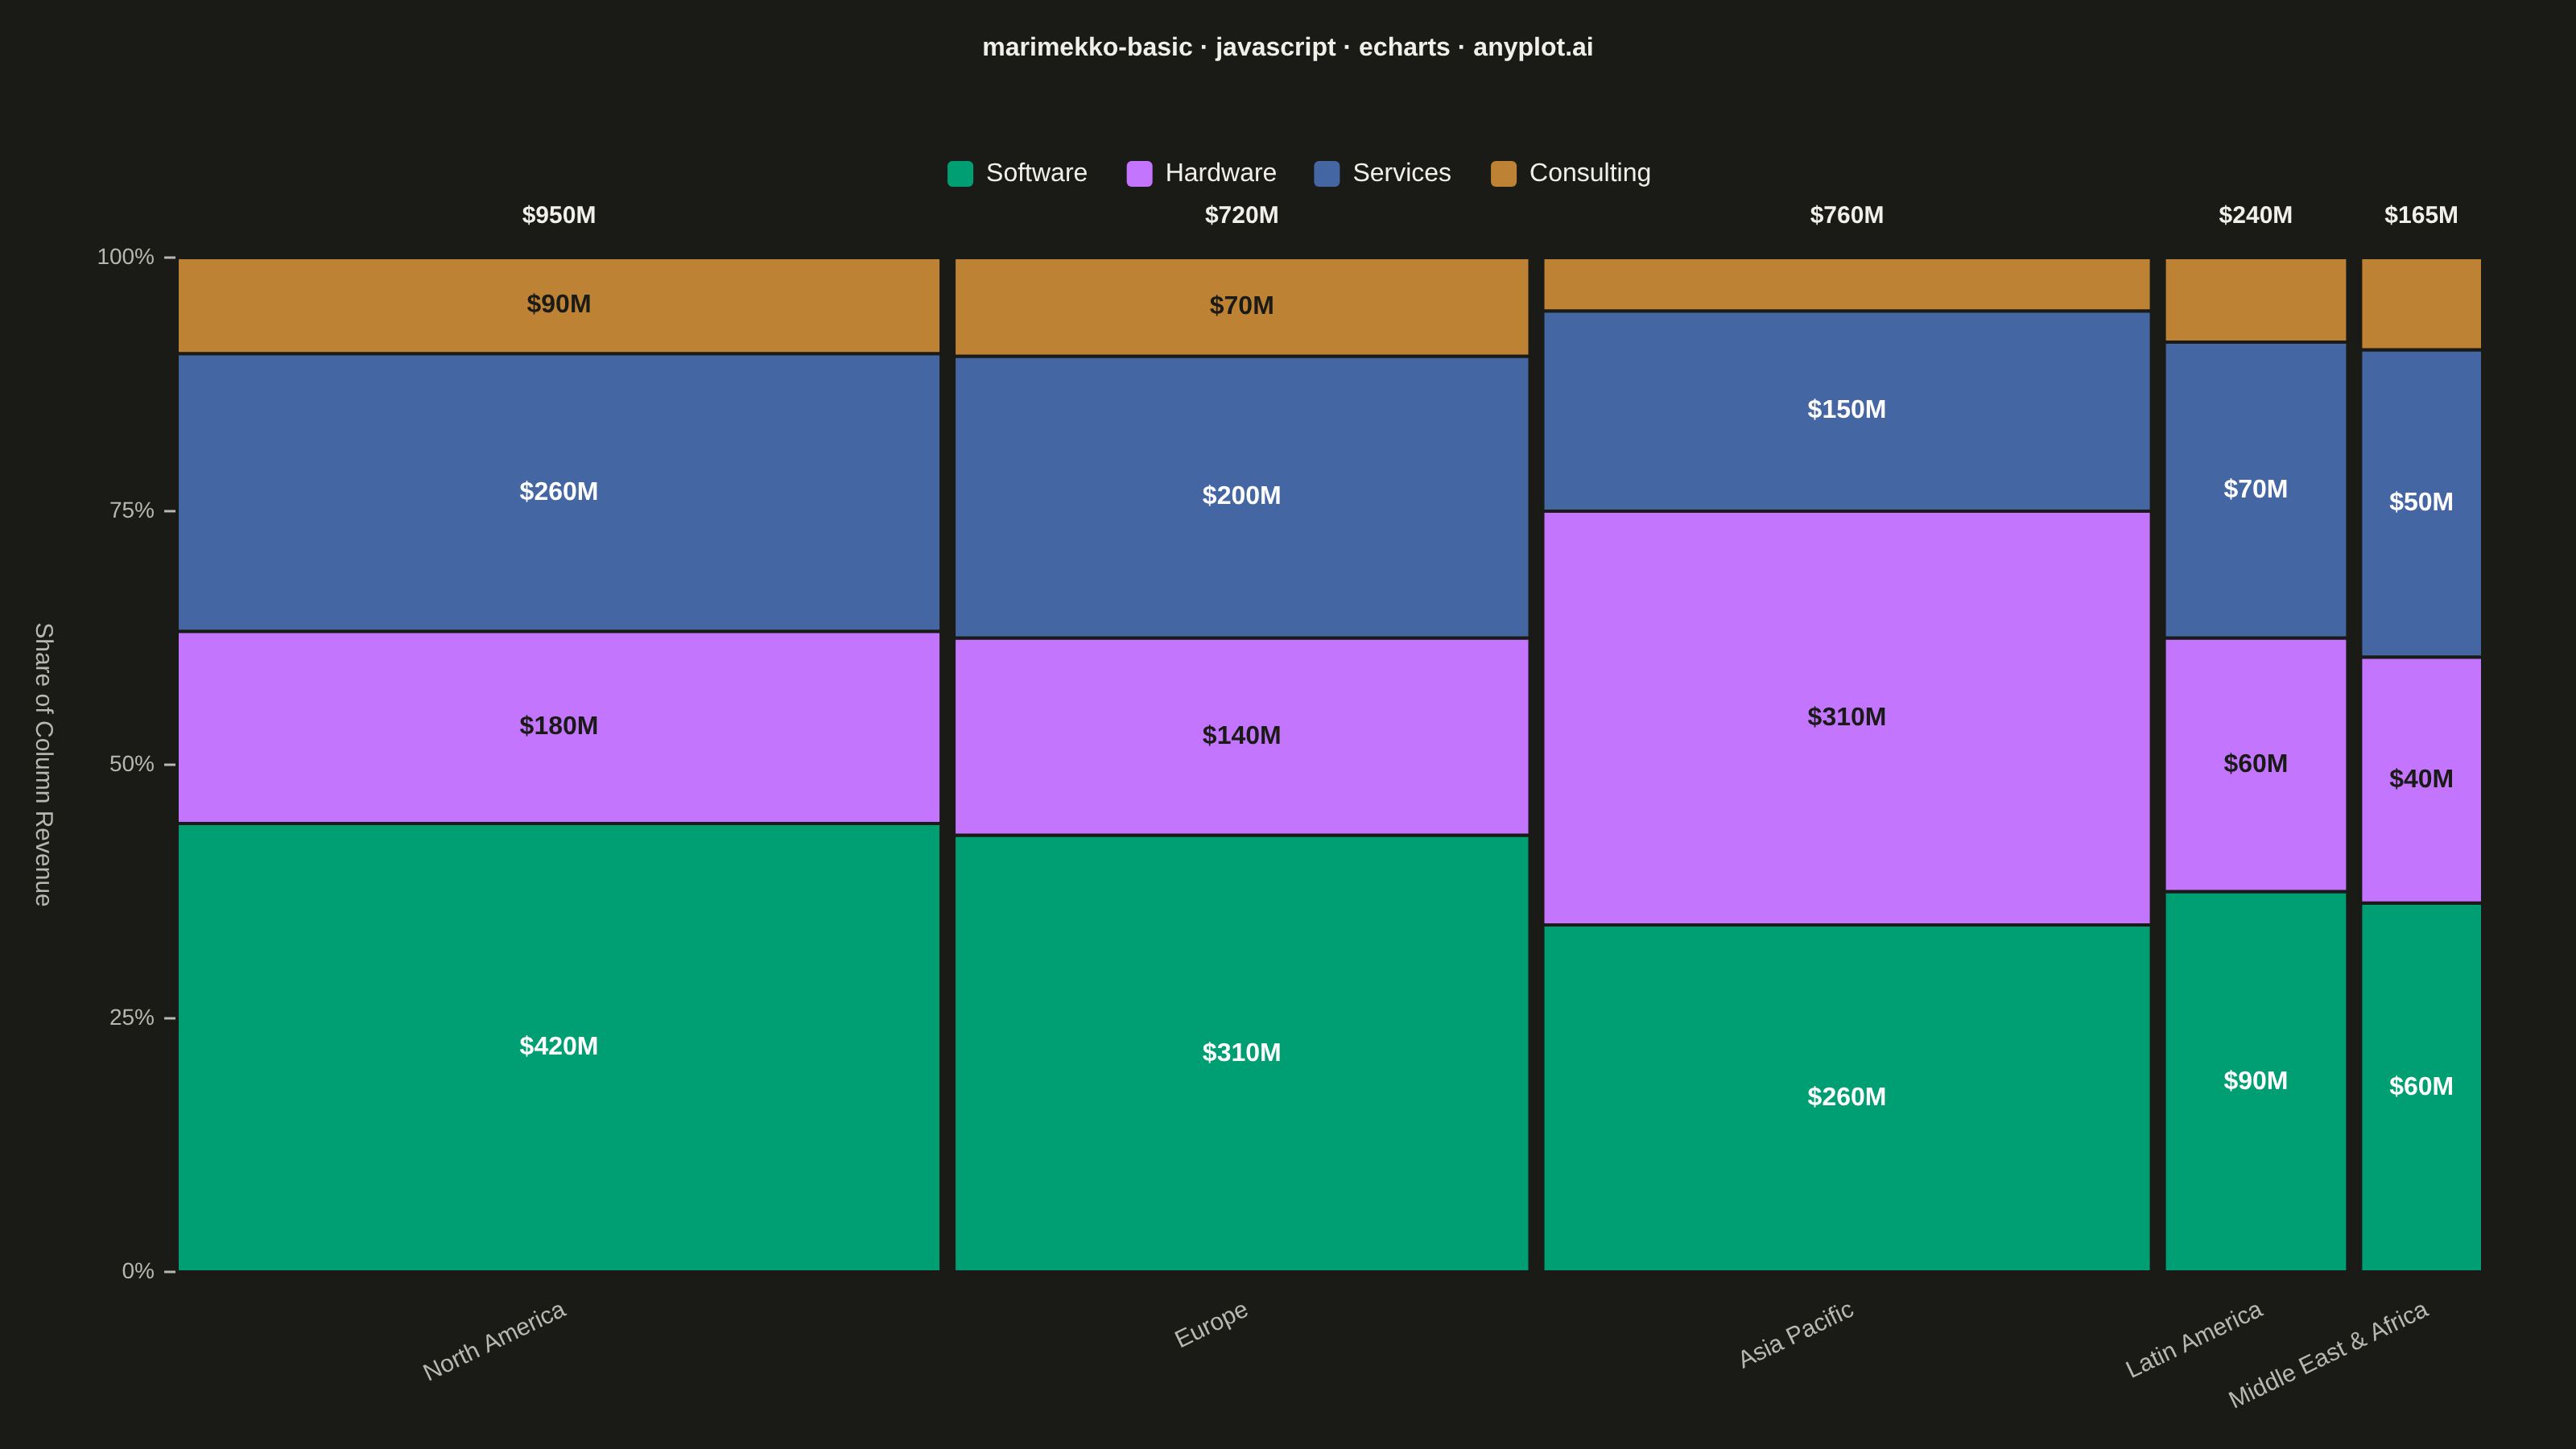
A Marimekko chart (also called mekko or mosaic plot) is a stacked bar chart where both the width and height of segments represent data values. This visualization shows two categorical dimensions simultaneously with proportional areas, making it ideal for understanding how parts relate to wholes across categories of different sizes.
// anyplot.ai
// marimekko-basic: Basic Marimekko Chart
// Library: echarts 6.1.0 | JavaScript 22.23.1
// Quality: 91/100 | Created: 2026-07-24
//# anyplot-orientation: landscape
// anyplot.ai
// marimekko-basic: Basic Marimekko Chart
// Library: echarts 5.5.1 | JavaScript 22
// Quality: pending | Created: 2026-07-24
const t = window.ANYPLOT_TOKENS;
const size = window.ANYPLOT_SIZE;
// --- Data: quarterly revenue ($M) by region (column width) and product line
// (stacked segment height) ---------------------------------------------------
const regions = [
{ name: "North America", values: [420, 180, 260, 90] },
{ name: "Europe", values: [310, 140, 200, 70] },
{ name: "Asia Pacific", values: [260, 310, 150, 40] },
{ name: "Latin America", values: [90, 60, 70, 20] },
{ name: "Middle East & Africa", values: [60, 40, 50, 15] },
];
const products = ["Software", "Hardware", "Services", "Consulting"];
// Segment label text color: white reads well on the brand green and blue
// slots, but the lighter lavender and ochre slots fall below the WCAG AA
// large-text 3:1 minimum against white — those two get a fixed dark ink
// label instead (the fill colors are identical across themes, so the fix
// stays fixed rather than following t.ink).
const labelTextColor = ["#FFFFFF", "#1A1A17", "#FFFFFF", "#1A1A17"];
const regionTotals = regions.map((r) => r.values.reduce((a, b) => a + b, 0));
const grandTotal = regionTotals.reduce((a, b) => a + b, 0);
// --- Layout geometry (CSS px within the mount) -------------------------------
const marginLeft = 110;
const marginRight = 50;
const marginTop = 160;
const marginBottom = 110;
const plotWidth = size.width - marginLeft - marginRight;
const plotHeight = size.height - marginTop - marginBottom;
const columnGap = 8;
const measureCtx = document.createElement("canvas").getContext("2d");
function textWidth(text, font) {
measureCtx.font = font;
return measureCtx.measureText(text).width;
}
// --- Build segment rectangles + per-column metadata --------------------------
const rects = [];
const columns = [];
let xCursor = marginLeft;
regions.forEach((region, ri) => {
const total = regionTotals[ri];
const columnWidth = (total / grandTotal) * plotWidth;
const innerWidth = Math.max(columnWidth - columnGap, 1);
let yCursor = marginTop + plotHeight;
region.values.forEach((value, pi) => {
const share = value / total;
const segHeight = share * plotHeight;
const rectY = yCursor - segHeight;
rects.push({
// [x, y, w, h, labelText, showLabel, labelColor, regionName, productName, value, share]
value: [
xCursor,
rectY,
innerWidth,
segHeight,
`$${value}M`,
segHeight > 58 ? 1 : 0,
labelTextColor[pi],
region.name,
products[pi],
value,
share,
],
itemStyle: { color: t.palette[pi] },
});
yCursor = rectY;
});
columns.push({ x: xCursor + innerWidth / 2, name: region.name, total });
xCursor += columnWidth;
});
// --- Graphic overlay: left percentage scale, legend, column labels ----------
const graphicElements = [];
// Vertical axis line + percentage ticks/labels
graphicElements.push({
type: "line",
shape: { x1: marginLeft, y1: marginTop, x2: marginLeft, y2: marginTop + plotHeight },
style: { stroke: t.inkSoft, lineWidth: 1.5 },
silent: true,
});
[0, 25, 50, 75, 100].forEach((pct) => {
const y = marginTop + plotHeight * (1 - pct / 100);
graphicElements.push({
type: "line",
shape: { x1: marginLeft - 8, y1: y, x2: marginLeft, y2: y },
style: { stroke: t.inkSoft, lineWidth: 1.5 },
silent: true,
});
graphicElements.push({
type: "text",
x: marginLeft - 14,
y,
style: { text: `${pct}%`, fill: t.inkSoft, fontSize: 14, align: "right", verticalAlign: "middle" },
silent: true,
});
});
graphicElements.push({
type: "text",
x: 34,
y: marginTop + plotHeight / 2,
rotation: -Math.PI / 2,
style: { text: "Share of Column Revenue", fill: t.inkSoft, fontSize: 15, align: "center" },
silent: true,
});
// Column labels (region name, rotated to fit narrow columns) + total above bar
columns.forEach((c) => {
graphicElements.push({
type: "text",
x: c.x,
y: marginTop + plotHeight + 16,
rotation: Math.PI / 7,
style: { text: c.name, fill: t.inkSoft, fontSize: 15, align: "right", verticalAlign: "top" },
silent: true,
});
graphicElements.push({
type: "text",
x: c.x,
y: marginTop - 18,
style: {
text: `$${c.total}M`,
fill: t.ink,
fontSize: 15,
fontWeight: "bold",
align: "center",
verticalAlign: "bottom",
},
silent: true,
});
});
// Manual legend (one swatch per stacked product line, above the plot area)
const legendFont = "13px sans-serif";
const swatchSize = 16;
const swatchGap = 8;
const itemGap = 36;
const legendItemWidths = products.map((name) => swatchSize + swatchGap + textWidth(name, legendFont) + itemGap);
const legendTotalWidth = legendItemWidths.reduce((a, b) => a + b, 0) - itemGap;
let legendX = size.width / 2 - legendTotalWidth / 2;
const legendY = 100;
products.forEach((name, pi) => {
graphicElements.push({
type: "rect",
x: legendX,
y: legendY,
shape: { x: 0, y: 0, width: swatchSize, height: swatchSize, r: 3 },
style: { fill: t.palette[pi] },
silent: true,
});
graphicElements.push({
type: "text",
x: legendX + swatchSize + swatchGap,
y: legendY + swatchSize / 2,
style: { text: name, fill: t.ink, fontSize: 16, align: "left", verticalAlign: "middle" },
silent: true,
});
legendX += legendItemWidths[pi];
});
// --- Chart ------------------------------------------------------------------
const chart = echarts.init(document.getElementById("container"));
chart.setOption({
animation: false,
backgroundColor: "transparent",
color: t.palette,
title: {
text: "marimekko-basic · javascript · echarts · anyplot.ai",
left: "center",
top: 20,
textStyle: { color: t.ink, fontSize: 22, fontWeight: "medium" },
},
graphic: graphicElements,
tooltip: {
trigger: "item",
backgroundColor: t.elevatedBg,
borderColor: t.inkSoft,
textStyle: { color: t.ink },
formatter: (params) => {
const [, , , , , , , regionName, productName, value, share] = params.value;
return `<b>${regionName} · ${productName}</b><br/>$${value}M · ${(share * 100).toFixed(1)}% of column`;
},
},
series: [
{
type: "custom",
coordinateSystem: null,
clip: false,
renderItem: (params, api) => {
const x = api.value(0);
const y = api.value(1);
const w = api.value(2);
const h = api.value(3);
const labelText = api.value(4);
const showLabel = api.value(5) === 1;
const labelColor = api.value(6);
const children = [
{
type: "rect",
shape: { x, y, width: w, height: h },
style: api.style({ stroke: t.pageBg, lineWidth: 2 }),
},
];
if (showLabel) {
children.push({
type: "text",
style: {
text: labelText,
x: x + w / 2,
y: y + h / 2,
fill: labelColor,
fontSize: 16,
fontWeight: "bold",
align: "center",
verticalAlign: "middle",
},
});
}
return { type: "group", children };
},
data: rects,
},
],
});
Runnable source as JSON, for any HTTP client: https://api.anyplot.ai/specs/marimekko-basic/echarts/code. Any spec id and library id listed in llms-full.txt fit the same URL shape; every URL below is complete and callable.
{
  "spec_id": "marimekko-basic",
  "language": "javascript",
  "library": "echarts",
  "page": "https://anyplot.ai/marimekko-basic/javascript/echarts",
  "hub": "https://anyplot.ai/marimekko-basic",
  "code_json": "https://api.anyplot.ai/specs/marimekko-basic/echarts/code",
  "spec_json": "https://api.anyplot.ai/specs/marimekko-basic",
  "render_light_png": "https://storage.googleapis.com/anyplot-images/plots/marimekko-basic/javascript/echarts/plot-light.png",
  "render_dark_png": "https://storage.googleapis.com/anyplot-images/plots/marimekko-basic/javascript/echarts/plot-dark.png",
  "interactive_light_html": "https://storage.googleapis.com/anyplot-images/plots/marimekko-basic/javascript/echarts/plot-light.html",
  "interactive_dark_html": "https://storage.googleapis.com/anyplot-images/plots/marimekko-basic/javascript/echarts/plot-dark.html",
  "quality_score": 91.0,
  "license": "MIT",
  "guide": "https://anyplot.ai/llms.txt"
}
Part of Basic Marimekko Chart on anyplot.ai.