The same plot in 14 other libraries — JavaScript: D3.js, Apache ECharts, Highcharts, MUI X Charts; Python: Altair, Bokeh, lets-plot, Matplotlib, Plotly, plotnine, Pygal, Seaborn; R: ggplot2; Julia: Makie.jl. Compare all 15 side by side: Basic Marimekko Chart in Python, R, Julia and JavaScript.
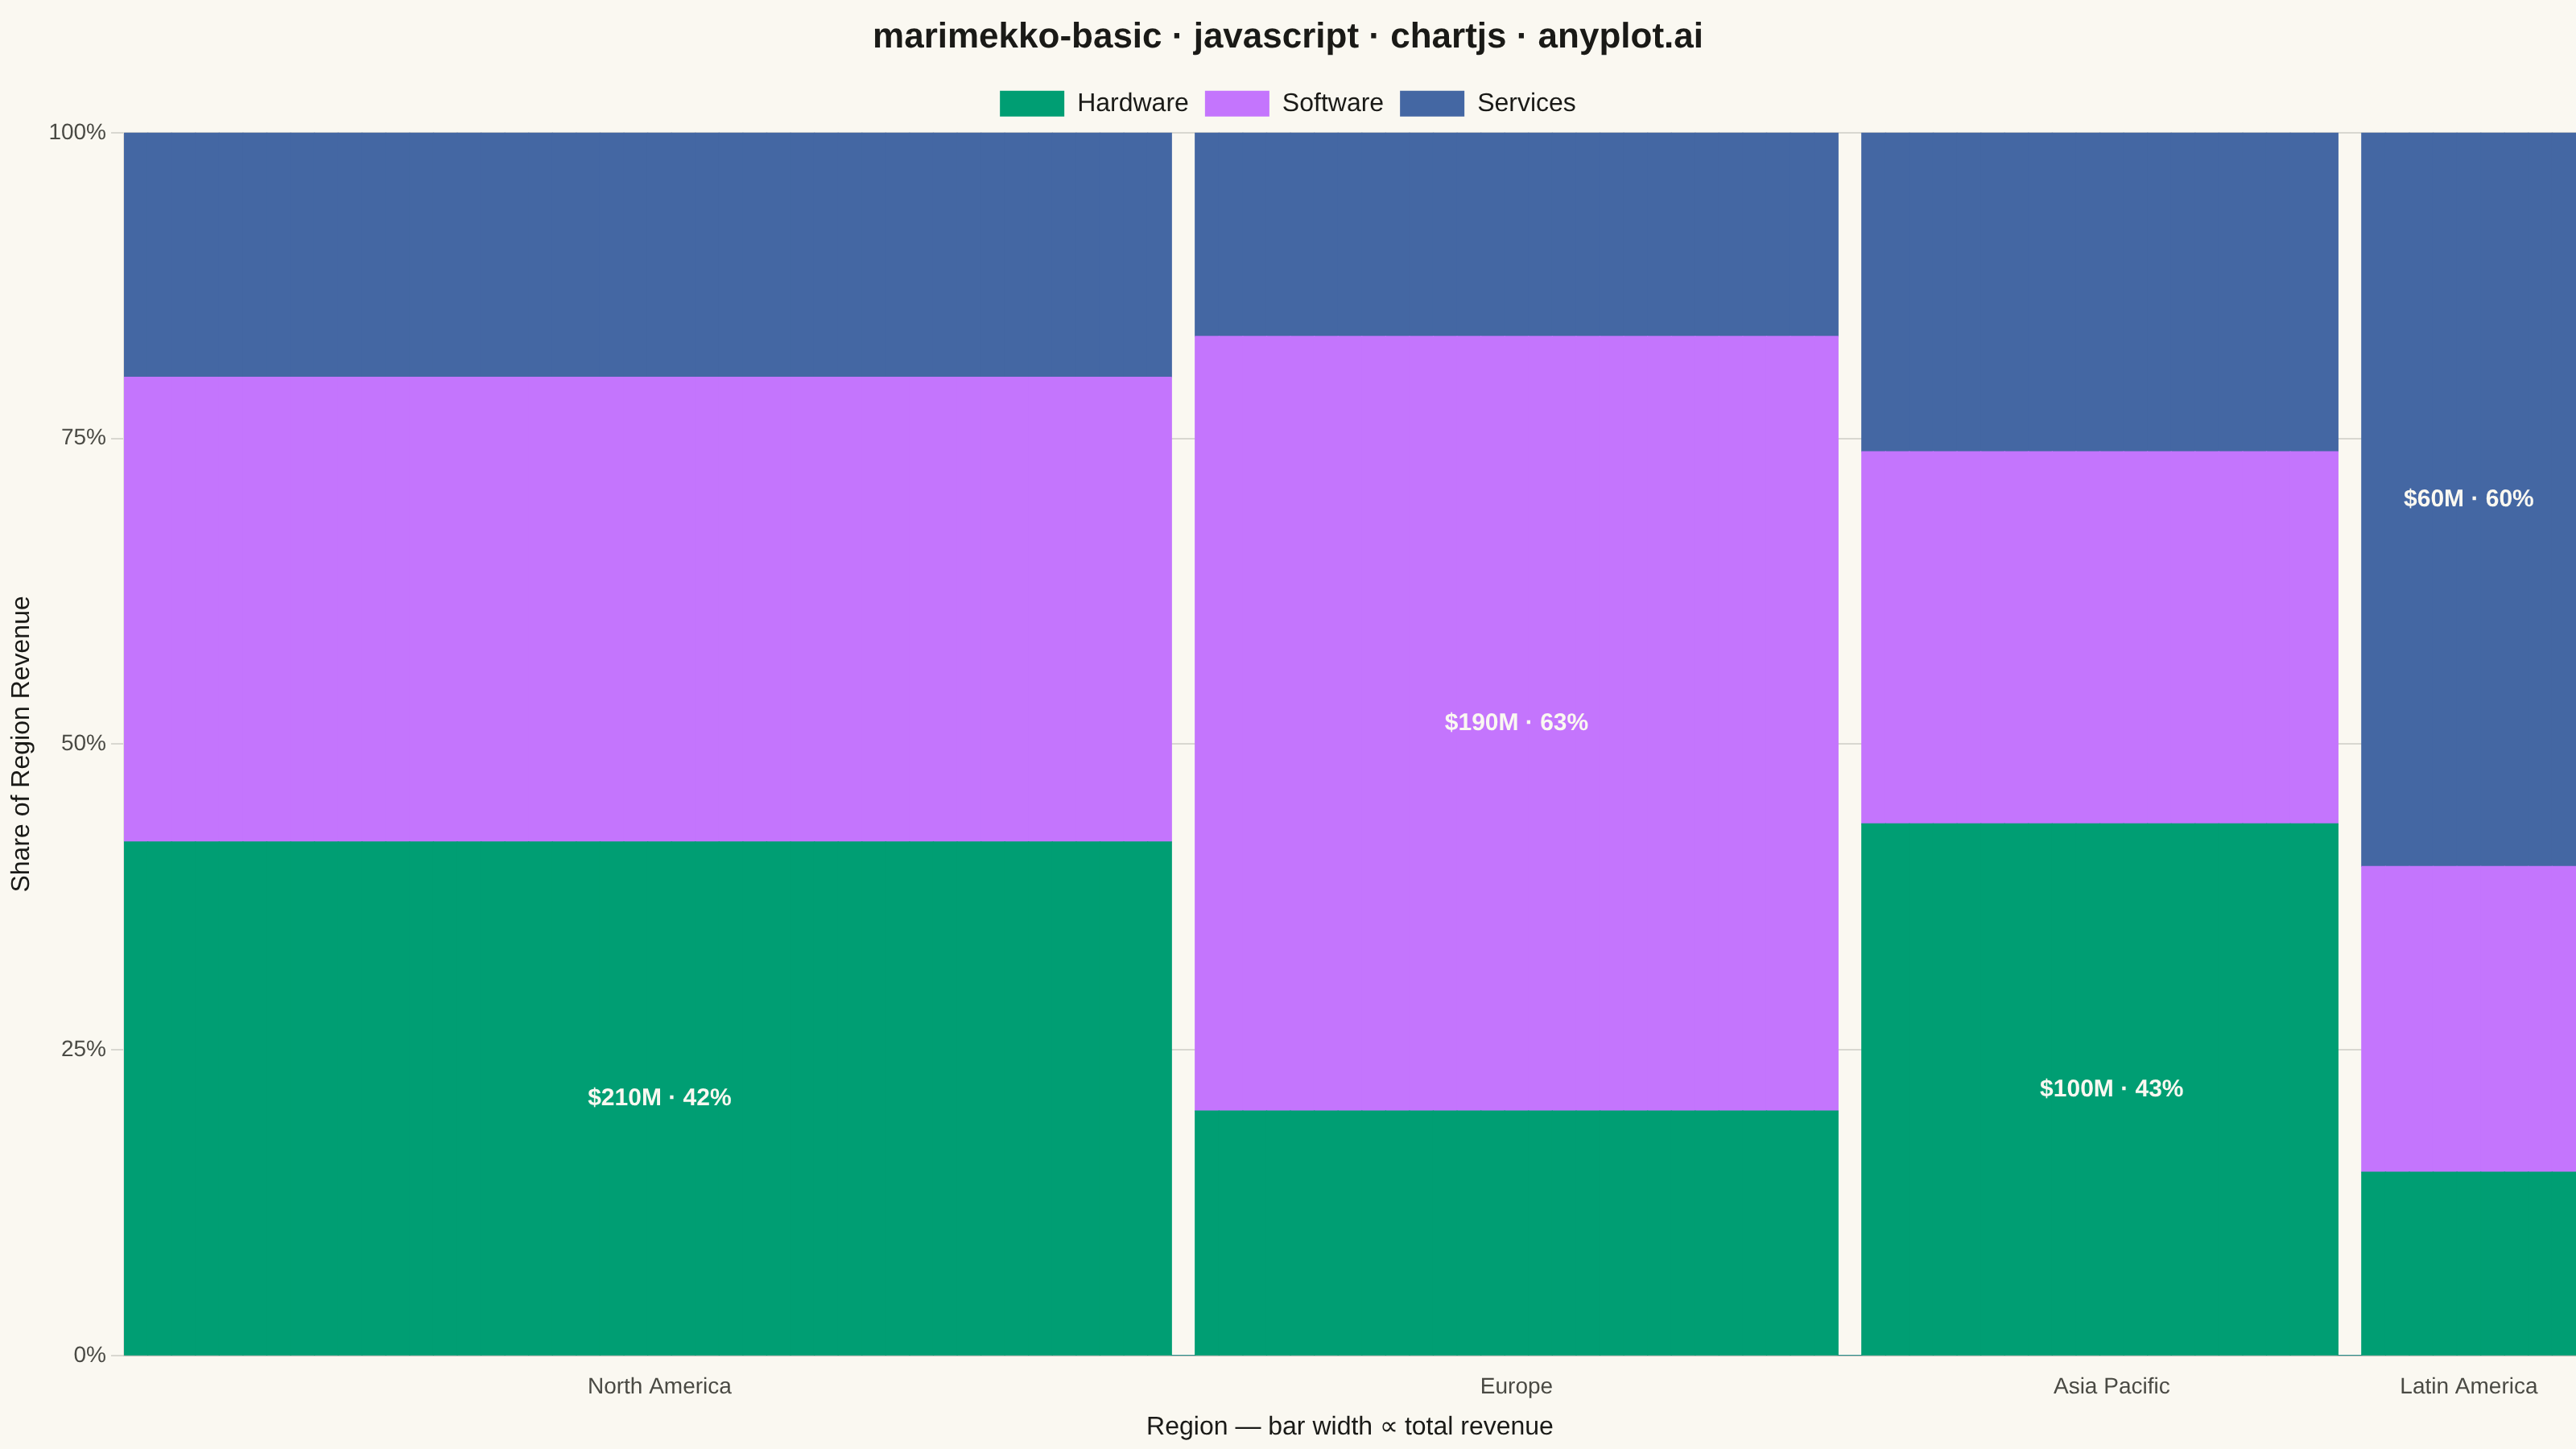
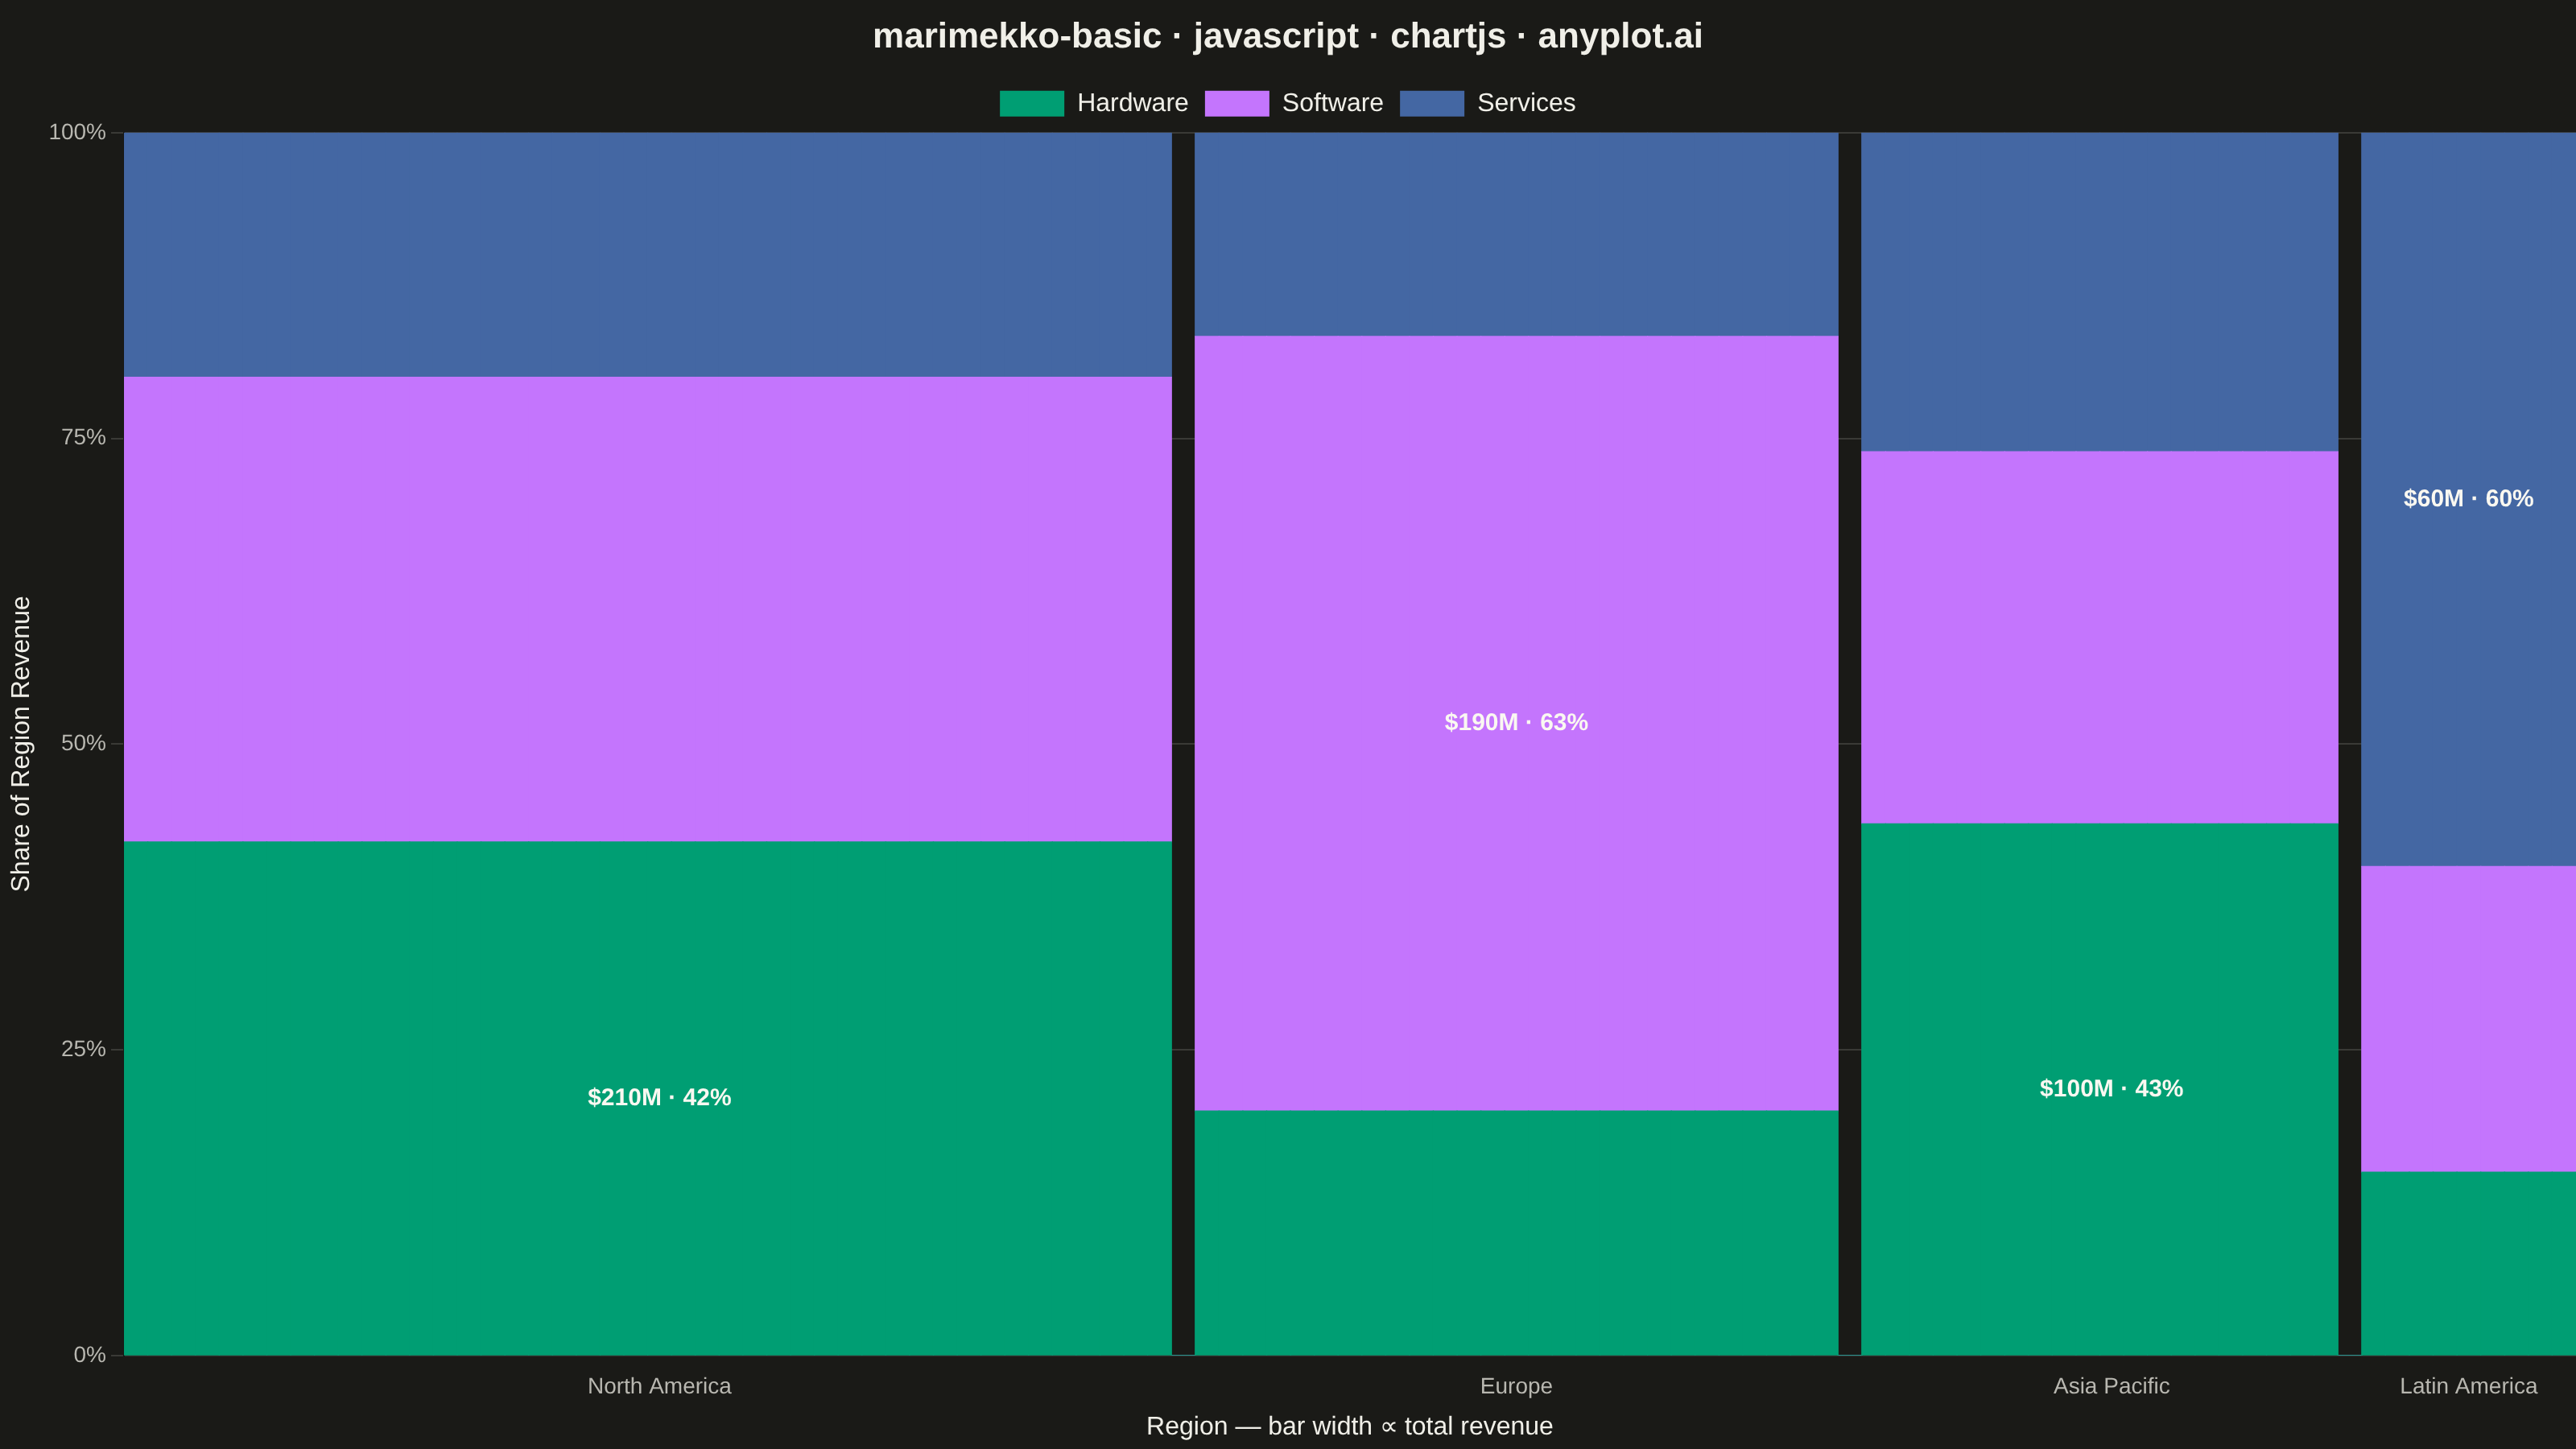
A Marimekko chart (also called mekko or mosaic plot) is a stacked bar chart where both the width and height of segments represent data values. This visualization shows two categorical dimensions simultaneously with proportional areas, making it ideal for understanding how parts relate to wholes across categories of different sizes.
// anyplot.ai
// marimekko-basic: Basic Marimekko Chart
// Library: chartjs 4.4.7 | JavaScript 22.23.1
// Quality: 89/100 | Created: 2026-07-24

const t = window.ANYPLOT_TOKENS;

// --- Data (in-memory, deterministic) ----------------------------------------
// Revenue ($M) by region (drives bar width) and product line (drives the
// stacked share within each bar). Product mix is deliberately distinct per
// region so the composition story (not just the width story) reads clearly:
// North America and Asia Pacific are hardware-led, Europe is software-led,
// and Latin America is services-led.
const regions = ["North America", "Europe", "Asia Pacific", "Latin America"];
const products = ["Hardware", "Software", "Services"];
const revenue = [
  [210, 190, 100], // North America - hardware-led, largest overall
  [60, 190, 50], // Europe - software-led
  [100, 70, 60], // Asia Pacific - hardware-led, more balanced
  [15, 25, 60], // Latin America - services-led, smallest overall
];
const regionTotals = revenue.map((row) => row.reduce((sum, v) => sum + v, 0));
const grandTotal = regionTotals.reduce((sum, v) => sum + v, 0);
const topProductIndex = revenue.map((row) => row.indexOf(Math.max(...row)));

// --- Layout: a fine category grid stands in for variable bar widths --------
// Chart.js sizes every bar in a dataset uniformly, so each region becomes a
// run of adjacent zero-gap grid slots proportional to its revenue share; a
// single blank slot between runs reads as the gap between mekko columns.
const GRID_UNITS = 100;
const columnWidths = regionTotals.map((total) => Math.round((total / grandTotal) * GRID_UNITS));
columnWidths[columnWidths.length - 1] += GRID_UNITS - columnWidths.reduce((a, b) => a + b, 0);

const labels = [];
const slotRegion = []; // region index per grid slot, -1 for a gap slot
const centerSlot = []; // the grid slot index used to anchor each region's label
regions.forEach((region, ri) => {
  const start = labels.length;
  for (let i = 0; i < columnWidths[ri]; i++) {
    labels.push("");
    slotRegion.push(ri);
  }
  const center = start + Math.floor(columnWidths[ri] / 2);
  labels[center] = region;
  centerSlot.push(center);
  if (ri < regions.length - 1) {
    labels.push("");
    slotRegion.push(-1);
  }
});

// --- Storytelling: callout the largest segment per region -------------------
// Relative luminance (WCAG) decides whether the callout text reads better in
// near-black ink or near-cream, so it stays legible on every palette color.
function relativeLuminance(hex) {
  const [r, g, b] = hex
    .slice(1)
    .match(/../g)
    .map((c) => parseInt(c, 16) / 255)
    .map((c) => (c <= 0.03928 ? c / 12.92 : ((c + 0.055) / 1.055) ** 2.4));
  return 0.2126 * r + 0.7152 * g + 0.0722 * b;
}
const calloutPlugin = {
  id: "segmentCallouts",
  afterDatasetsDraw(chart) {
    const { ctx } = chart;
    ctx.save();
    ctx.font = "bold 15px sans-serif";
    ctx.textAlign = "center";
    ctx.textBaseline = "middle";
    regions.forEach((region, ri) => {
      const pi = topProductIndex[ri];
      const bar = chart.getDatasetMeta(pi).data[centerSlot[ri]];
      if (!bar) return;
      const share = (revenue[ri][pi] / regionTotals[ri]) * 100;
      const full = `$${revenue[ri][pi]}M · ${share.toFixed(0)}%`;
      const short = `${share.toFixed(0)}%`;
      const segmentWidth = bar.width * columnWidths[ri];
      const text = ctx.measureText(full).width <= segmentWidth - 8 ? full : short;
      if (ctx.measureText(text).width > segmentWidth - 8) return;
      const fill = t.palette[pi % t.palette.length];
      ctx.fillStyle = relativeLuminance(fill) > 0.55 ? "#1A1A17" : "#FAF8F1";
      ctx.fillText(text, bar.x, (bar.y + bar.base) / 2);
    });
    ctx.restore();
  },
};

// --- Mount -------------------------------------------------------------------
const canvas = document.createElement("canvas");
document.getElementById("container").appendChild(canvas);

// --- Chart -------------------------------------------------------------------
new Chart(canvas, {
  type: "bar",
  plugins: [calloutPlugin],
  data: {
    labels,
    datasets: products.map((product, pi) => ({
      label: product,
      data: slotRegion.map((ri) => (ri === -1 ? 0 : (revenue[ri][pi] / regionTotals[ri]) * 100)),
      backgroundColor: t.palette[pi % t.palette.length],
      borderWidth: 0,
      barPercentage: 1,
      categoryPercentage: 1,
    })),
  },
  options: {
    responsive: true,
    maintainAspectRatio: false,
    animation: false,
    plugins: {
      title: {
        display: true,
        text: "marimekko-basic · javascript · chartjs · anyplot.ai",
        color: t.ink,
        font: { size: 22 },
      },
      legend: {
        labels: { color: t.ink, font: { size: 16 } },
      },
      tooltip: {
        filter: (item) => item.parsed.y > 0,
        callbacks: {
          title: (items) => regions[slotRegion[items[0].dataIndex]],
          label: (item) => {
            const ri = slotRegion[item.dataIndex];
            const value = revenue[ri][item.datasetIndex];
            return `${item.dataset.label}: $${value}M (${item.parsed.y.toFixed(0)}%)`;
          },
        },
      },
    },
    scales: {
      x: {
        stacked: true,
        ticks: { color: t.inkSoft, font: { size: 14 }, autoSkip: false, maxRotation: 0 },
        grid: { display: false },
        title: {
          display: true,
          text: "Region — bar width ∝ total revenue",
          color: t.ink,
          font: { size: 16 },
        },
      },
      y: {
        stacked: true,
        min: 0,
        max: 100,
        ticks: {
          color: t.inkSoft,
          font: { size: 14 },
          stepSize: 25,
          callback: (value) => `${value}%`,
        },
        grid: { color: t.grid },
        title: { display: true, text: "Share of Region Revenue", color: t.ink, font: { size: 16 } },
      },
    },
  },
});
Runnable source as JSON, for any HTTP client: https://api.anyplot.ai/specs/marimekko-basic/chartjs/code. Any spec id and library id listed in llms-full.txt fit the same URL shape; every URL below is complete and callable.
{
  "spec_id": "marimekko-basic",
  "language": "javascript",
  "library": "chartjs",
  "page": "https://anyplot.ai/marimekko-basic/javascript/chartjs",
  "hub": "https://anyplot.ai/marimekko-basic",
  "code_json": "https://api.anyplot.ai/specs/marimekko-basic/chartjs/code",
  "spec_json": "https://api.anyplot.ai/specs/marimekko-basic",
  "render_light_png": "https://storage.googleapis.com/anyplot-images/plots/marimekko-basic/javascript/chartjs/plot-light.png",
  "render_dark_png": "https://storage.googleapis.com/anyplot-images/plots/marimekko-basic/javascript/chartjs/plot-dark.png",
  "interactive_light_html": "https://storage.googleapis.com/anyplot-images/plots/marimekko-basic/javascript/chartjs/plot-light.html",
  "interactive_dark_html": "https://storage.googleapis.com/anyplot-images/plots/marimekko-basic/javascript/chartjs/plot-dark.html",
  "quality_score": 89.0,
  "license": "MIT",
  "guide": "https://anyplot.ai/llms.txt"
}
Part of Basic Marimekko Chart on anyplot.ai.