The same plot in 14 other libraries — JavaScript: Chart.js, D3.js, Apache ECharts, MUI X Charts; Python: Altair, Bokeh, lets-plot, Matplotlib, Plotly, plotnine, Pygal, Seaborn; R: ggplot2; Julia: Makie.jl. Compare all 15 side by side: Basic Marimekko Chart in Python, R, Julia and JavaScript.
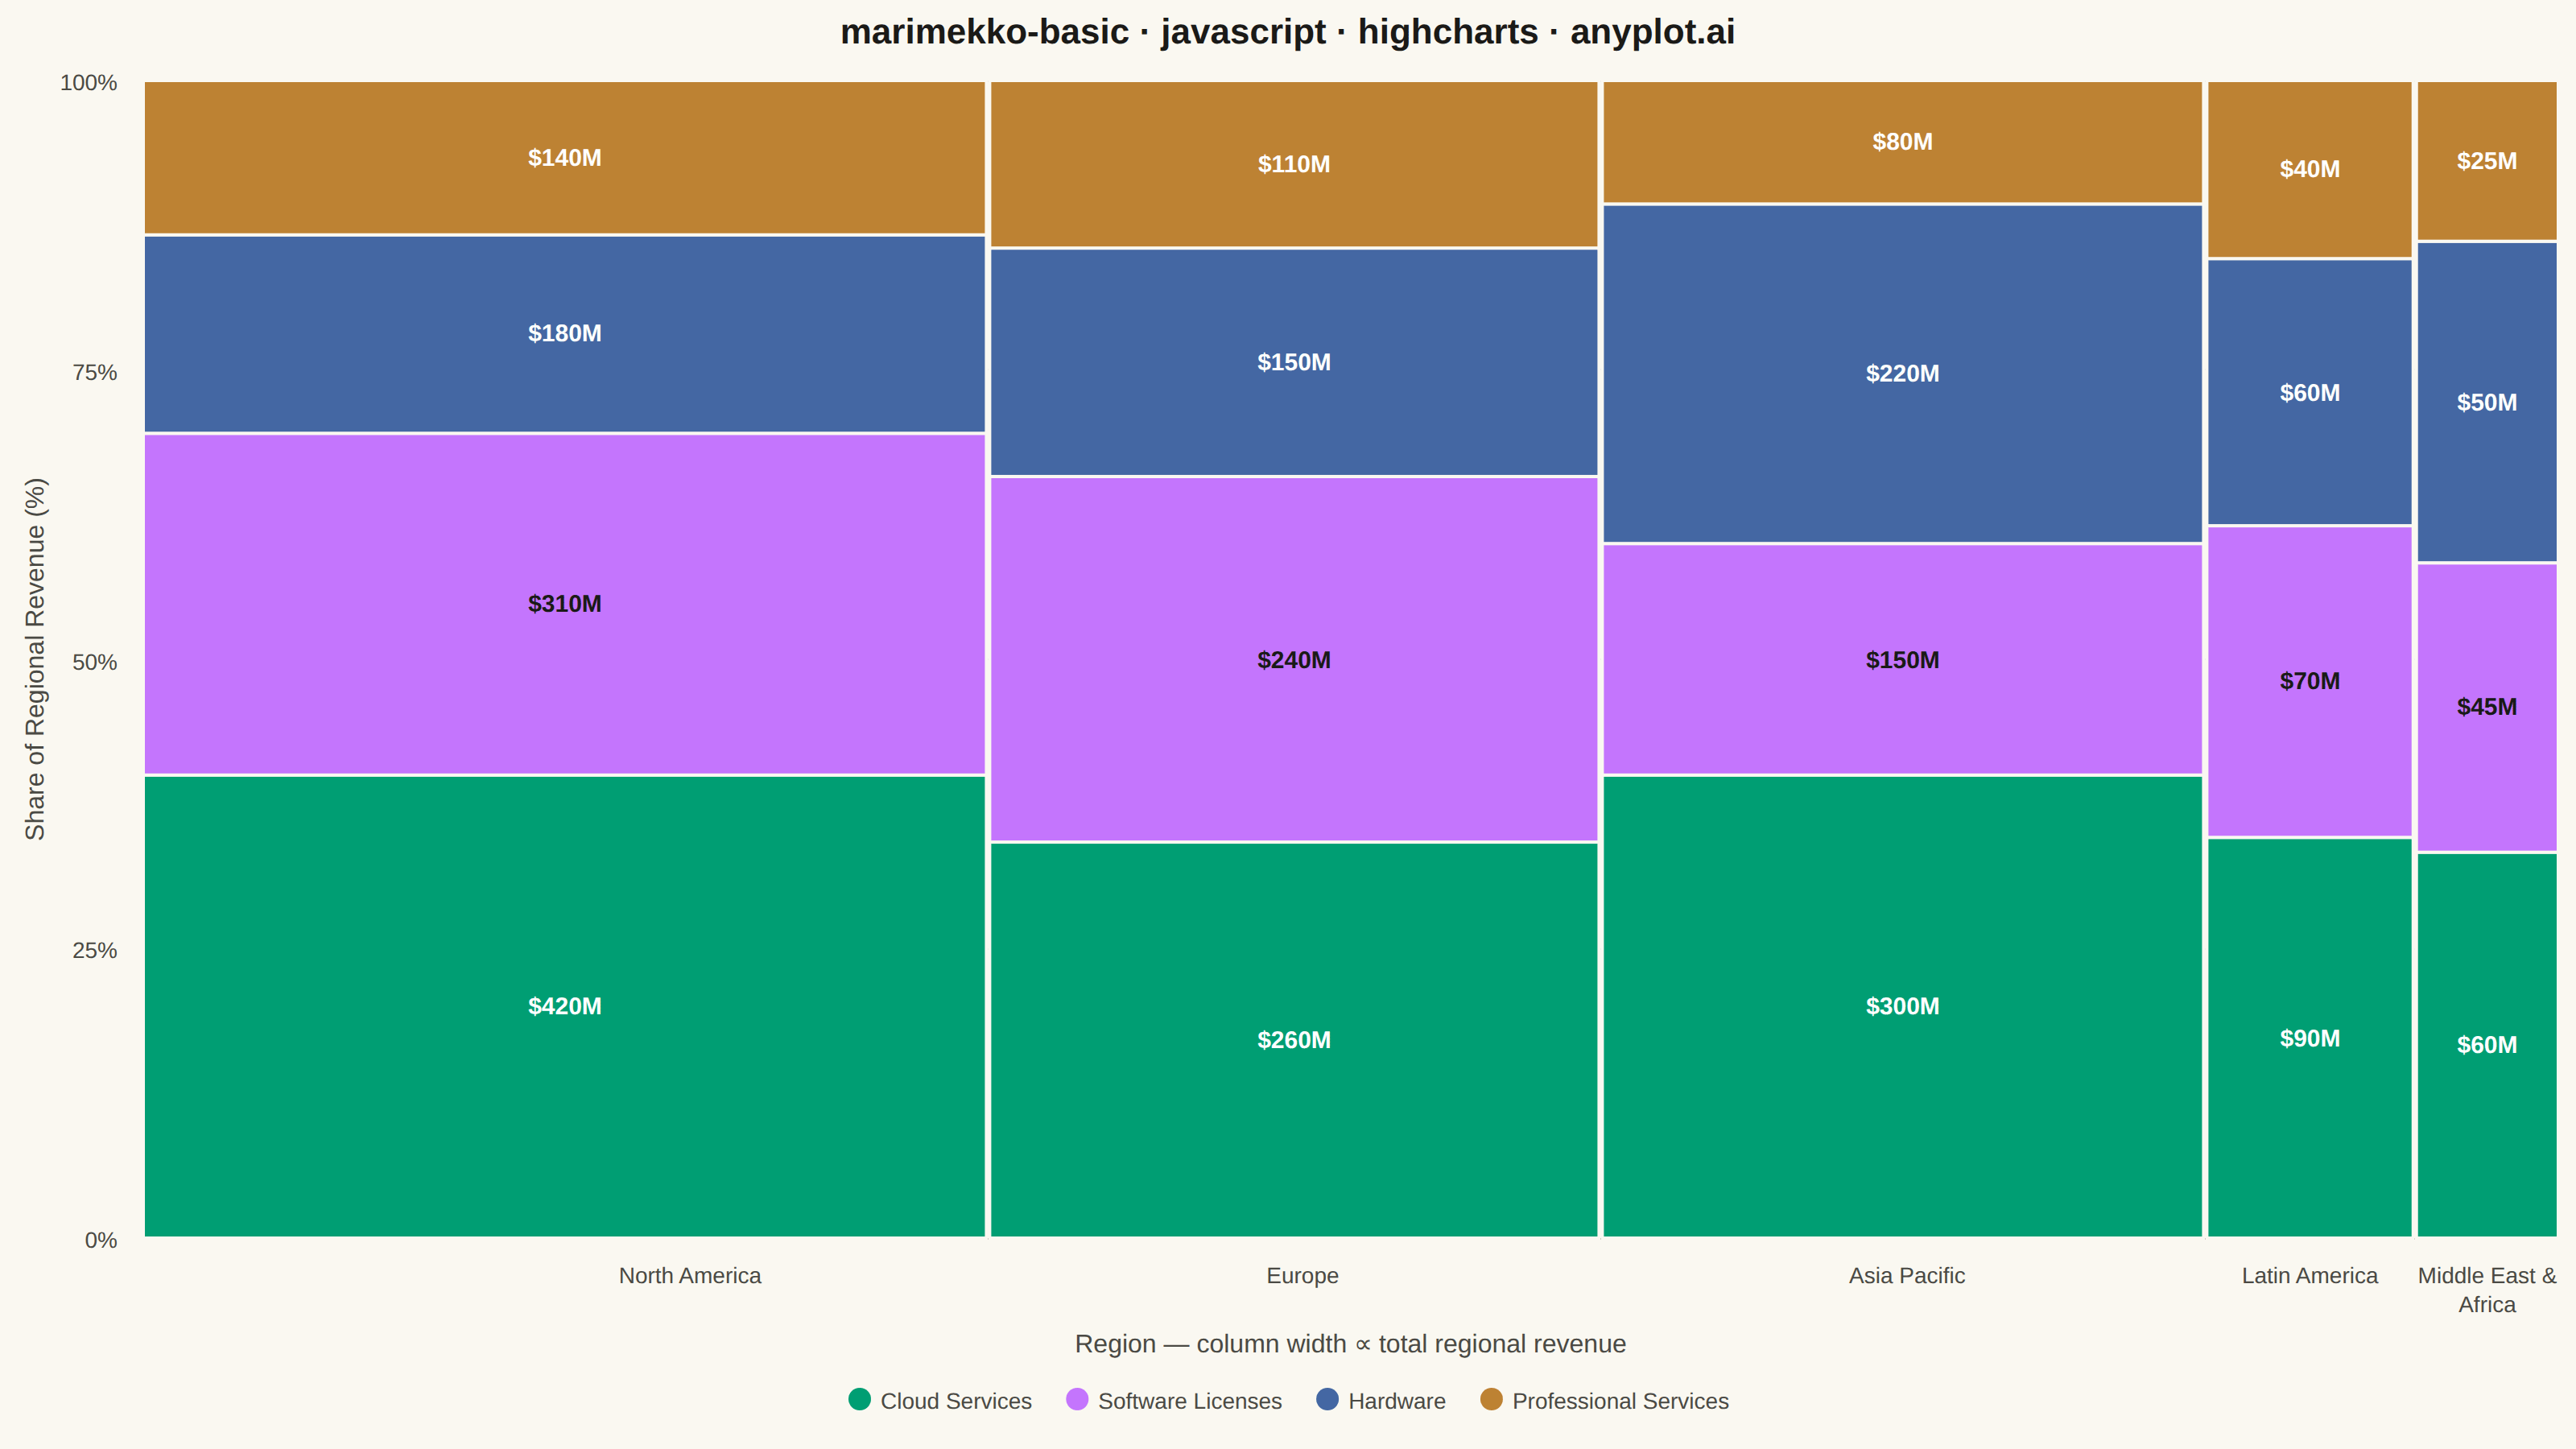
A Marimekko chart (also called mekko or mosaic plot) is a stacked bar chart where both the width and height of segments represent data values. This visualization shows two categorical dimensions simultaneously with proportional areas, making it ideal for understanding how parts relate to wholes across categories of different sizes.
// anyplot.ai
// marimekko-basic: Basic Marimekko Chart
// Library: highcharts 12.6.0 | JavaScript 22.23.1
// Quality: 90/100 | Created: 2026-07-24

//# anyplot-orientation: landscape

const t = window.ANYPLOT_TOKENS;

// --- Data (in-memory, deterministic): revenue ($M) by region and product line ---
const products = ["Cloud Services", "Software Licenses", "Hardware", "Professional Services"];
const regions = [
    { name: "North America", values: [420, 310, 180, 140] },
    { name: "Europe", values: [260, 240, 150, 110] },
    { name: "Asia Pacific", values: [300, 150, 220, 80] },
    { name: "Latin America", values: [90, 70, 60, 40] },
    { name: "Middle East & Africa", values: [60, 45, 50, 25] },
];

// --- Derived geometry ----------------------------------------------------------
// Column width  ∝ total revenue of the region (x-axis units = $M, linear scale).
// Segment height ∝ each product's share of that region's revenue (y-axis = %).
const colTotals = regions.map((r) => r.values.reduce((a, b) => a + b, 0));
const totalWidth = colTotals.reduce((a, b) => a + b, 0);

let cursor = 0;
const colStart = colTotals.map((width) => {
    const start = cursor;
    cursor += width;
    return start;
});
const midpoints = colStart.map((start, i) => start + colTotals[i] / 2);
const tickInfo = {};
regions.forEach((r, i) => (tickInfo[midpoints[i]] = { name: r.name, dataWidth: colTotals[i] }));

// One rectangle per (region, product) cell, plus an invisible point at its
// center to drive the real tooltip — both derived from the same source data.
const segments = [];
const tooltipPoints = [];
regions.forEach((region, i) => {
    let shareBottom = 0;
    region.values.forEach((value, j) => {
        const share = (value / colTotals[i]) * 100;
        segments.push({
            x1: colStart[i],
            x2: colStart[i] + colTotals[i],
            yBottom: shareBottom,
            yTop: shareBottom + share,
            value,
            share,
            color: t.palette[j],
            product: products[j],
            region: region.name,
        });
        tooltipPoints.push({
            x: midpoints[i],
            y: shareBottom + share / 2,
            custom: { region: region.name, product: products[j], value, share },
        });
        shareBottom += share;
    });
});

// Perceived luminance decides whether a segment label reads better in white or ink.
function labelColorFor(hex) {
    const r = parseInt(hex.slice(1, 3), 16) / 255;
    const g = parseInt(hex.slice(3, 5), 16) / 255;
    const b = parseInt(hex.slice(5, 7), 16) / 255;
    const luminance = 0.299 * r + 0.587 * g + 0.114 * b;
    return luminance > 0.55 ? "#1A1A17" : "#FFFFFF";
}

// --- Chart -----------------------------------------------------------------
// Core Highcharts has no variable-width column series (that lives in the
// variwide module, which isn't loaded) — segments are drawn as plain rects via
// the renderer, positioned with axis.toPixels() so they land exactly on the
// linear width/percent axes below. Legend swatches and the tooltip come from
// real (near-empty) series so hover still works in the exported HTML.
Highcharts.chart("container", {
    chart: {
        type: "column",
        backgroundColor: "transparent",
        animation: false,
        style: { fontFamily: "inherit" },
        events: {
            load: function () {
                const xAxis = this.xAxis[0];
                const yAxis = this.yAxis[0];
                const renderer = this.renderer;

                segments.forEach((seg) => {
                    const px1 = xAxis.toPixels(seg.x1);
                    const px2 = xAxis.toPixels(seg.x2);
                    const pyTop = yAxis.toPixels(seg.yTop);
                    const pyBottom = yAxis.toPixels(seg.yBottom);
                    const rectX = px1 + 1;
                    const rectWidth = Math.max(px2 - px1 - 2, 0);
                    const rectHeight = pyBottom - pyTop;

                    renderer
                        .rect(rectX, pyTop, rectWidth, rectHeight)
                        .attr({ fill: seg.color, stroke: t.pageBg, "stroke-width": 2, zIndex: 3 })
                        .add();

                    if (rectWidth >= 70 && rectHeight >= 45) {
                        renderer
                            .text(`$${seg.value}M`, rectX + rectWidth / 2, pyTop + rectHeight / 2 + 5)
                            .attr({ align: "center", zIndex: 4 })
                            .css({ color: labelColorFor(seg.color), fontSize: "15px", fontWeight: "600" })
                            .add();
                    }
                });
            },
        },
    },
    credits: { enabled: false },
    colors: t.palette,
    title: {
        text: "marimekko-basic · javascript · highcharts · anyplot.ai",
        style: { color: t.ink, fontSize: "22px", fontWeight: "600" },
    },
    xAxis: {
        min: 0,
        max: totalWidth,
        tickPositions: midpoints,
        tickLength: 0,
        gridLineWidth: 0,
        lineColor: t.inkSoft,
        labels: {
            useHTML: true,
            style: { color: t.inkSoft, fontSize: "14px" },
            // Wrap each region name to its own column's pixel width so narrow
            // columns (e.g. Middle East & Africa) break onto two lines instead
            // of overlapping their neighbor's label.
            formatter: function () {
                const info = tickInfo[this.value];
                if (!info) return "";
                const axis = this.axis;
                const pxWidth = Math.max(
                    axis.toPixels(this.value + info.dataWidth / 2) - axis.toPixels(this.value - info.dataWidth / 2),
                    40
                );
                return `<div style="width:${pxWidth}px; text-align:center; white-space:normal; line-height:1.25;">${info.name}</div>`;
            },
        },
        title: {
            text: "Region — column width ∝ total regional revenue",
            style: { color: t.inkSoft, fontSize: "16px" },
        },
    },
    yAxis: {
        min: 0,
        max: 100,
        tickInterval: 25,
        gridLineColor: t.grid,
        lineColor: t.inkSoft,
        title: {
            text: "Share of Regional Revenue (%)",
            style: { color: t.inkSoft, fontSize: "16px" },
        },
        labels: {
            style: { color: t.inkSoft, fontSize: "14px" },
            formatter: function () {
                return this.value + "%";
            },
        },
    },
    legend: {
        itemStyle: { color: t.inkSoft, fontSize: "14px" },
        itemHoverStyle: { color: t.ink },
    },
    tooltip: {
        backgroundColor: t.elevatedBg,
        borderColor: t.grid,
        style: { color: t.ink, fontSize: "14px" },
        formatter: function () {
            const p = this.point.custom;
            return `<b>${p.region}</b><br/>${p.product}: $${p.value}M (${p.share.toFixed(1)}% of region)`;
        },
    },
    plotOptions: {
        series: { animation: false },
        column: { borderWidth: 0 },
    },
    series: [
        ...products.map((name, j) => ({
            type: "column",
            name,
            color: t.palette[j],
            data: [],
            showInLegend: true,
        })),
        {
            type: "scatter",
            name: "Segments",
            showInLegend: false,
            color: "transparent",
            data: tooltipPoints,
            marker: {
                enabled: false,
                states: { hover: { enabled: true, radius: 6, fillColor: t.ink, lineWidth: 0 } },
            },
        },
    ],
});
Runnable source as JSON, for any HTTP client: https://api.anyplot.ai/specs/marimekko-basic/highcharts/code. Any spec id and library id listed in llms-full.txt fit the same URL shape; every URL below is complete and callable.
{
  "spec_id": "marimekko-basic",
  "language": "javascript",
  "library": "highcharts",
  "page": "https://anyplot.ai/marimekko-basic/javascript/highcharts",
  "hub": "https://anyplot.ai/marimekko-basic",
  "code_json": "https://api.anyplot.ai/specs/marimekko-basic/highcharts/code",
  "spec_json": "https://api.anyplot.ai/specs/marimekko-basic",
  "render_light_png": "https://storage.googleapis.com/anyplot-images/plots/marimekko-basic/javascript/highcharts/plot-light.png",
  "render_dark_png": "https://storage.googleapis.com/anyplot-images/plots/marimekko-basic/javascript/highcharts/plot-dark.png",
  "interactive_light_html": "https://storage.googleapis.com/anyplot-images/plots/marimekko-basic/javascript/highcharts/plot-light.html",
  "interactive_dark_html": "https://storage.googleapis.com/anyplot-images/plots/marimekko-basic/javascript/highcharts/plot-dark.html",
  "quality_score": 90.0,
  "license": "MIT",
  "guide": "https://anyplot.ai/llms.txt"
}
Part of Basic Marimekko Chart on anyplot.ai.