The same plot in 14 other libraries — Python: Altair, Bokeh, lets-plot, Matplotlib, Plotly, plotnine, Pygal, Seaborn; Julia: Makie.jl; JavaScript: Chart.js, D3.js, Apache ECharts, Highcharts, MUI X Charts. Compare all 15 side by side: Basic Marimekko Chart in Python, R, Julia and JavaScript.
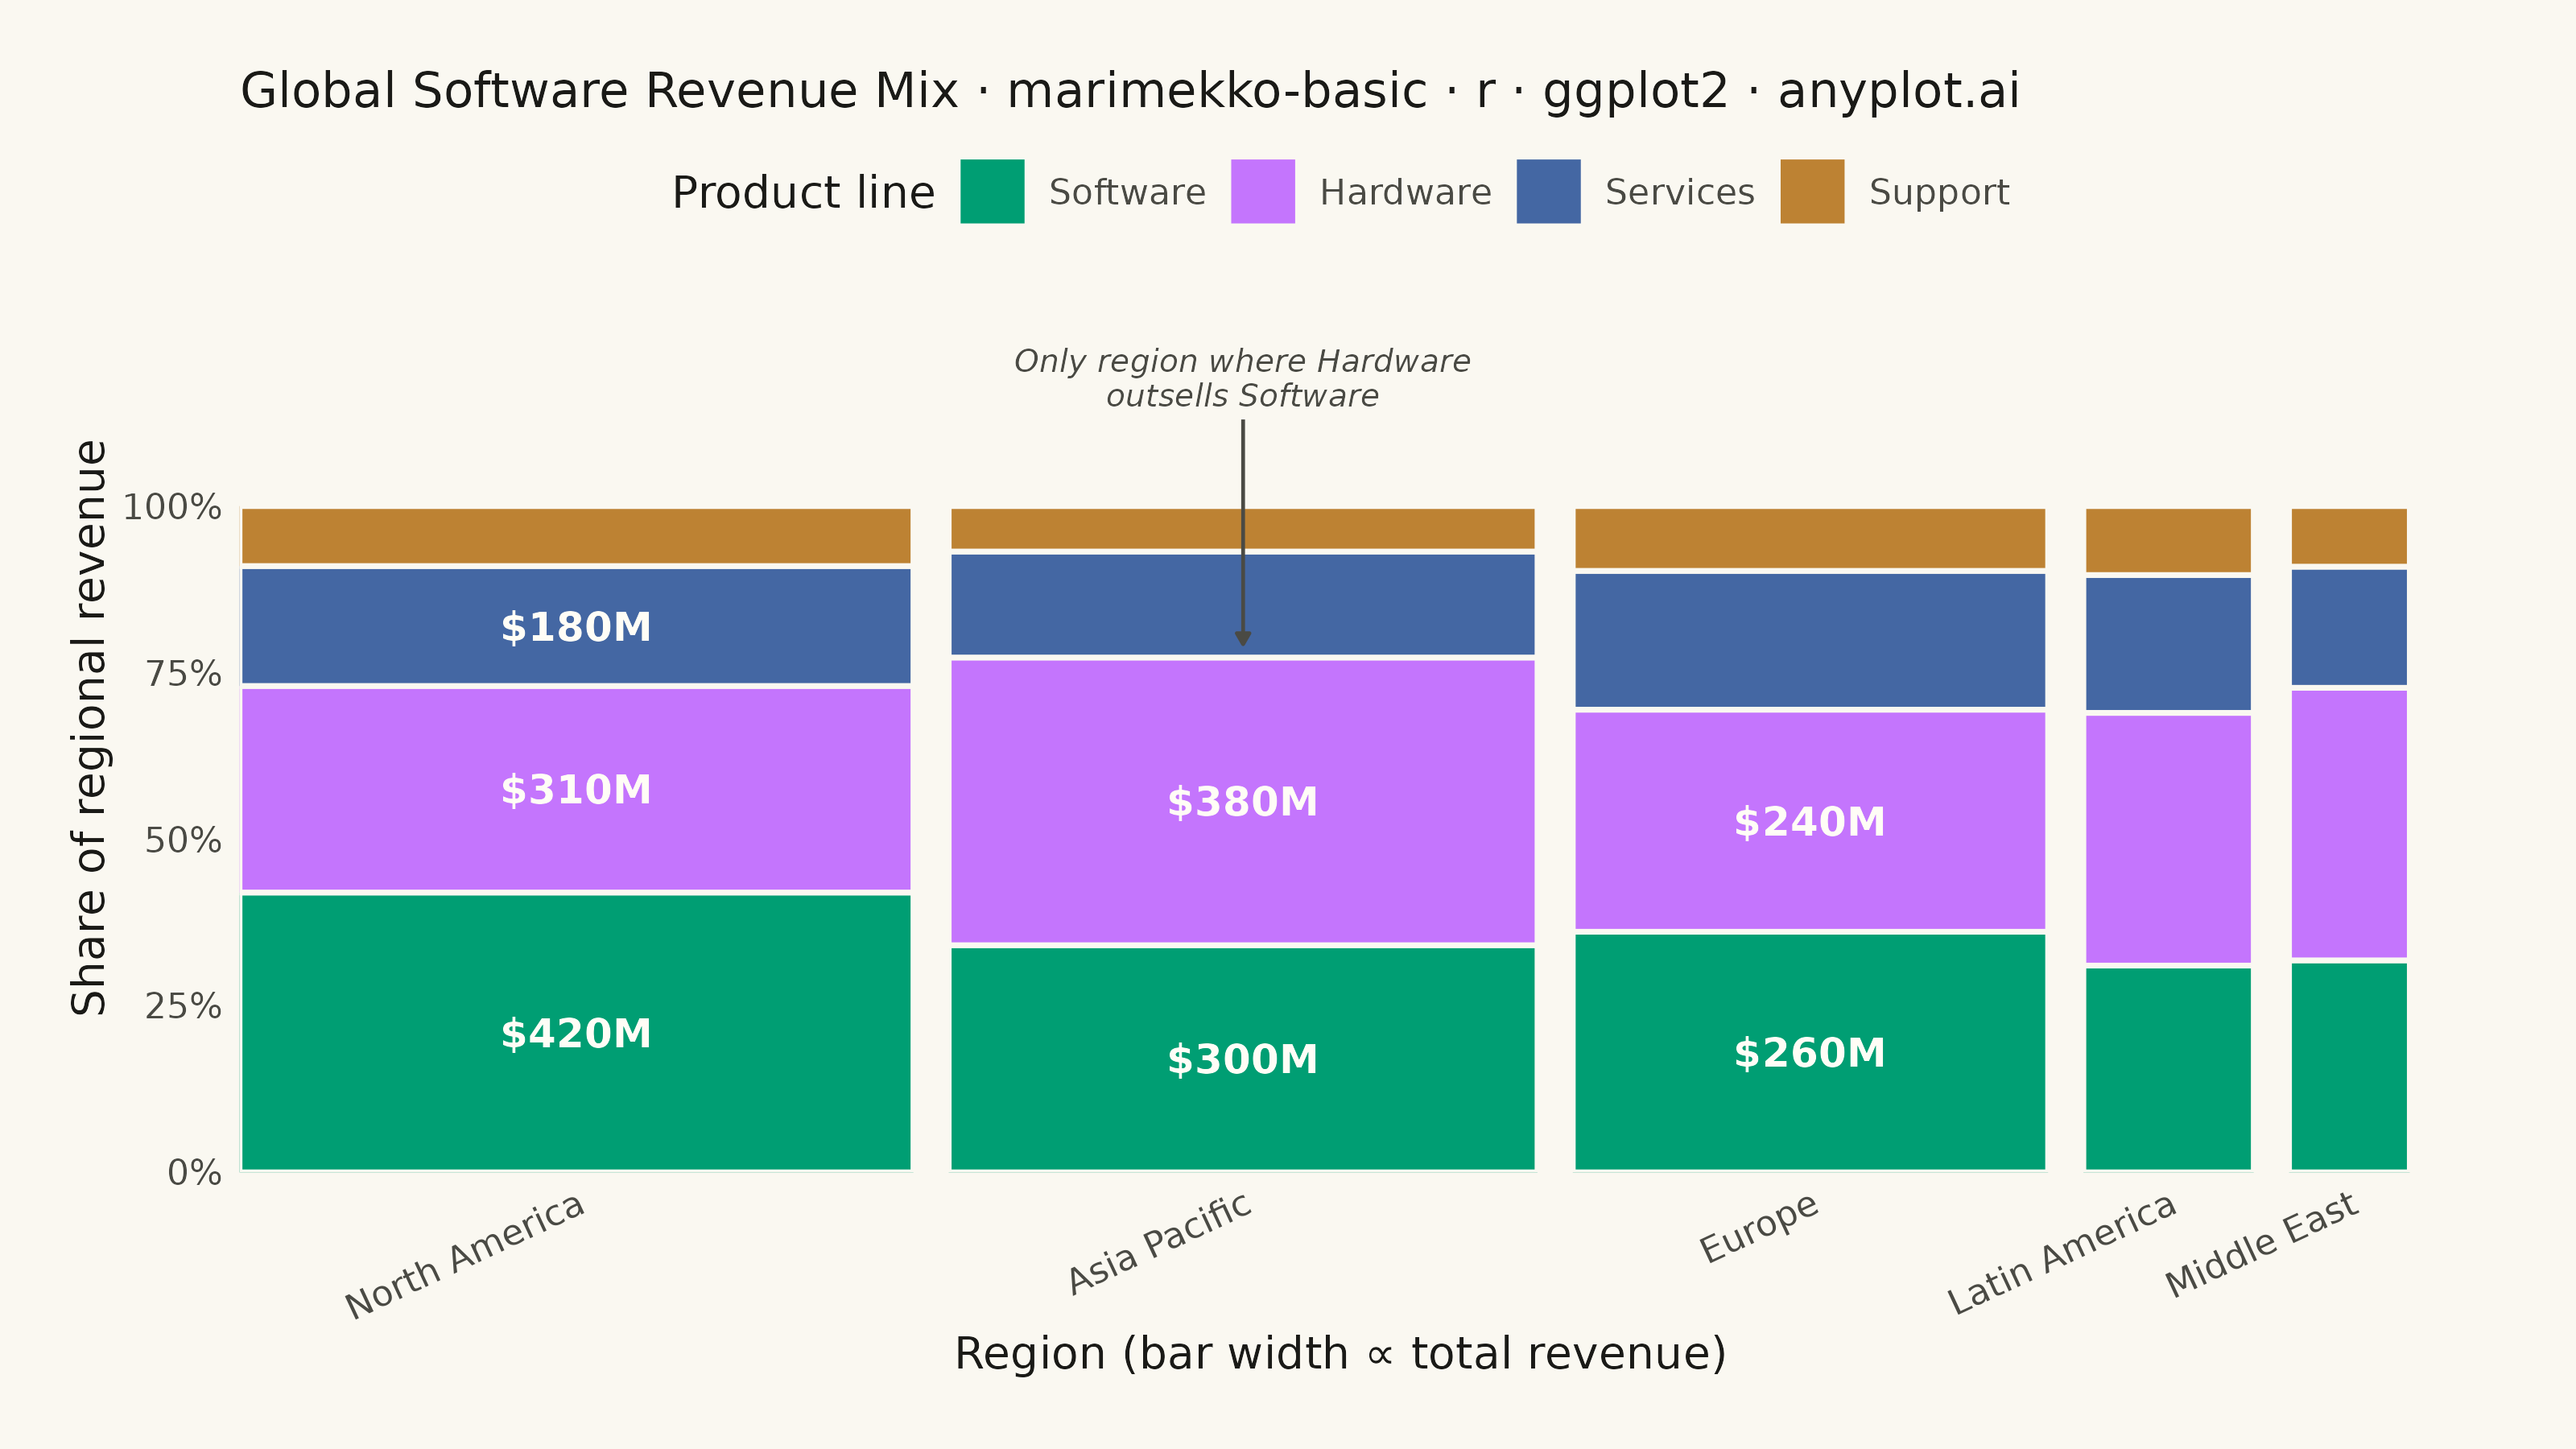
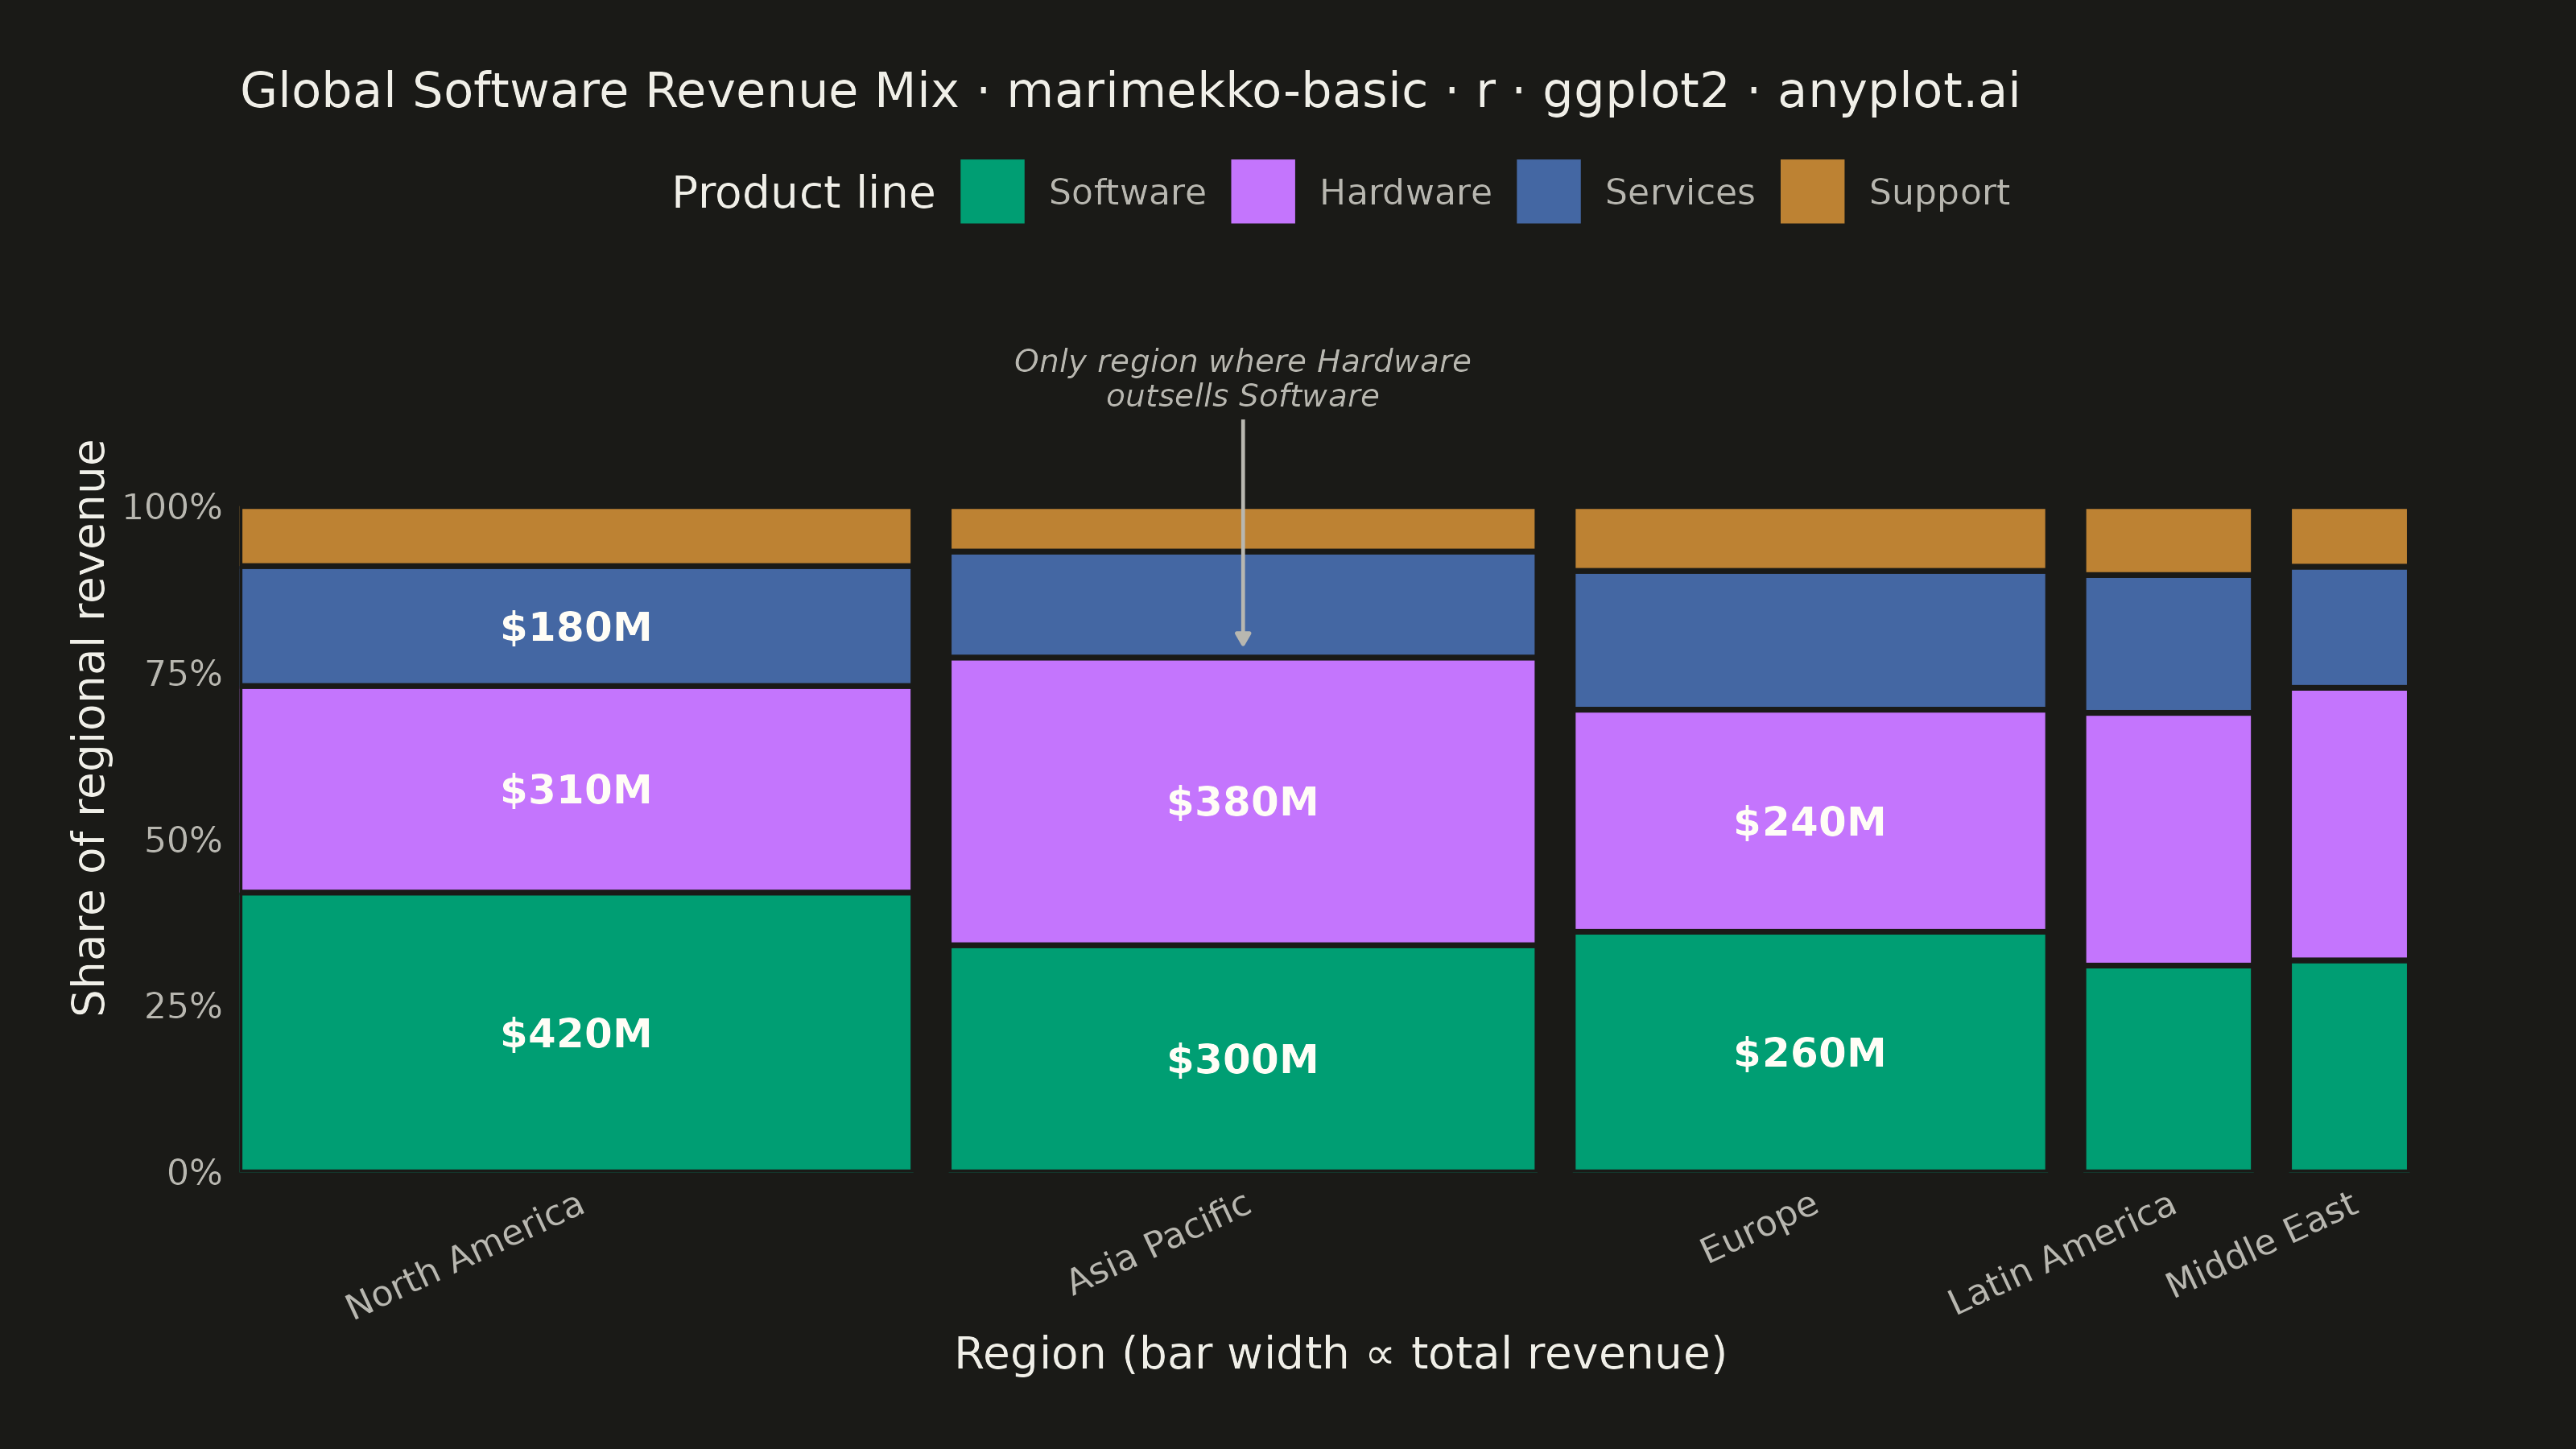
A Marimekko chart (also called mekko or mosaic plot) is a stacked bar chart where both the width and height of segments represent data values. This visualization shows two categorical dimensions simultaneously with proportional areas, making it ideal for understanding how parts relate to wholes across categories of different sizes.
#' anyplot.ai
#' marimekko-basic: Basic Marimekko Chart
#' Library: ggplot2 3.5.1 | R 4.4.1
#' Quality: 92/100 | Created: 2026-07-24

library(ggplot2)
library(dplyr)
library(ragg)

# --- Theme tokens ------------------------------------------------------------
THEME    <- Sys.getenv("ANYPLOT_THEME", "light")
PAGE_BG  <- if (THEME == "light") "#FAF8F1" else "#1A1A17"
INK      <- if (THEME == "light") "#1A1A17" else "#F0EFE8"
INK_SOFT <- if (THEME == "light") "#4A4A44" else "#B8B7B0"
LABEL_INK <- "#FFFDF6"  # near-white text sits on top of every saturated fill below

# Imprint palette (see prompts/default-style-guide.md) — first series always green
IMPRINT_PALETTE <- c("#009E73", "#C475FD", "#4467A3", "#BD8233",
                     "#AE3030", "#2ABCCD", "#954477", "#99B314")

# --- Data: global software revenue mix, region x product line (USD millions) -
revenue <- tibble::tribble(
  ~region,          ~product,    ~revenue_musd,
  "North America",  "Software",  420,
  "North America",  "Hardware",  310,
  "North America",  "Services",  180,
  "North America",  "Support",    90,
  "Asia Pacific",   "Software",  300,
  "Asia Pacific",   "Hardware",  380,
  "Asia Pacific",   "Services",  140,
  "Asia Pacific",   "Support",    60,
  "Europe",         "Software",  260,
  "Europe",         "Hardware",  240,
  "Europe",         "Services",  150,
  "Europe",         "Support",    70,
  "Latin America",  "Software",   90,
  "Latin America",  "Hardware",  110,
  "Latin America",  "Services",   60,
  "Latin America",  "Support",    30,
  "Middle East",    "Software",   70,
  "Middle East",    "Hardware",   90,
  "Middle East",    "Services",   40,
  "Middle East",    "Support",    20
)

product_levels <- c("Software", "Hardware", "Services", "Support")
revenue <- revenue %>% mutate(product = factor(product, levels = product_levels))

# Column widths ~ total revenue per region, widest region first, small gaps
# between columns so the mosaic reads as distinct bars rather than one block.
col_totals <- revenue %>%
  group_by(region) %>%
  summarise(total = sum(revenue_musd), .groups = "drop") %>%
  arrange(desc(total)) %>%
  mutate(xmax_raw = cumsum(total), xmin_raw = lag(xmax_raw, default = 0))

gap <- max(col_totals$xmax_raw) * 0.008
col_totals <- col_totals %>%
  mutate(xmin = xmin_raw + gap, xmax = xmax_raw - gap, xmid = (xmin + xmax) / 2)

region_levels <- col_totals$region

# Segment heights ~ share of the column total, stacked in a fixed product
# order so a given color occupies a comparable band across every column.
marimekko <- revenue %>%
  mutate(region = factor(region, levels = region_levels)) %>%
  left_join(col_totals, by = "region") %>%
  arrange(region, product) %>%
  group_by(region) %>%
  mutate(
    share    = revenue_musd / total,
    ymax     = cumsum(share),
    ymin     = lag(ymax, default = 0),
    label_y  = (ymin + ymax) / 2,
    seg_area = (xmax - xmin) * (ymax - ymin)
  ) %>%
  ungroup()

area_threshold <- sum(col_totals$total) * 0.05

# --- Callout: Asia Pacific is the only region where Hardware outsells Software
apac_col  <- col_totals %>% filter(region == "Asia Pacific")
apac_hw   <- marimekko  %>% filter(region == "Asia Pacific", product == "Hardware")

# --- Title (fontsize scales with length; see default-style-guide.md) --------
plot_title <- "Global Software Revenue Mix · marimekko-basic · r · ggplot2 · anyplot.ai"
title_fontsize <- max(8, round(12 * min(1, 67 / nchar(plot_title))))

# --- Plot ---------------------------------------------------------------------
p <- ggplot(marimekko) +
  geom_rect(aes(xmin = xmin, xmax = xmax, ymin = ymin, ymax = ymax, fill = product),
            color = PAGE_BG, linewidth = 0.6) +
  geom_text(
    data = filter(marimekko, seg_area > area_threshold),
    aes(x = xmid, y = label_y, label = paste0("$", revenue_musd, "M")),
    color = LABEL_INK, size = 3.2, fontface = "bold"
  ) +
  scale_x_continuous(
    breaks = col_totals$xmid, labels = col_totals$region,
    expand = expansion(mult = c(0, 0.015))
  ) +
  scale_y_continuous(
    breaks = seq(0, 1, 0.25), labels = scales::percent_format(accuracy = 1),
    expand = expansion(mult = c(0, 0.16))
  ) +
  scale_fill_manual(values = IMPRINT_PALETTE[seq_along(product_levels)], name = "Product line") +
  annotate(
    "curve", x = apac_col$xmid, xend = apac_col$xmid,
    y = 1.13, yend = apac_hw$ymax + 0.02,
    curvature = 0, linewidth = 0.4, color = INK_SOFT,
    arrow = arrow(length = unit(0.1, "cm"), type = "closed")
  ) +
  annotate(
    "text", x = apac_col$xmid, y = 1.15,
    label = "Only region where Hardware\noutsells Software",
    color = INK_SOFT, size = 2.5, fontface = "italic",
    lineheight = 0.9, vjust = 0
  ) +
  labs(
    title = plot_title,
    x = "Region (bar width ∝ total revenue)",
    y = "Share of regional revenue"
  ) +
  theme_minimal(base_size = 8) +
  theme(
    plot.background   = element_rect(fill = PAGE_BG, color = PAGE_BG),
    panel.background  = element_rect(fill = PAGE_BG, color = NA),
    panel.grid        = element_blank(),
    axis.title        = element_text(color = INK, size = 10),
    axis.text.x       = element_text(color = INK_SOFT, size = 8, angle = 25, hjust = 1),
    axis.text.y       = element_text(color = INK_SOFT, size = 8),
    axis.ticks        = element_blank(),
    axis.line         = element_blank(),
    plot.title        = element_text(color = INK, size = title_fontsize),
    plot.margin       = margin(t = 16, r = 30, b = 16, l = 16),
    legend.background = element_rect(fill = PAGE_BG, color = NA),
    legend.key        = element_rect(fill = PAGE_BG, color = NA),
    legend.text       = element_text(color = INK_SOFT, size = 8),
    legend.title      = element_text(color = INK, size = 10),
    legend.position   = "top"
  )

# --- Save ---------------------------------------------------------------------
ggsave(
  filename = sprintf("plot-%s.png", THEME),
  plot     = p,
  device   = ragg::agg_png,
  width    = 8,
  height   = 4.5,
  units    = "in",
  dpi      = 400
)
Runnable source as JSON, for any HTTP client: https://api.anyplot.ai/specs/marimekko-basic/ggplot2/code. Any spec id and library id listed in llms-full.txt fit the same URL shape; every URL below is complete and callable.
{
  "spec_id": "marimekko-basic",
  "language": "r",
  "library": "ggplot2",
  "page": "https://anyplot.ai/marimekko-basic/r/ggplot2",
  "hub": "https://anyplot.ai/marimekko-basic",
  "code_json": "https://api.anyplot.ai/specs/marimekko-basic/ggplot2/code",
  "spec_json": "https://api.anyplot.ai/specs/marimekko-basic",
  "render_light_png": "https://storage.googleapis.com/anyplot-images/plots/marimekko-basic/r/ggplot2/plot-light.png",
  "render_dark_png": "https://storage.googleapis.com/anyplot-images/plots/marimekko-basic/r/ggplot2/plot-dark.png",
  "quality_score": 92.0,
  "license": "MIT",
  "guide": "https://anyplot.ai/llms.txt"
}
Part of Basic Marimekko Chart on anyplot.ai.