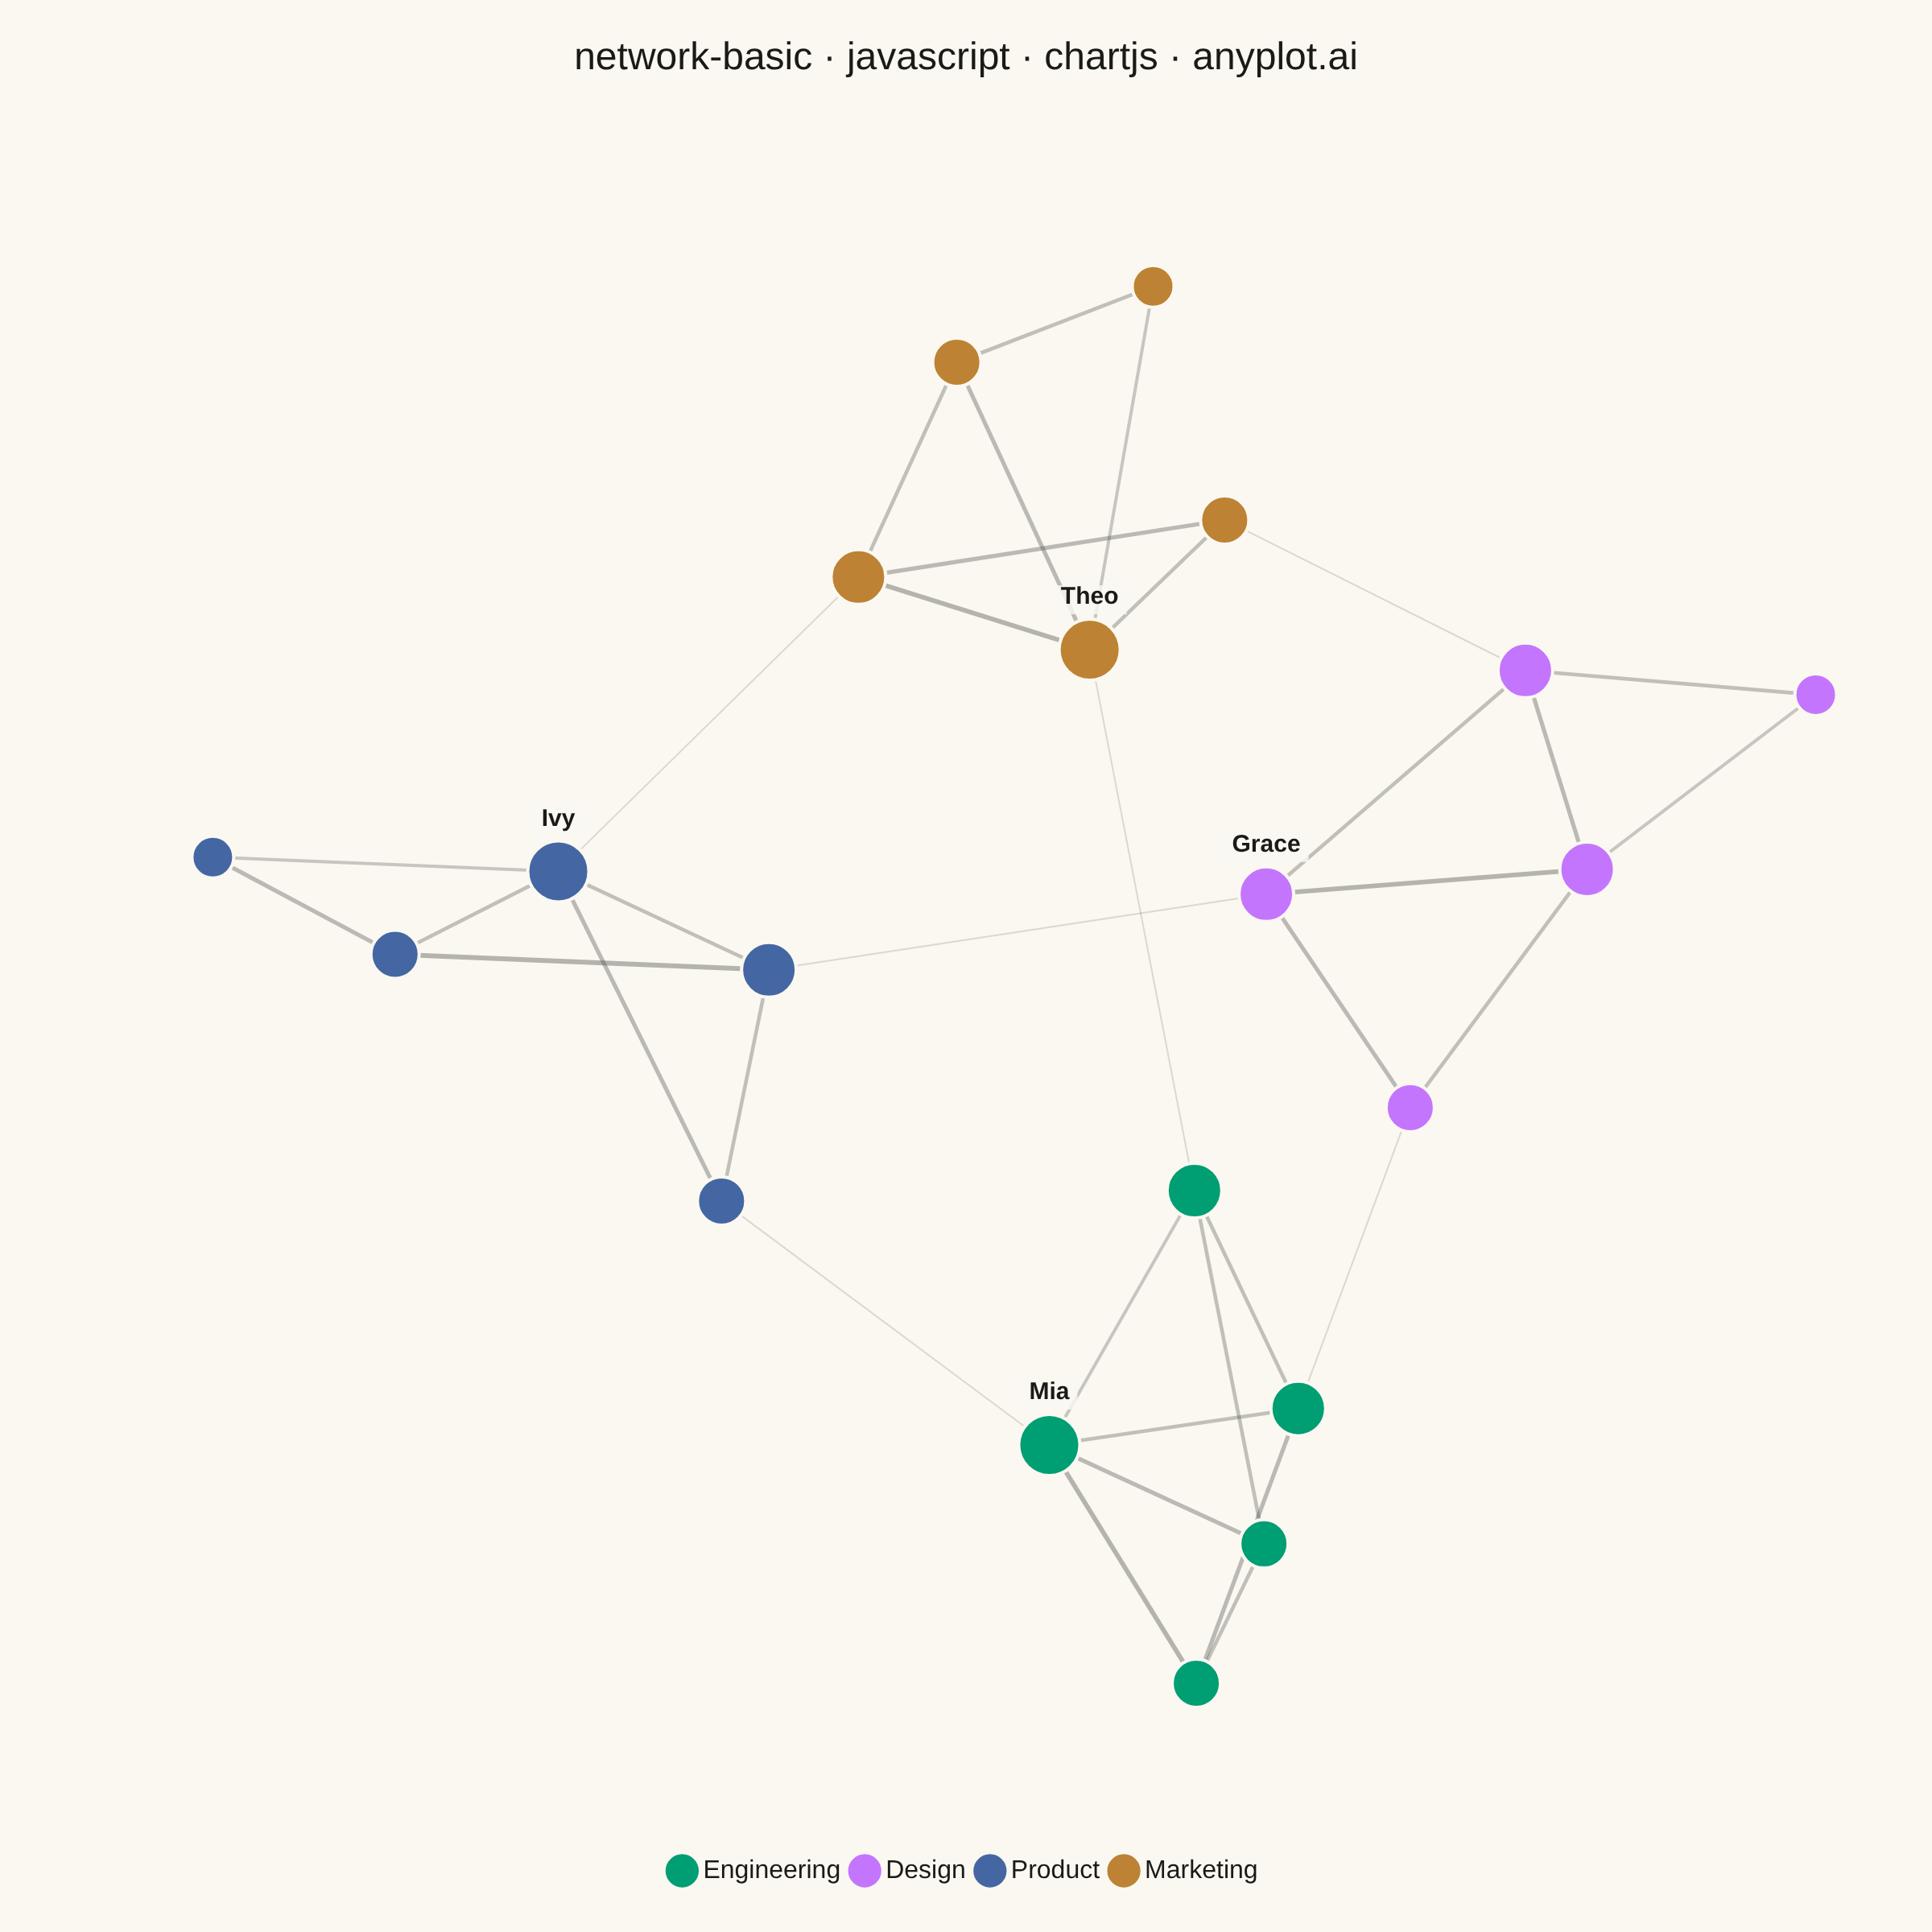
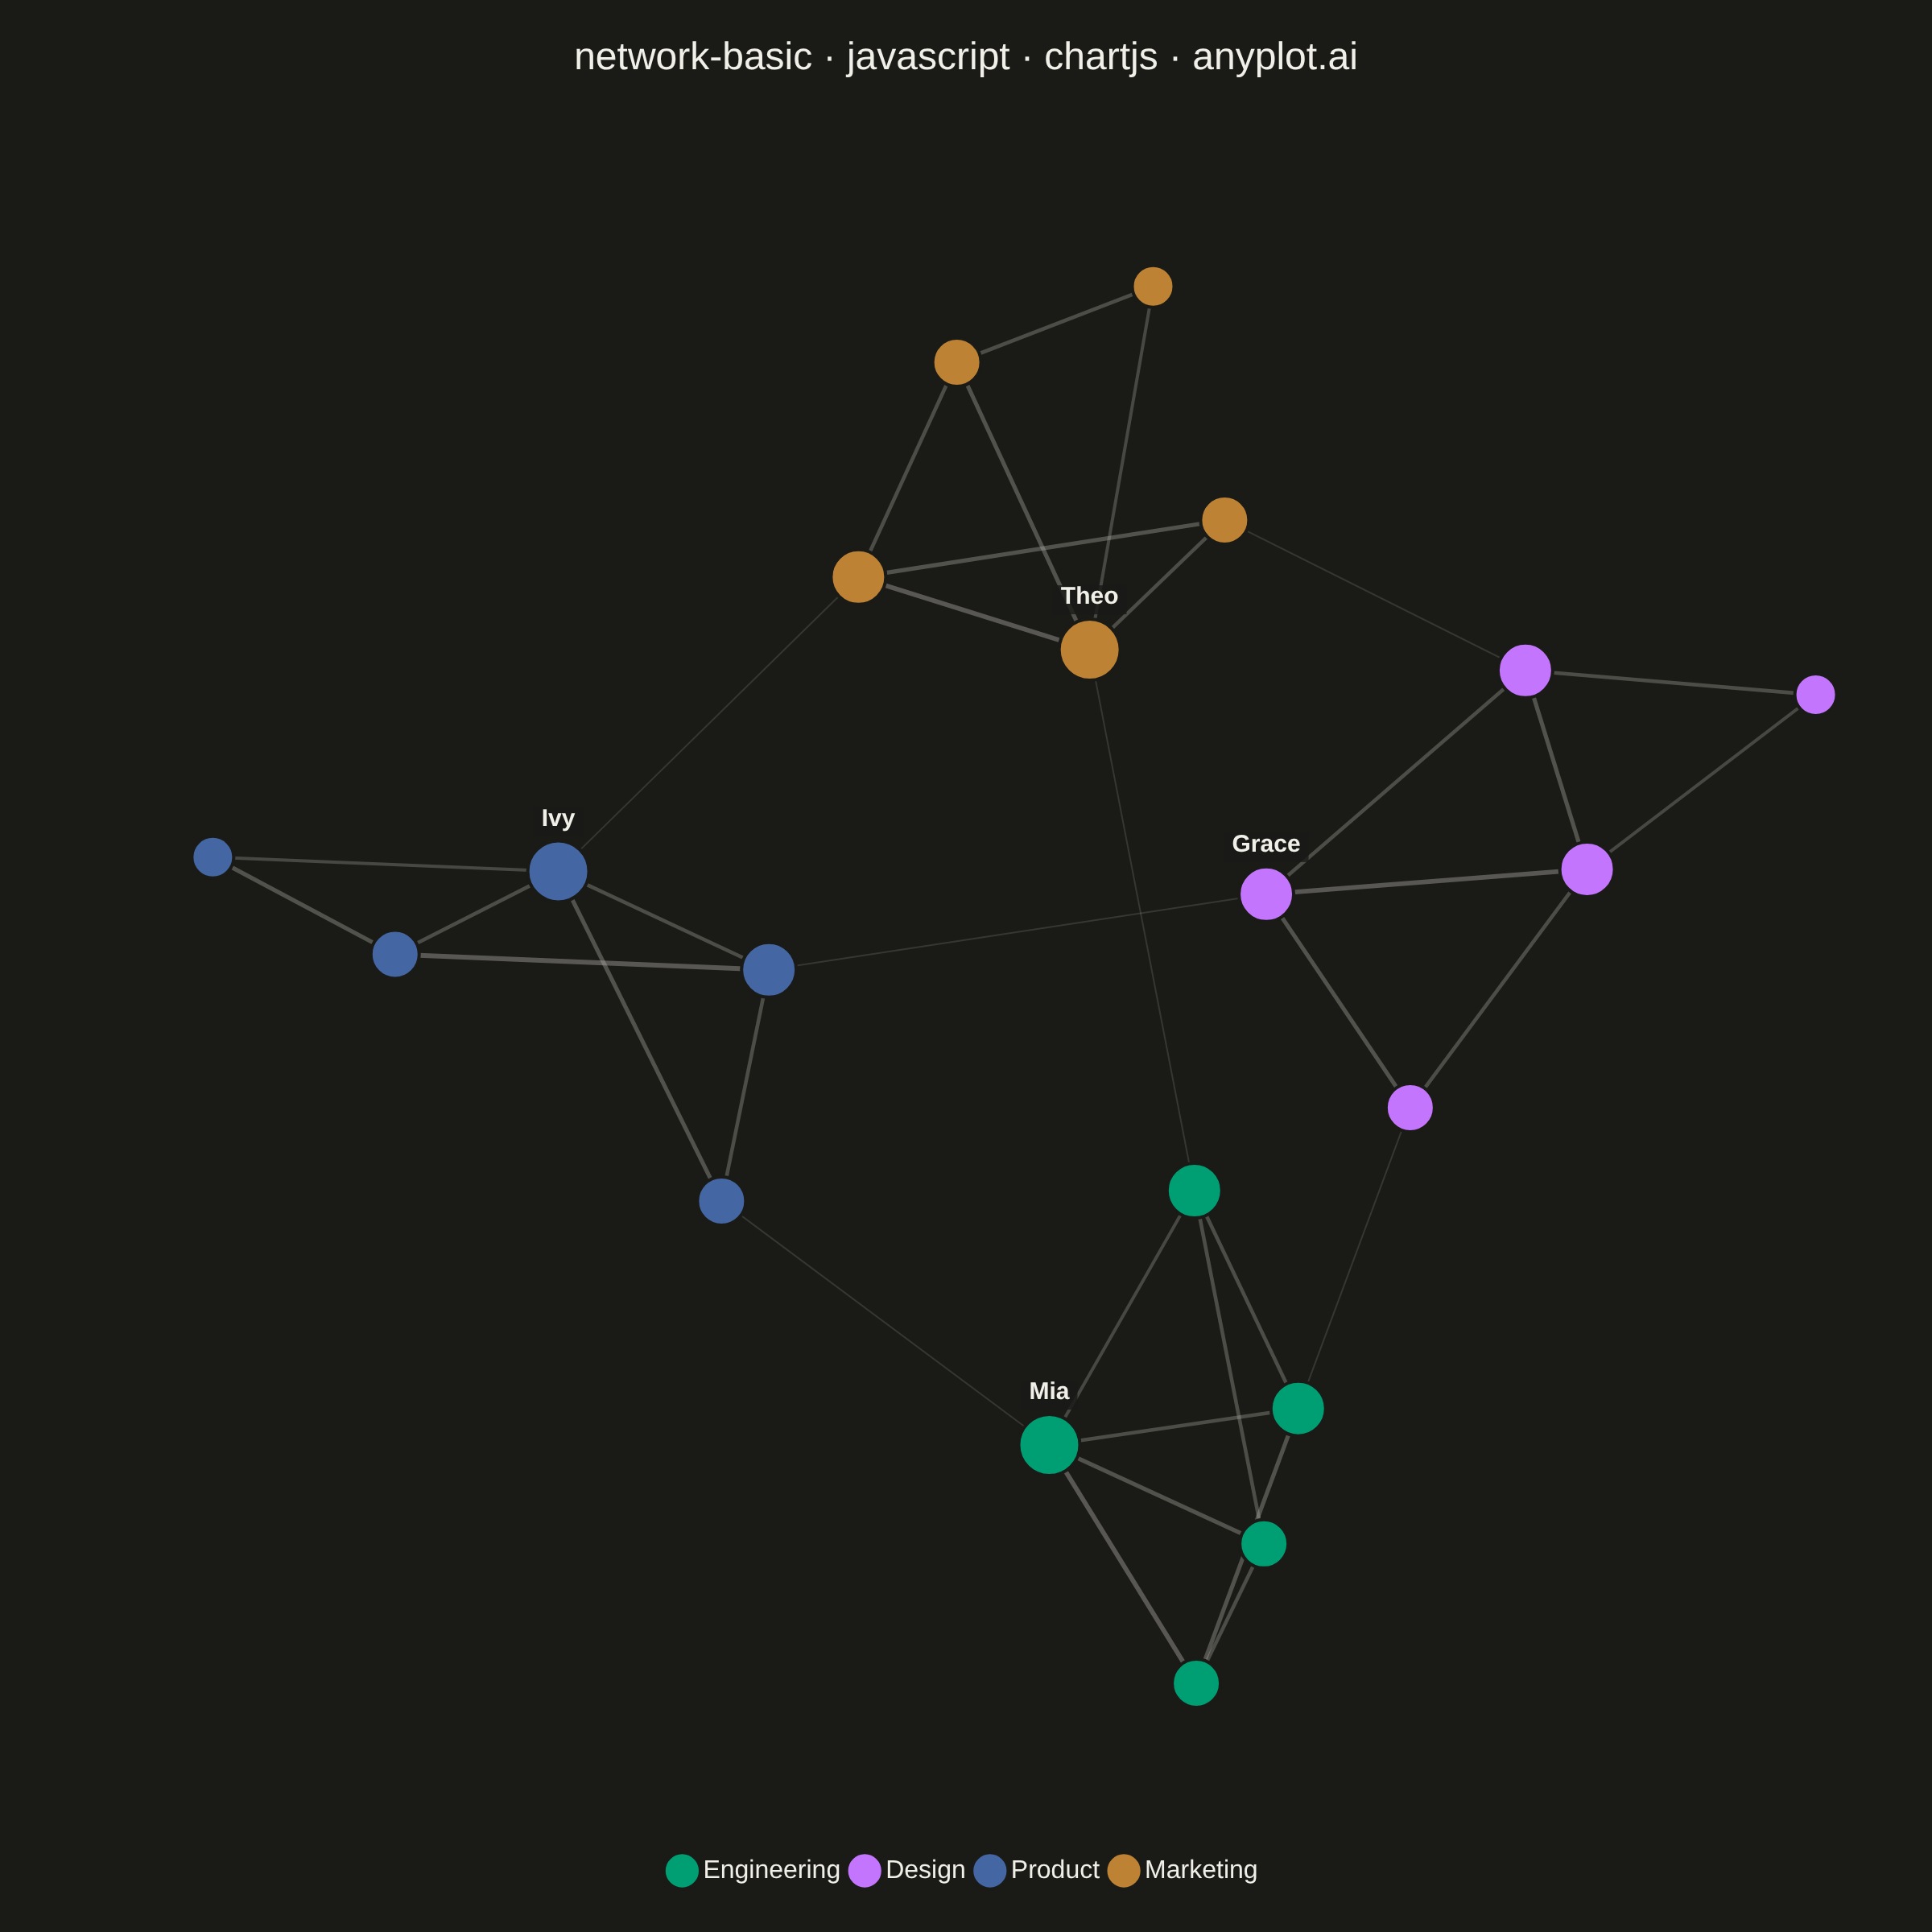
The same plot in 14 other libraries — JavaScript: D3.js, Apache ECharts, Highcharts, MUI X Charts; Python: Altair, Bokeh, lets-plot, Matplotlib, Plotly, plotnine, Pygal, Seaborn; R: ggplot2; Julia: Makie.jl. Compare all 15 side by side: Basic Network Graph in Python, R, Julia and JavaScript.
A network graph (node-link diagram) visualizes relationships between entities as nodes connected by edges. It reveals the structure of connections, clusters, and central nodes in relational data. Network graphs are essential for understanding complex systems where relationships matter as much as the entities themselves, making hidden patterns of connectivity visible at a glance.
// anyplot.ai
// network-basic: Basic Network Graph
// Library: chartjs 4.4.7 | JavaScript 22.23.1
// Quality: 92/100 | Created: 2026-07-24
//# anyplot-orientation: square

const t = window.ANYPLOT_TOKENS;

// --- Data: a small company collaboration network, grouped by department ---
const GROUP_NAMES = ["Engineering", "Design", "Product", "Marketing"];

const nodes = [
  { id: 0, name: "Ava", group: 0 },
  { id: 1, name: "Noah", group: 0 },
  { id: 2, name: "Mia", group: 0 },
  { id: 3, name: "Ethan", group: 0 },
  { id: 4, name: "Zoe", group: 0 },
  { id: 5, name: "Liam", group: 1 },
  { id: 6, name: "Grace", group: 1 },
  { id: 7, name: "Kai", group: 1 },
  { id: 8, name: "Nora", group: 1 },
  { id: 9, name: "Owen", group: 1 },
  { id: 10, name: "Maya", group: 2 },
  { id: 11, name: "Leo", group: 2 },
  { id: 12, name: "Ivy", group: 2 },
  { id: 13, name: "Finn", group: 2 },
  { id: 14, name: "Ruby", group: 2 },
  { id: 15, name: "Jack", group: 3 },
  { id: 16, name: "Elena", group: 3 },
  { id: 17, name: "Theo", group: 3 },
  { id: 18, name: "Luna", group: 3 },
  { id: 19, name: "Max", group: 3 },
];

// Edge tuples are [source, target, weight] — weight is a 1-5 tie-strength
// (e.g. weekly collaboration touchpoints). Cross-department bridges carry a
// deliberately low weight since they represent occasional handoffs, not the
// tight day-to-day ties within a team.
const edges = [
  [0, 1, 4], [0, 2, 3], [1, 2, 5], [1, 3, 3], [2, 3, 4], [3, 4, 3], [2, 4, 2], [0, 4, 3],
  [5, 6, 4], [5, 7, 3], [6, 7, 5], [6, 8, 3], [7, 8, 4], [8, 9, 3], [7, 9, 2],
  [10, 11, 3], [10, 12, 4], [11, 12, 3], [11, 13, 5], [12, 13, 3], [13, 14, 4], [12, 14, 2],
  [15, 16, 4], [15, 17, 3], [16, 17, 5], [16, 18, 3], [17, 18, 4], [18, 19, 3], [17, 19, 2],
  [0, 5, 1], [2, 10, 1], [6, 11, 2], [8, 15, 1], [12, 16, 1], [4, 17, 2],
];

// Degree (connection count) per node — drives marker size
const degree = new Array(nodes.length).fill(0);
edges.forEach(([a, b]) => {
  degree[a] += 1;
  degree[b] += 1;
});

// Radius follows degree so hub nodes read as visually larger — shared by the
// node datasets below and the hub-label plugin so both stay in sync.
const nodeRadius = (id) => 9 + degree[id] * 2;

// Highest-degree node per department — labeled directly on the canvas so the
// static PNG conveys individual identity, not just department color.
const hubs = GROUP_NAMES.map((_, g) => {
  const members = nodes.filter((node) => node.group === g);
  return members.reduce((best, node) => (degree[node.id] > degree[best.id] ? node : best));
});

// --- Force-directed layout (Fruchterman-Reingold), deterministic via a fixed-seed LCG ---
function lcg(seed) {
  let s = seed;
  return () => {
    s = (s * 1664525 + 1013904223) % 4294967296;
    return s / 4294967296;
  };
}
const rand = lcg(42);

const nodeCount = nodes.length;
const area = 4; // layout unfolds inside a [-1, 1] x [-1, 1] square
const k = Math.sqrt(area / nodeCount);
const pos = nodes.map(() => ({ x: rand() * 2 - 1, y: rand() * 2 - 1 }));

let temperature = 0.15;
const iterations = 400;
for (let iter = 0; iter < iterations; iter++) {
  const disp = pos.map(() => ({ x: 0, y: 0 }));

  // Repulsion between every pair of nodes keeps clusters from collapsing
  for (let i = 0; i < nodeCount; i++) {
    for (let j = i + 1; j < nodeCount; j++) {
      let dx = pos[i].x - pos[j].x;
      let dy = pos[i].y - pos[j].y;
      const dist = Math.max(Math.sqrt(dx * dx + dy * dy), 0.01);
      const force = (k * k) / dist;
      dx = (dx / dist) * force;
      dy = (dy / dist) * force;
      disp[i].x += dx;
      disp[i].y += dy;
      disp[j].x -= dx;
      disp[j].y -= dy;
    }
  }

  // Attraction along edges pulls connected nodes together
  edges.forEach(([a, b]) => {
    let dx = pos[a].x - pos[b].x;
    let dy = pos[a].y - pos[b].y;
    const dist = Math.max(Math.sqrt(dx * dx + dy * dy), 0.01);
    const force = (dist * dist) / k;
    dx = (dx / dist) * force;
    dy = (dy / dist) * force;
    disp[a].x -= dx;
    disp[a].y -= dy;
    disp[b].x += dx;
    disp[b].y += dy;
  });

  // Apply displacement, capped by the cooling temperature
  for (let i = 0; i < nodeCount; i++) {
    const d = Math.max(Math.sqrt(disp[i].x ** 2 + disp[i].y ** 2), 0.0001);
    pos[i].x += (disp[i].x / d) * Math.min(d, temperature);
    pos[i].y += (disp[i].y / d) * Math.min(d, temperature);
  }
  temperature *= 0.99;
}

// Symmetric bound (with padding) so the square canvas isn't stretched
const bound =
  Math.max(...pos.map((p) => Math.max(Math.abs(p.x), Math.abs(p.y)))) * 1.08;
nodes.forEach((node, i) => {
  node.x = pos[i].x;
  node.y = pos[i].y;
});

// --- Mount ---
const canvas = document.createElement("canvas");
document.getElementById("container").appendChild(canvas);

// --- Edges: drawn under the node markers via a lightweight inline plugin ---
// Intra-department ties render heavier and darker (weight-scaled); cross-
// department bridges render thin and faint so the community structure — not
// just the connections — is legible at a glance.
const edgePlugin = {
  id: "networkEdges",
  beforeDatasetsDraw(chart) {
    const { ctx, scales } = chart;
    ctx.save();
    ctx.strokeStyle = t.inkSoft;
    edges.forEach(([a, b, weight]) => {
      const bridge = nodes[a].group !== nodes[b].group;
      ctx.globalAlpha = bridge ? 0.18 : 0.22 + weight * 0.035;
      ctx.lineWidth = bridge ? 1 : 1.4 + weight * 0.3;
      ctx.beginPath();
      ctx.moveTo(scales.x.getPixelForValue(nodes[a].x), scales.y.getPixelForValue(nodes[a].y));
      ctx.lineTo(scales.x.getPixelForValue(nodes[b].x), scales.y.getPixelForValue(nodes[b].y));
      ctx.stroke();
    });
    ctx.restore();
  },
};

// --- Hub labels: name tags for the highest-degree node per department,
// drawn on top of everything so the static PNG identifies key individuals ---
const hubLabelPlugin = {
  id: "networkHubLabels",
  afterDatasetsDraw(chart) {
    const { ctx, scales } = chart;
    ctx.save();
    ctx.font = "600 15px sans-serif";
    ctx.textAlign = "center";
    ctx.textBaseline = "bottom";
    hubs.forEach((node) => {
      const x = scales.x.getPixelForValue(node.x);
      const y = scales.y.getPixelForValue(node.y) - nodeRadius(node.id) - 6;
      const text = node.name;
      const padX = 5;
      const { width } = ctx.measureText(text);
      ctx.fillStyle = t.pageBg;
      ctx.globalAlpha = 0.82;
      ctx.fillRect(x - width / 2 - padX, y - 15, width + padX * 2, 18);
      ctx.globalAlpha = 1;
      ctx.fillStyle = t.ink;
      ctx.fillText(text, x, y);
    });
    ctx.restore();
  },
};

// --- Nodes: one dataset per department so the legend reads as group color ---
const groupNodes = GROUP_NAMES.map((_, g) => nodes.filter((node) => node.group === g));
const datasets = groupNodes.map((group, g) => ({
  label: GROUP_NAMES[g],
  data: group.map((node) => ({ x: node.x, y: node.y })),
  backgroundColor: t.palette[g],
  borderColor: t.pageBg,
  borderWidth: 2,
  pointRadius: group.map((node) => nodeRadius(node.id)),
  pointHoverRadius: group.map((node) => nodeRadius(node.id) + 4),
  showLine: false,
}));

// --- Chart ---
new Chart(canvas, {
  type: "scatter",
  data: { datasets },
  plugins: [edgePlugin, hubLabelPlugin],
  options: {
    responsive: true,
    maintainAspectRatio: false,
    animation: false,
    layout: {
      padding: { top: 10, right: 30, bottom: 20, left: 30 },
    },
    plugins: {
      title: {
        display: true,
        text: "network-basic · javascript · chartjs · anyplot.ai",
        color: t.ink,
        font: { size: 24, weight: "normal" },
        padding: { top: 12, bottom: 16 },
      },
      legend: {
        display: true,
        position: "bottom",
        labels: { color: t.ink, font: { size: 16 }, usePointStyle: true, boxWidth: 10 },
      },
      tooltip: {
        callbacks: {
          title: (items) => (items.length ? GROUP_NAMES[items[0].datasetIndex] : ""),
          label: (item) => {
            const node = groupNodes[item.datasetIndex][item.dataIndex];
            return `${node.name} — ${degree[node.id]} connections`;
          },
        },
      },
    },
    scales: {
      x: { display: false, min: -bound, max: bound },
      y: { display: false, min: -bound, max: bound },
    },
  },
});
Runnable source as JSON, for any HTTP client: https://api.anyplot.ai/specs/network-basic/chartjs/code. Any spec id and library id listed in llms-full.txt fit the same URL shape; every URL below is complete and callable.
{
  "spec_id": "network-basic",
  "language": "javascript",
  "library": "chartjs",
  "page": "https://anyplot.ai/network-basic/javascript/chartjs",
  "hub": "https://anyplot.ai/network-basic",
  "code_json": "https://api.anyplot.ai/specs/network-basic/chartjs/code",
  "spec_json": "https://api.anyplot.ai/specs/network-basic",
  "render_light_png": "https://storage.googleapis.com/anyplot-images/plots/network-basic/javascript/chartjs/plot-light.png",
  "render_dark_png": "https://storage.googleapis.com/anyplot-images/plots/network-basic/javascript/chartjs/plot-dark.png",
  "interactive_light_html": "https://storage.googleapis.com/anyplot-images/plots/network-basic/javascript/chartjs/plot-light.html",
  "interactive_dark_html": "https://storage.googleapis.com/anyplot-images/plots/network-basic/javascript/chartjs/plot-dark.html",
  "quality_score": 92.0,
  "license": "MIT",
  "guide": "https://anyplot.ai/llms.txt"
}
Part of Basic Network Graph on anyplot.ai.