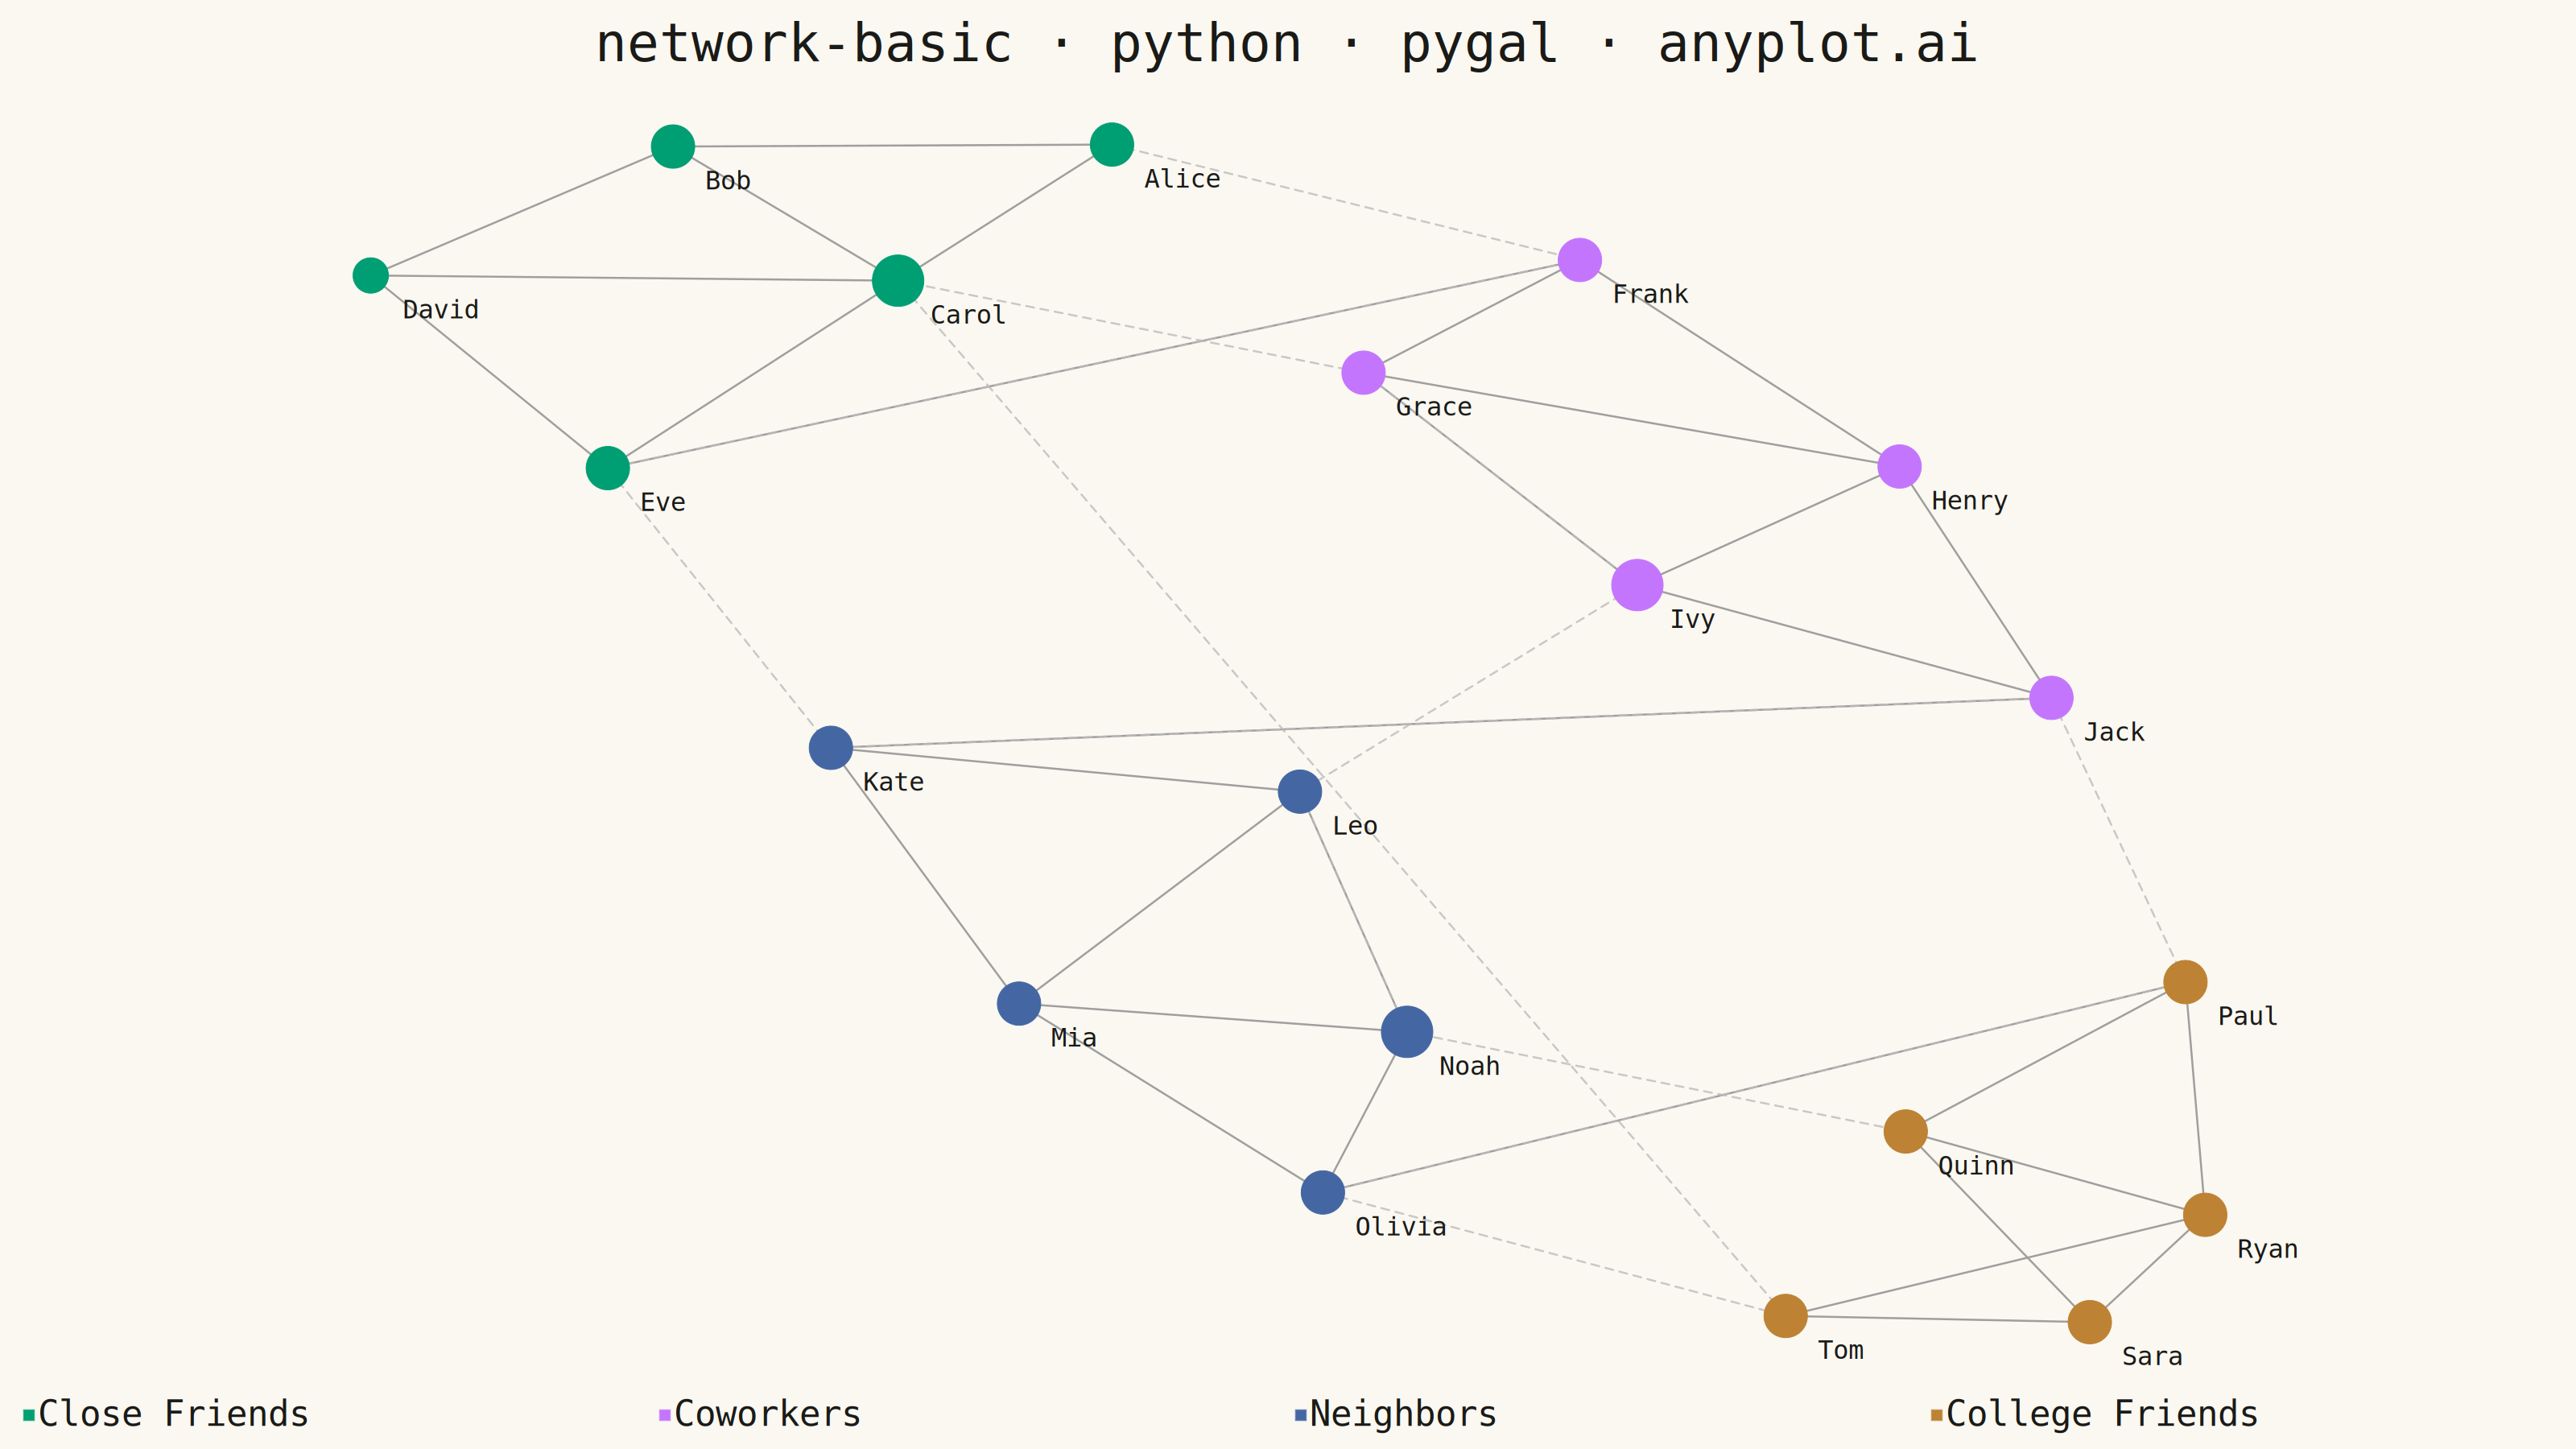
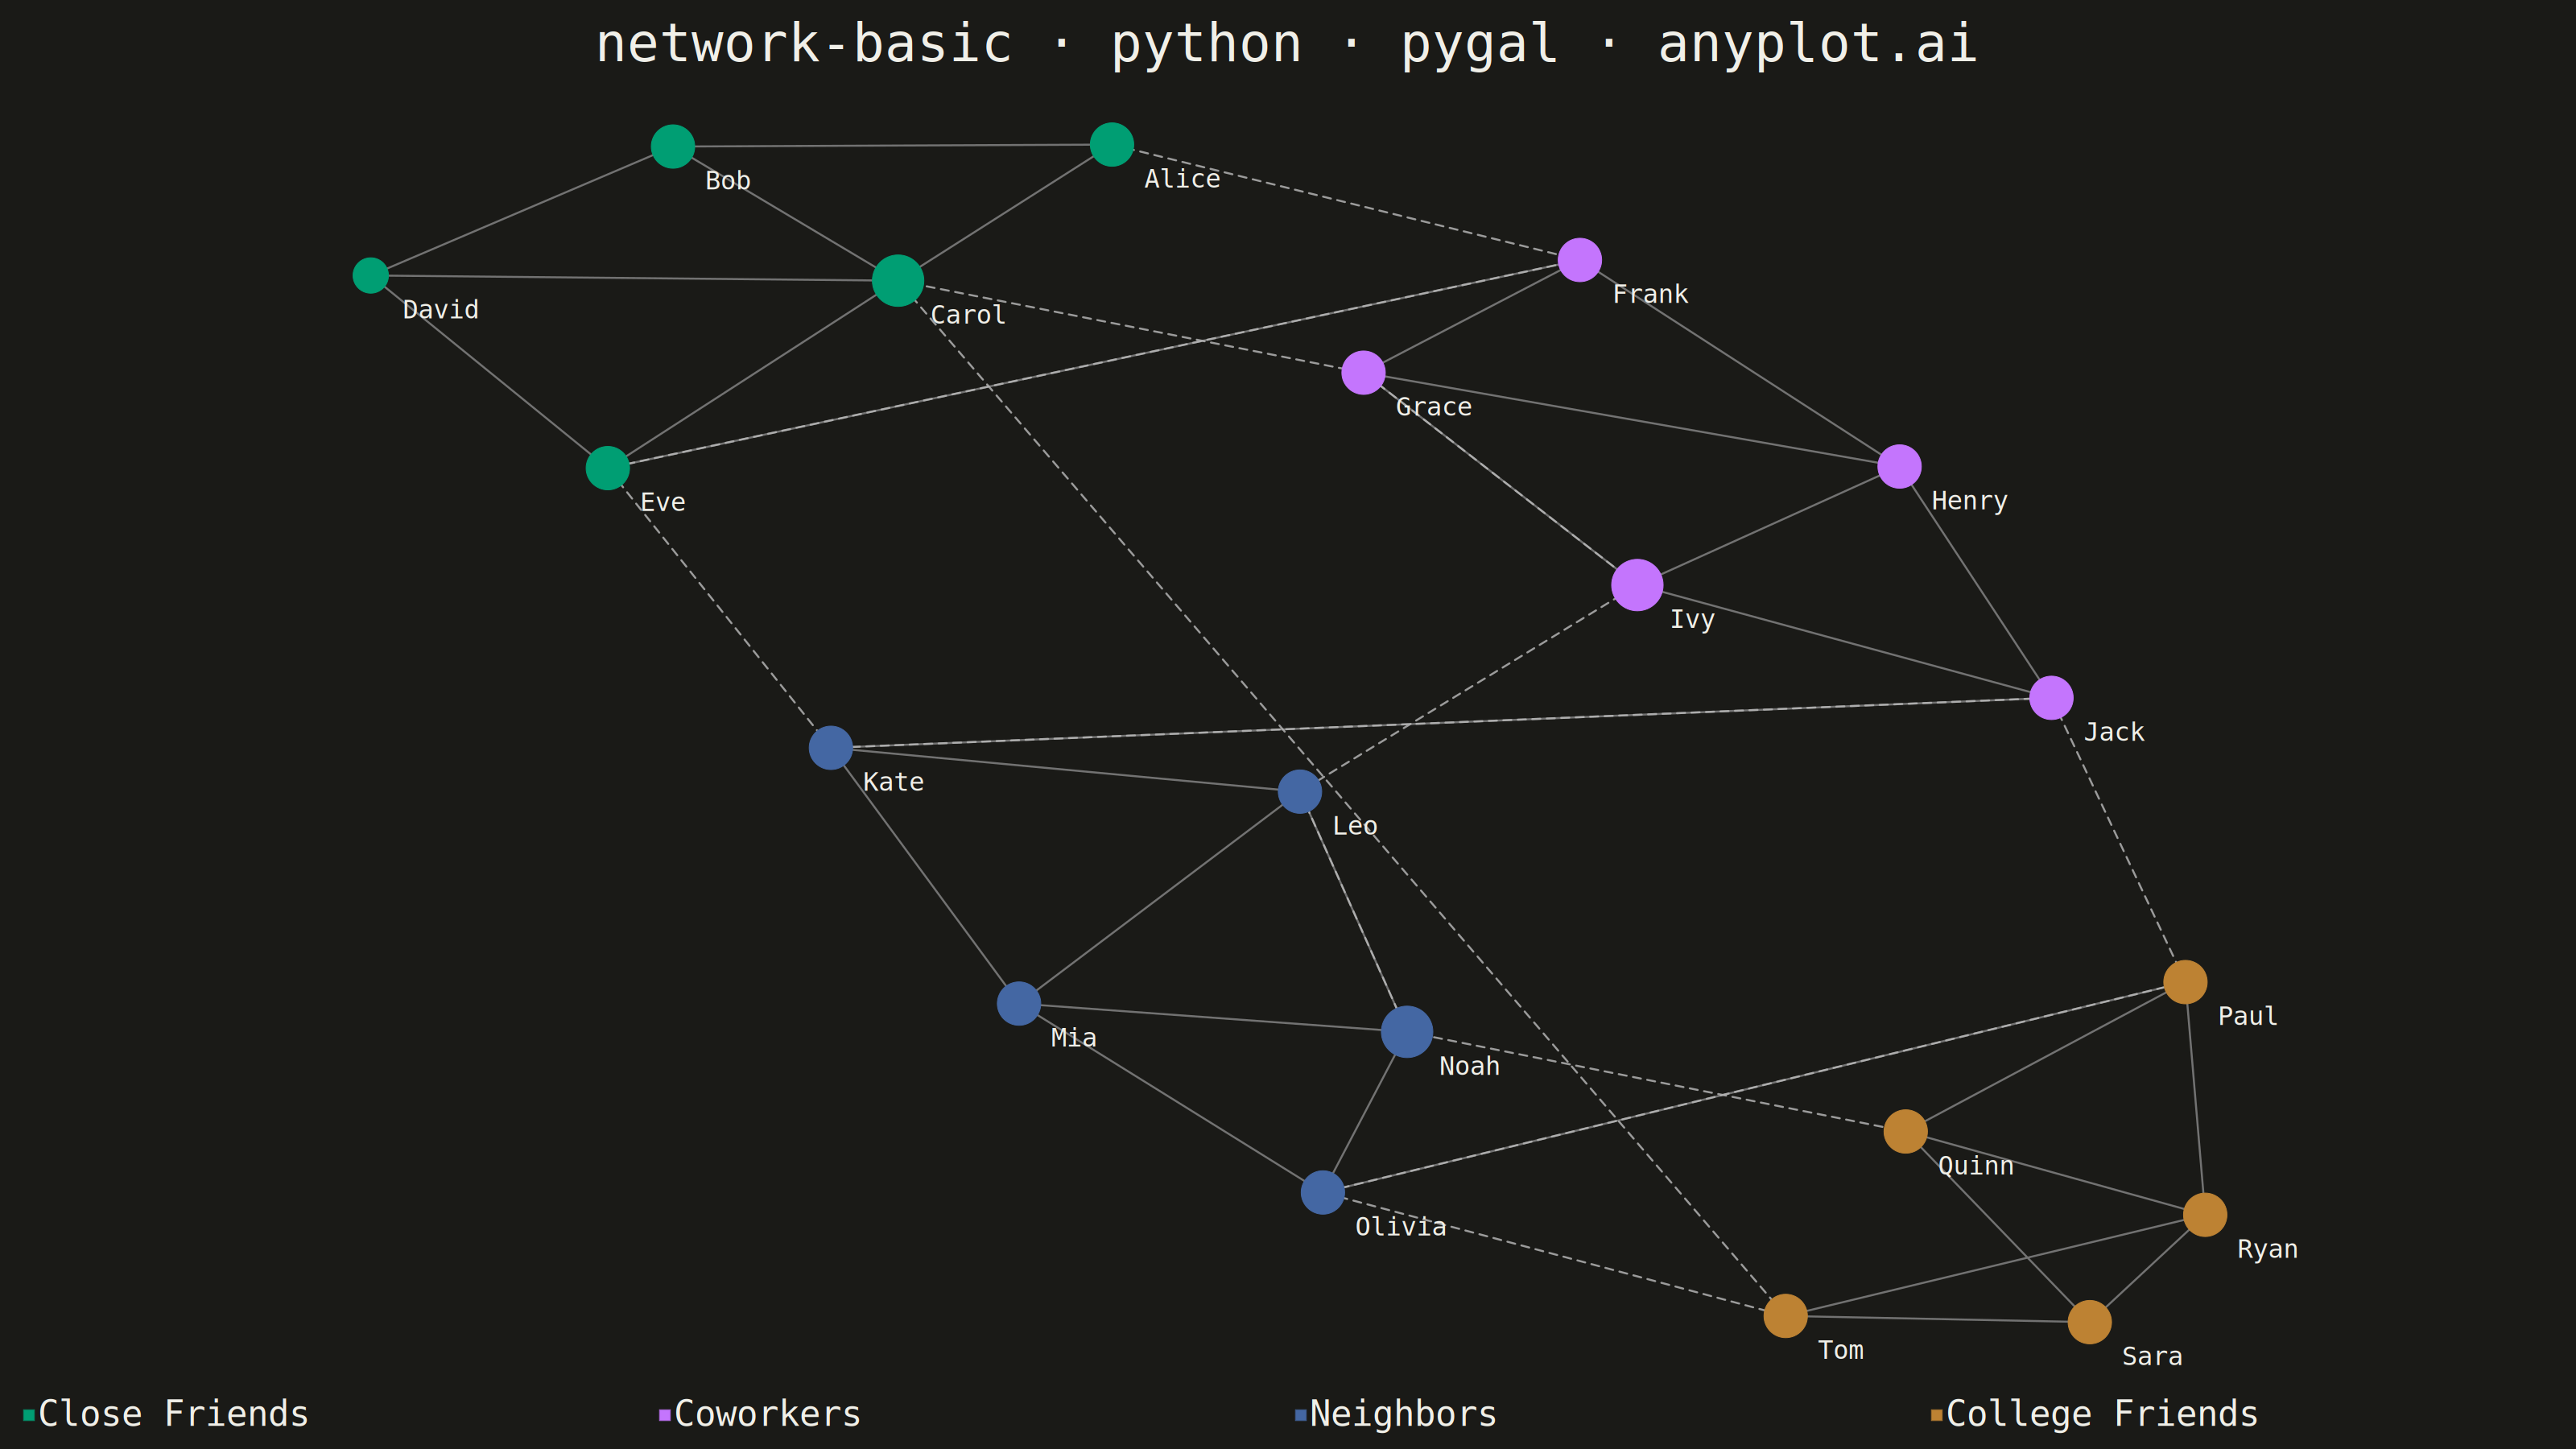
A network graph (node-link diagram) visualizes relationships between entities as nodes connected by edges. It reveals the structure of connections, clusters, and central nodes in relational data. Network graphs are essential for understanding complex systems where relationships matter as much as the entities themselves, making hidden patterns of connectivity visible at a glance.
""" anyplot.ai
network-basic: Basic Network Graph
Library: pygal 3.1.3 | Python 3.13.14
Quality: 94/100 | Updated: 2026-07-24
"""

import os
import sys


# Script filename shadows the installed `pygal` package when run as `python pygal.py`;
# dropping the script directory from sys.path lets the real package resolve.
sys.path.pop(0)

import numpy as np
import pygal
from pygal.style import Style


THEME = os.getenv("ANYPLOT_THEME", "light")
PAGE_BG = "#FAF8F1" if THEME == "light" else "#1A1A17"
INK = "#1A1A17" if THEME == "light" else "#F0EFE8"
INK_MUTED = "#6B6A63" if THEME == "light" else "#A8A79F"

IMPRINT = ("#009E73", "#C475FD", "#4467A3", "#BD8233")

# Set seed for reproducibility
np.random.seed(42)

# Data: A small social network with 20 people in 4 communities
nodes = [
    {"id": 0, "label": "Alice", "group": 0},
    {"id": 1, "label": "Bob", "group": 0},
    {"id": 2, "label": "Carol", "group": 0},
    {"id": 3, "label": "David", "group": 0},
    {"id": 4, "label": "Eve", "group": 0},
    {"id": 5, "label": "Frank", "group": 1},
    {"id": 6, "label": "Grace", "group": 1},
    {"id": 7, "label": "Henry", "group": 1},
    {"id": 8, "label": "Ivy", "group": 1},
    {"id": 9, "label": "Jack", "group": 1},
    {"id": 10, "label": "Kate", "group": 2},
    {"id": 11, "label": "Leo", "group": 2},
    {"id": 12, "label": "Mia", "group": 2},
    {"id": 13, "label": "Noah", "group": 2},
    {"id": 14, "label": "Olivia", "group": 2},
    {"id": 15, "label": "Paul", "group": 3},
    {"id": 16, "label": "Quinn", "group": 3},
    {"id": 17, "label": "Ryan", "group": 3},
    {"id": 18, "label": "Sara", "group": 3},
    {"id": 19, "label": "Tom", "group": 3},
]

# Edges: Friendship connections (within and between groups)
edges = [
    # Group 0 internal connections
    (0, 1),
    (0, 2),
    (1, 2),
    (1, 3),
    (2, 4),
    (3, 4),
    # Group 1 internal connections
    (5, 6),
    (5, 7),
    (6, 8),
    (7, 8),
    (7, 9),
    (8, 9),
    # Group 2 internal connections
    (10, 11),
    (10, 12),
    (11, 13),
    (12, 13),
    (12, 14),
    (13, 14),
    # Group 3 internal connections
    (15, 16),
    (15, 17),
    (16, 18),
    (17, 18),
    (17, 19),
    (18, 19),
    # Cross-group connections (bridges between communities)
    (0, 5),
    (4, 10),
    (9, 15),
    (14, 19),
    (2, 6),
    (8, 11),
    (13, 16),
]

# Calculate spring layout (force-directed algorithm)
n = len(nodes)

# Initialize positions clustered by group for better community structure (centered)
group_centers = {0: (-0.4, 0.4), 1: (0.4, 0.4), 2: (-0.4, -0.4), 3: (0.4, -0.4)}
positions = np.zeros((n, 2))
for i, node in enumerate(nodes):
    cx, cy = group_centers[node["group"]]
    positions[i] = [cx + np.random.rand() * 0.25 - 0.125, cy + np.random.rand() * 0.25 - 0.125]

k = 0.35  # Optimal distance parameter (slightly smaller for tighter clusters)

for iteration in range(200):
    displacement = np.zeros((n, 2))

    # Repulsive forces between all node pairs
    for i in range(n):
        for j in range(i + 1, n):
            diff = positions[i] - positions[j]
            dist = max(np.linalg.norm(diff), 0.01)
            force = (k * k / dist) * (diff / dist)
            displacement[i] += force
            displacement[j] -= force

    # Attractive forces for edges (stronger to keep communities tight)
    for src, tgt in edges:
        diff = positions[src] - positions[tgt]
        dist = max(np.linalg.norm(diff), 0.01)
        force = (dist * dist / k) * (diff / dist) * 1.2
        displacement[src] -= force
        displacement[tgt] += force

    # Apply displacement with cooling
    cooling = 1 - iteration / 200
    for i in range(n):
        disp_norm = np.linalg.norm(displacement[i])
        if disp_norm > 0:
            positions[i] += (displacement[i] / disp_norm) * min(disp_norm, 0.08 * cooling)

# Normalize positions to [0, 1], then stretch anisotropically to fill the
# 16:9 landscape canvas (equal x/y ranges left the left/right thirds empty)
pos_min = positions.min(axis=0)
pos_max = positions.max(axis=0)
positions = (positions - pos_min) / (pos_max - pos_min + 1e-6)
positions[:, 0] = positions[:, 0] * 12 + 2  # X: [2, 14] of a (0, 16) xrange
positions[:, 1] = positions[:, 1] * 8.4 + 0.3  # Y: [0.3, 8.7] of a (0, 9) range
pos = {node["id"]: positions[i] for i, node in enumerate(nodes)}

# Calculate node degrees to encode connection count as dot radius
degrees = {node["id"]: 0 for node in nodes}
for src, tgt in edges:
    degrees[src] += 1
    degrees[tgt] += 1
NODE_BASE_R = 12
NODE_R_PER_DEGREE = 5

# Custom style: theme-adaptive chrome, Imprint data colors
# Edge series come first (intra-community, then cross-community bridges) so
# their colors land in the neutral gray slots ahead of the 4 community colors
custom_style = Style(
    background=PAGE_BG,
    plot_background=PAGE_BG,
    foreground=INK,
    foreground_strong=INK,
    foreground_subtle=INK_MUTED,
    colors=("#888888", "#BBBBBB") + IMPRINT,
    # pygal auto-picks black/white per-series for value/label text based on
    # series color brightness, which puts near-black text on the near-black
    # dark background. Force it to the theme-adaptive ink color instead.
    value_colors=(INK,) * 6,
    title_font_size=66,
    label_font_size=56,
    major_label_font_size=44,
    legend_font_size=44,
    # Also sets the label's pixel offset from its node (see label placement
    # below) - kept large enough to clear the biggest (degree-scaled) nodes.
    value_font_size=40,
    value_label_font_size=32,
    stroke_width=2.5,
    opacity=1,
    opacity_hover=1,
)

# Create XY chart with centered layout
chart = pygal.XY(
    width=3200,
    height=1800,
    style=custom_style,
    title="network-basic · python · pygal · anyplot.ai",
    show_legend=True,
    x_title="",
    y_title="",
    show_x_guides=False,
    show_y_guides=False,
    show_x_labels=False,
    show_y_labels=False,
    stroke=True,
    dots_size=NODE_BASE_R,
    stroke_style={"width": 2, "linecap": "butt"},
    legend_at_bottom=True,
    legend_at_bottom_columns=4,
    range=(0, 9),
    xrange=(0, 16),
    print_labels=True,
    print_values=False,
)

# Split edges into intra-community links and cross-community "bridges", and
# render each as its own series (solid vs. dashed/thinner) so the bridging
# structure reads visually instead of as a uniform mesh of gray lines.
# Each edge is represented as two points connected, with None to break between edges
intra_edges = [(s, t) for s, t in edges if nodes[s]["group"] == nodes[t]["group"]]
bridge_edges = [(s, t) for s, t in edges if nodes[s]["group"] != nodes[t]["group"]]

intra_points = []
for src, tgt in intra_edges:
    intra_points.append(tuple(pos[src]))
    intra_points.append(tuple(pos[tgt]))
    intra_points.append(None)  # Break the line for next edge

bridge_points = []
for src, tgt in bridge_edges:
    bridge_points.append(tuple(pos[src]))
    bridge_points.append(tuple(pos[tgt]))
    bridge_points.append(None)  # Break the line for next edge

# Add edges (using None title to exclude from legend)
chart.add(None, intra_points, stroke=True, show_dots=False, fill=False, stroke_style={"width": 2.5, "linecap": "round"})
chart.add(
    None,
    bridge_points,
    stroke=True,
    show_dots=False,
    fill=False,
    stroke_style={"width": 1.6, "linecap": "round", "dasharray": "10, 8"},
)

# Group nodes by community; dot radius scales with degree (connection count)
group_names = ["Close Friends", "Coworkers", "Neighbors", "College Friends"]
for group_idx in range(4):
    group_nodes = [node for node in nodes if node["group"] == group_idx]
    node_points = []
    for node in group_nodes:
        x, y = pos[node["id"]]
        degree = degrees[node["id"]]
        radius = NODE_BASE_R + degree * NODE_R_PER_DEGREE
        node_points.append({"value": (x, y), "label": node["label"], "node": {"r": radius}})
    chart.add(group_names[group_idx], node_points, stroke=False)

# Save themed outputs
chart.render_to_file(f"plot-{THEME}.svg")
chart.render_to_png(f"plot-{THEME}.png")

with open(f"plot-{THEME}.html", "wb") as f:
    f.write(chart.render())
Runnable source as JSON, for any HTTP client: https://api.anyplot.ai/specs/network-basic/pygal/code. Any spec id and library id listed in llms-full.txt fit the same URL shape; every URL below is complete and callable.
{
  "spec_id": "network-basic",
  "language": "python",
  "library": "pygal",
  "page": "https://anyplot.ai/network-basic/python/pygal",
  "hub": "https://anyplot.ai/network-basic",
  "code_json": "https://api.anyplot.ai/specs/network-basic/pygal/code",
  "spec_json": "https://api.anyplot.ai/specs/network-basic",
  "render_light_png": "https://storage.googleapis.com/anyplot-images/plots/network-basic/python/pygal/plot-light.png",
  "render_dark_png": "https://storage.googleapis.com/anyplot-images/plots/network-basic/python/pygal/plot-dark.png",
  "interactive_light_html": "https://storage.googleapis.com/anyplot-images/plots/network-basic/python/pygal/plot-light.html",
  "interactive_dark_html": "https://storage.googleapis.com/anyplot-images/plots/network-basic/python/pygal/plot-dark.html",
  "quality_score": 94.0,
  "license": "MIT",
  "guide": "https://anyplot.ai/llms.txt"
}
Part of Basic Network Graph on anyplot.ai.