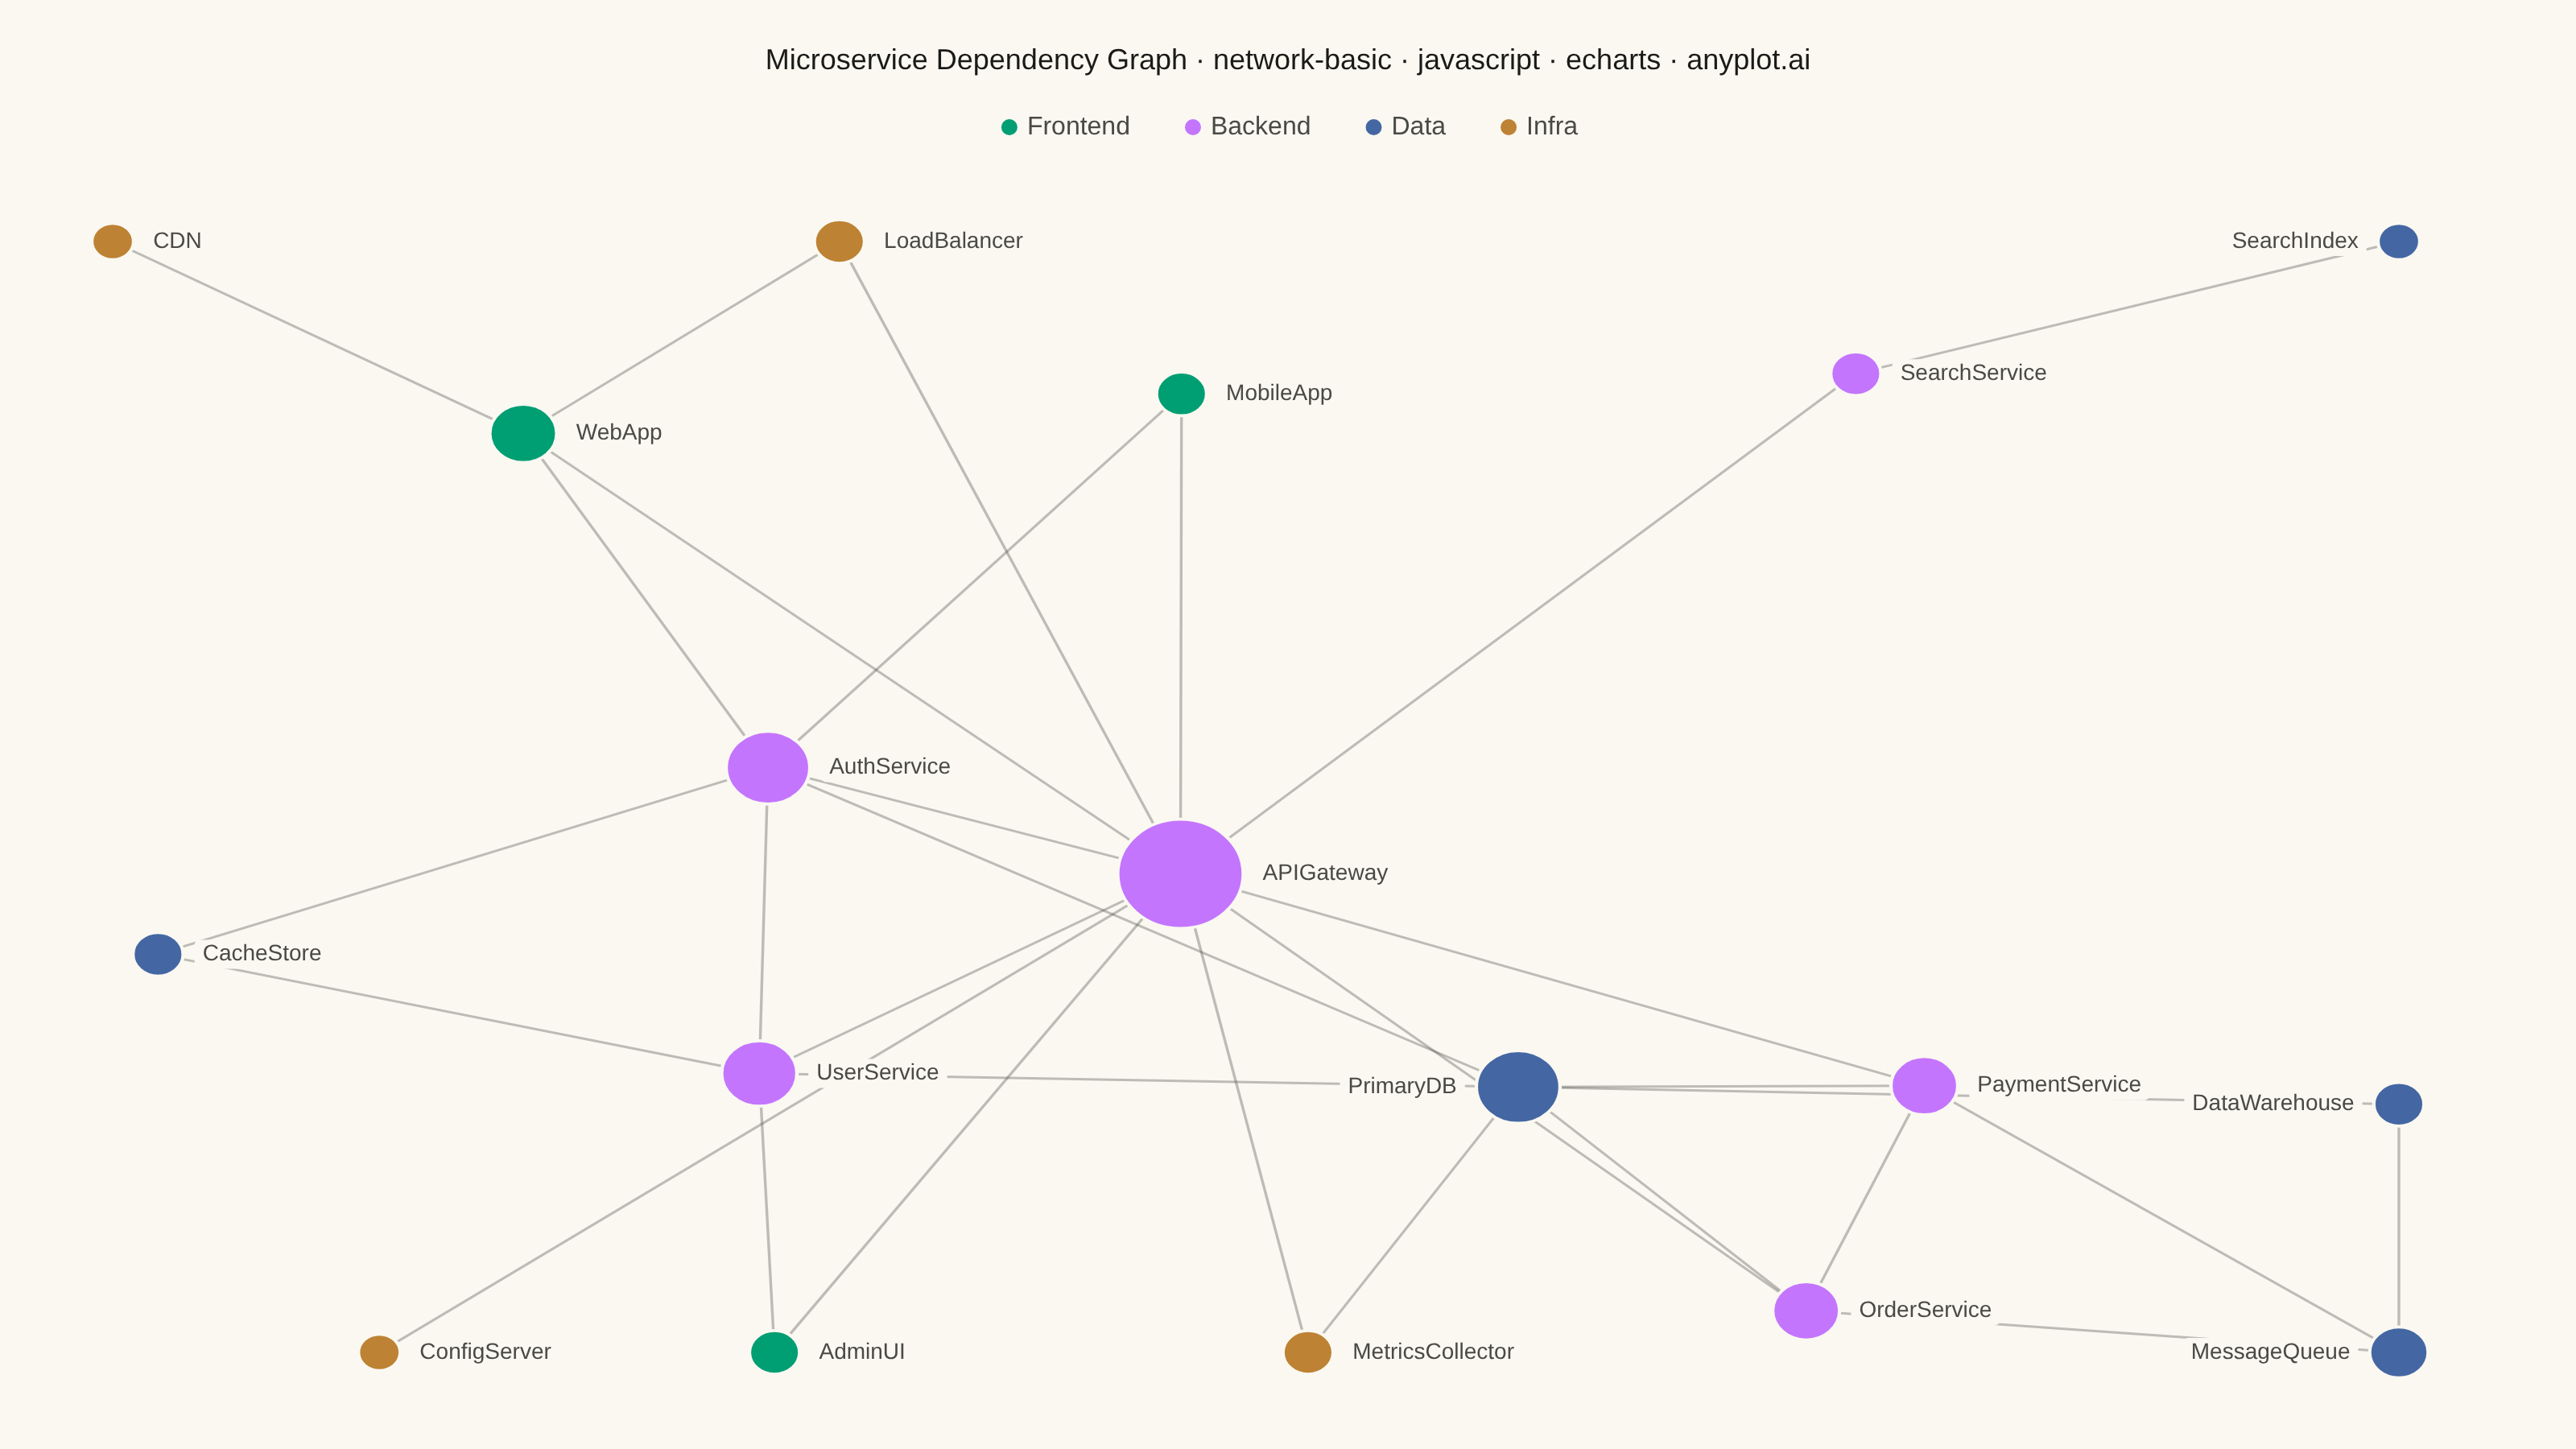
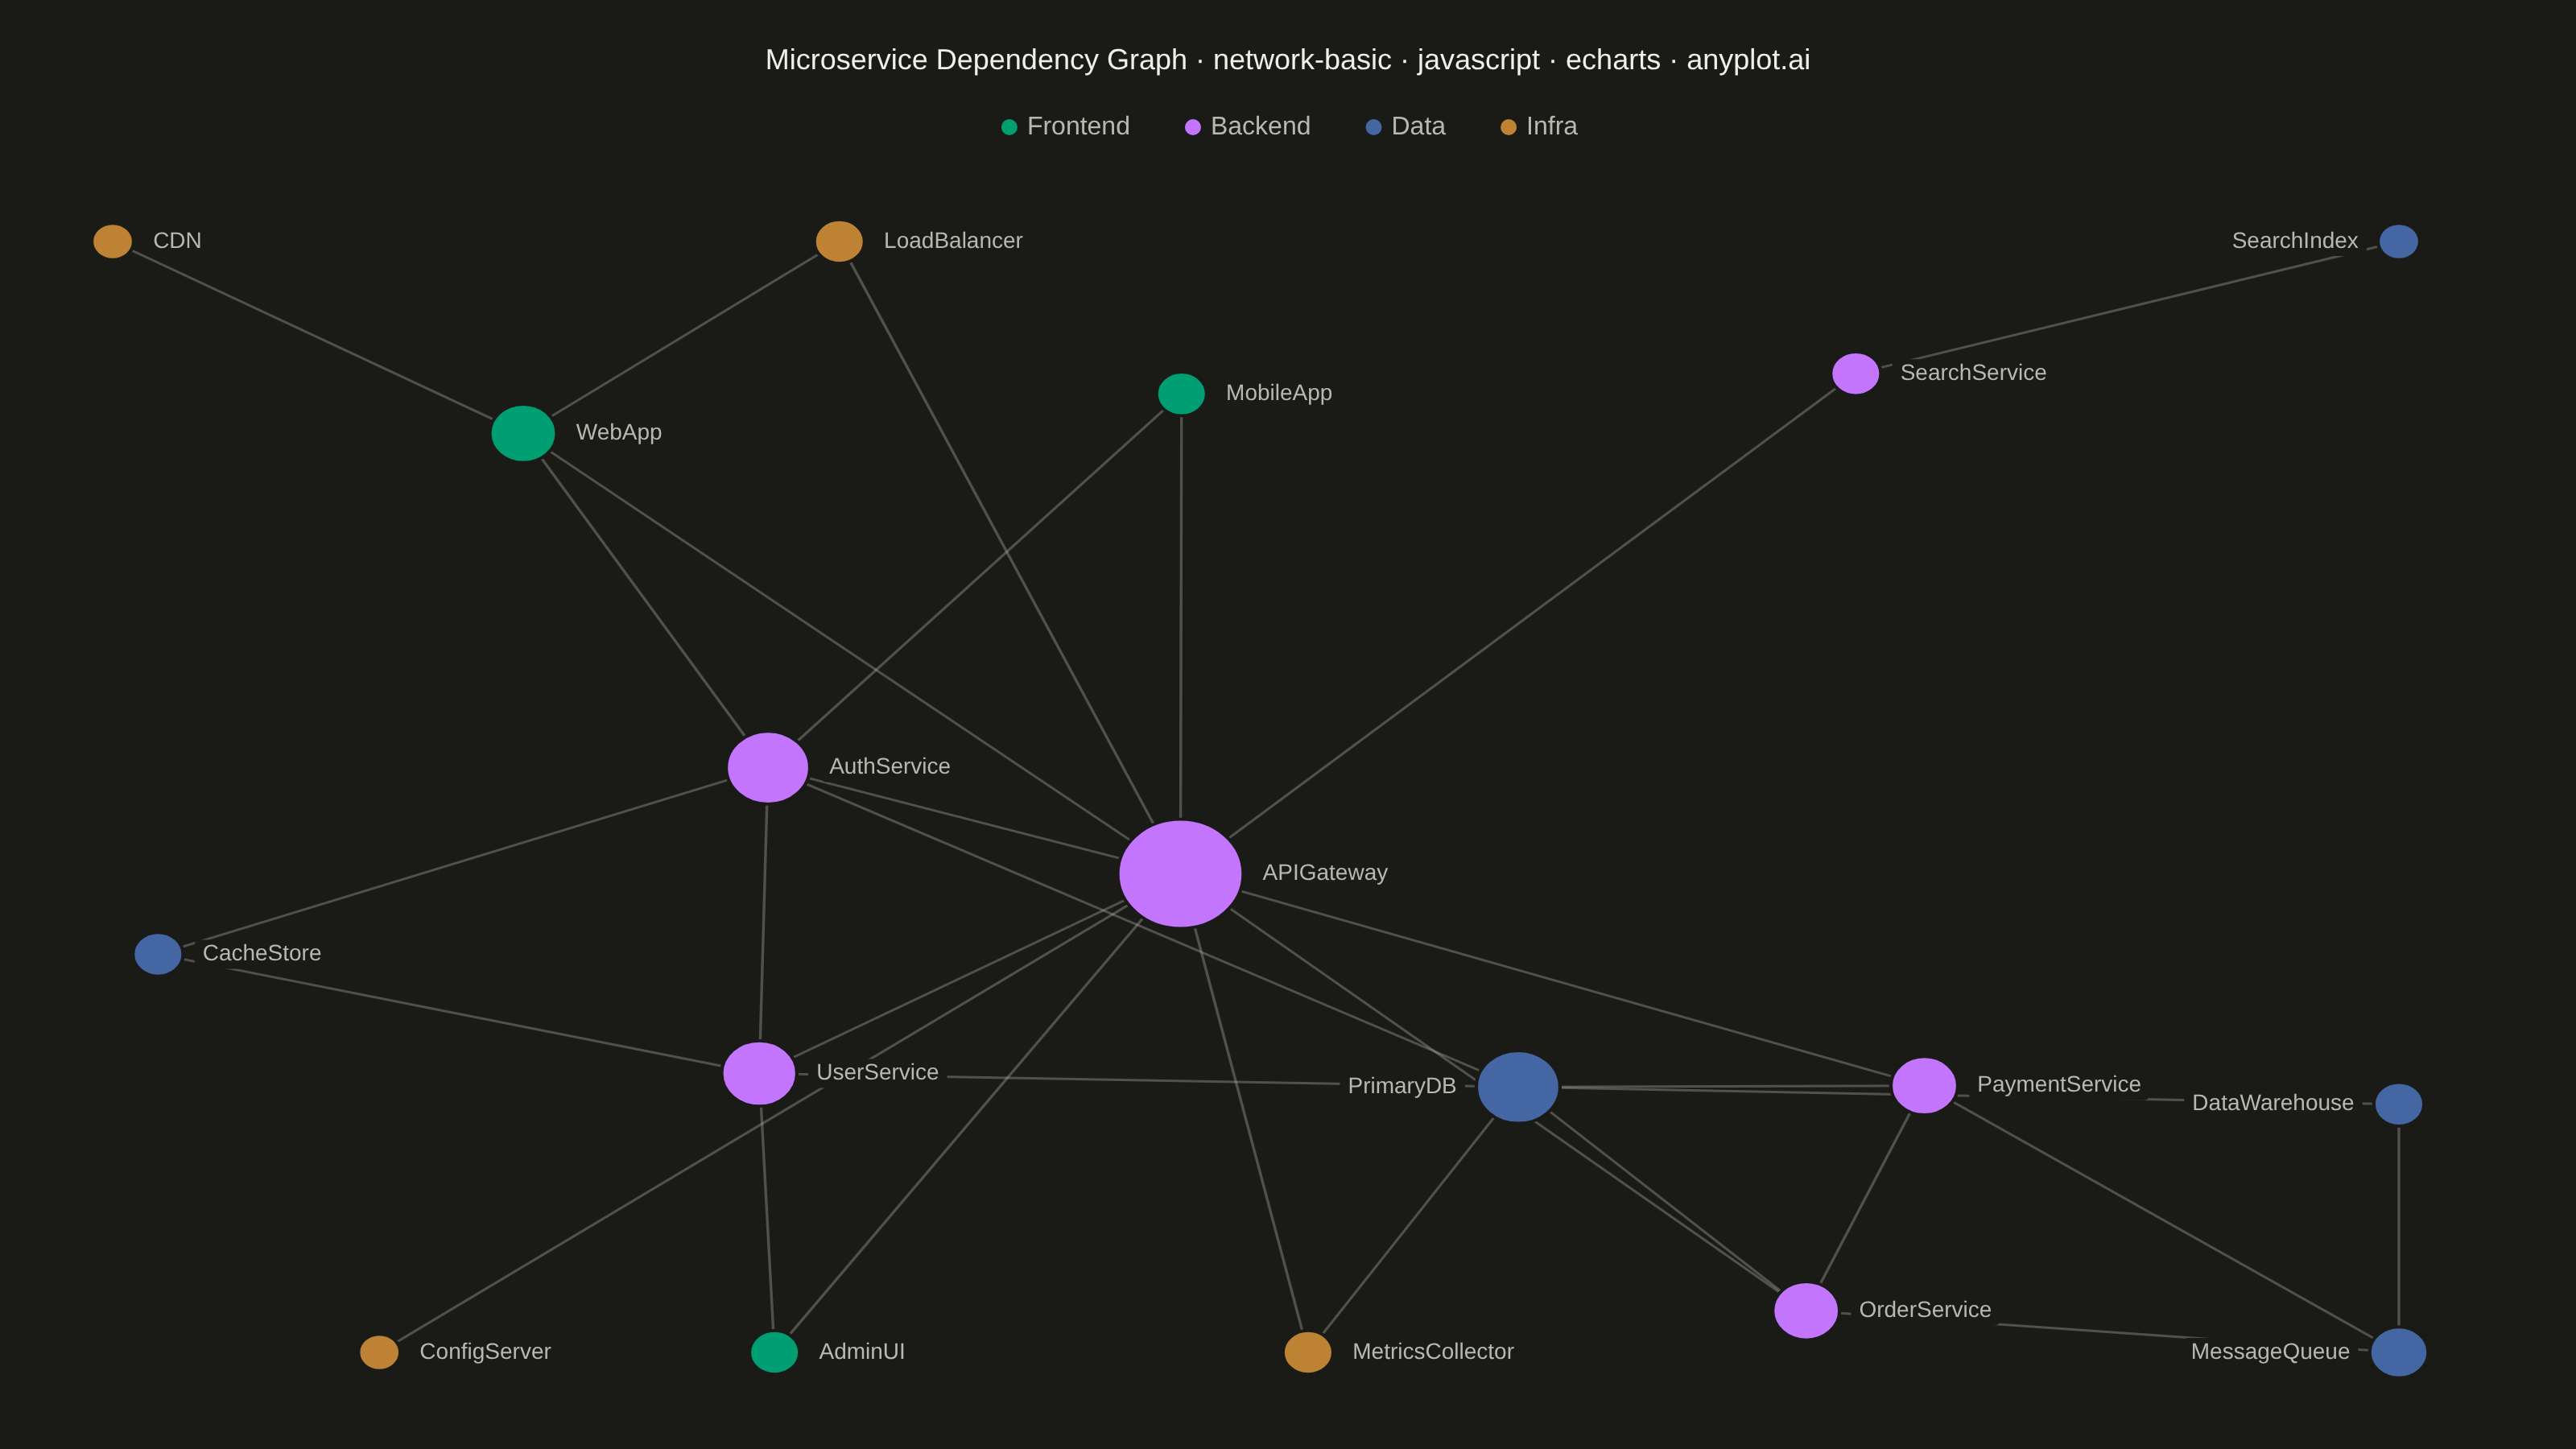
The same plot in 14 other libraries — JavaScript: Chart.js, D3.js, Highcharts, MUI X Charts; Python: Altair, Bokeh, lets-plot, Matplotlib, Plotly, plotnine, Pygal, Seaborn; R: ggplot2; Julia: Makie.jl. Compare all 15 side by side: Basic Network Graph in Python, R, Julia and JavaScript.
A network graph (node-link diagram) visualizes relationships between entities as nodes connected by edges. It reveals the structure of connections, clusters, and central nodes in relational data. Network graphs are essential for understanding complex systems where relationships matter as much as the entities themselves, making hidden patterns of connectivity visible at a glance.
// anyplot.ai
// network-basic: Basic Network Graph
// Library: echarts 6.1.0 | JavaScript 22.23.1
// Quality: 91/100 | Created: 2026-07-24

//# anyplot-orientation: landscape
const t = window.ANYPLOT_TOKENS;

// --- Data: microservice dependency graph (in-memory, deterministic) --------
const GROUP_NAMES = ["Frontend", "Backend", "Data", "Infra"];

const NODES = [
  { name: "WebApp", group: 0 },
  { name: "MobileApp", group: 0 },
  { name: "AdminUI", group: 0 },
  { name: "APIGateway", group: 1 },
  { name: "AuthService", group: 1 },
  { name: "OrderService", group: 1 },
  { name: "PaymentService", group: 1 },
  { name: "SearchService", group: 1 },
  { name: "UserService", group: 1 },
  { name: "PrimaryDB", group: 2 },
  { name: "CacheStore", group: 2 },
  { name: "SearchIndex", group: 2 },
  { name: "MessageQueue", group: 2 },
  { name: "DataWarehouse", group: 2 },
  { name: "LoadBalancer", group: 3 },
  { name: "CDN", group: 3 },
  { name: "ConfigServer", group: 3 },
  { name: "MetricsCollector", group: 3 },
];

const EDGES = [
  ["WebApp", "APIGateway"],
  ["WebApp", "AuthService"],
  ["MobileApp", "APIGateway"],
  ["MobileApp", "AuthService"],
  ["AdminUI", "APIGateway"],
  ["AdminUI", "UserService"],
  ["APIGateway", "AuthService"],
  ["APIGateway", "OrderService"],
  ["APIGateway", "PaymentService"],
  ["APIGateway", "SearchService"],
  ["APIGateway", "UserService"],
  ["OrderService", "PaymentService"],
  ["UserService", "AuthService"],
  ["AuthService", "PrimaryDB"],
  ["AuthService", "CacheStore"],
  ["OrderService", "PrimaryDB"],
  ["OrderService", "MessageQueue"],
  ["PaymentService", "PrimaryDB"],
  ["PaymentService", "MessageQueue"],
  ["SearchService", "SearchIndex"],
  ["UserService", "PrimaryDB"],
  ["UserService", "CacheStore"],
  ["MessageQueue", "DataWarehouse"],
  ["PrimaryDB", "DataWarehouse"],
  ["LoadBalancer", "APIGateway"],
  ["LoadBalancer", "WebApp"],
  ["CDN", "WebApp"],
  ["ConfigServer", "APIGateway"],
  ["MetricsCollector", "APIGateway"],
  ["MetricsCollector", "PrimaryDB"],
];

// Degree = number of connections per node (drives node size below).
const degree = Object.fromEntries(NODES.map((n) => [n.name, 0]));
EDGES.forEach(([a, b]) => {
  degree[a] += 1;
  degree[b] += 1;
});

// --- Deterministic force-directed layout (Fruchterman-Reingold, fixed-seed) -
// echarts' own layout:'force' runs a live physics simulation that keeps
// nudging positions frame to frame — not reproducible and not guaranteed to
// have settled by screenshot time. Precomputing a fixed-seed layout here
// keeps both themes pixel-identical and renders instantly.
function lcg(seed) {
  let state = seed;
  return () => {
    state = (state * 1103515245 + 12345) % 2147483648;
    return state / 2147483648;
  };
}
const rand = lcg(42);

const LAYOUT_W = 1200;
const LAYOUT_H = 750;
const positions = {};
NODES.forEach((n) => {
  positions[n.name] = { x: rand() * LAYOUT_W, y: rand() * LAYOUT_H };
});

const k = Math.sqrt((LAYOUT_W * LAYOUT_H) / NODES.length);
let temperature = LAYOUT_W / 10;

for (let iter = 0; iter < 400; iter++) {
  const disp = Object.fromEntries(NODES.map((n) => [n.name, { x: 0, y: 0 }]));

  for (let i = 0; i < NODES.length; i++) {
    for (let j = i + 1; j < NODES.length; j++) {
      const a = NODES[i].name;
      const b = NODES[j].name;
      let dx = positions[a].x - positions[b].x;
      let dy = positions[a].y - positions[b].y;
      const dist = Math.sqrt(dx * dx + dy * dy) || 0.01;
      const repulsion = (k * k) / dist;
      dx = (dx / dist) * repulsion;
      dy = (dy / dist) * repulsion;
      disp[a].x += dx;
      disp[a].y += dy;
      disp[b].x -= dx;
      disp[b].y -= dy;
    }
  }

  EDGES.forEach(([a, b]) => {
    let dx = positions[a].x - positions[b].x;
    let dy = positions[a].y - positions[b].y;
    const dist = Math.sqrt(dx * dx + dy * dy) || 0.01;
    const attraction = (dist * dist) / k;
    dx = (dx / dist) * attraction;
    dy = (dy / dist) * attraction;
    disp[a].x -= dx;
    disp[a].y -= dy;
    disp[b].x += dx;
    disp[b].y += dy;
  });

  NODES.forEach((n) => {
    const d = disp[n.name];
    const len = Math.sqrt(d.x * d.x + d.y * d.y) || 0.01;
    const capped = Math.min(len, temperature);
    const p = positions[n.name];
    p.x = Math.min(LAYOUT_W, Math.max(0, p.x + (d.x / len) * capped));
    p.y = Math.min(LAYOUT_H, Math.max(0, p.y + (d.y / len) * capped));
  });

  temperature *= 0.995;
}

// Rescale the settled layout inward so the outermost nodes never sit flush
// against the drawable-area edge — leaves room for their node radius and
// (for the rightmost nodes) their label text.
const EDGE_PAD = 90;
let minX = Infinity;
let maxX = -Infinity;
let minY = Infinity;
let maxY = -Infinity;
NODES.forEach((n) => {
  const p = positions[n.name];
  minX = Math.min(minX, p.x);
  maxX = Math.max(maxX, p.x);
  minY = Math.min(minY, p.y);
  maxY = Math.max(maxY, p.y);
});
NODES.forEach((n) => {
  const p = positions[n.name];
  p.x = EDGE_PAD + ((p.x - minX) / (maxX - minX)) * (LAYOUT_W - 2 * EDGE_PAD);
  p.y = EDGE_PAD + ((p.y - minY) / (maxY - minY)) * (LAYOUT_H - 2 * EDGE_PAD);
});

// Node size encodes degree (number of connections).
const degrees = Object.values(degree);
const minDeg = Math.min(...degrees);
const maxDeg = Math.max(...degrees);
const MIN_SIZE = 26;
const MAX_SIZE = 78;
function sizeForDegree(d) {
  if (maxDeg === minDeg) return (MIN_SIZE + MAX_SIZE) / 2;
  return MIN_SIZE + ((d - minDeg) / (maxDeg - minDeg)) * (MAX_SIZE - MIN_SIZE);
}

// Labels default to the node's right side; the rightmost nodes flip their
// label to the left so the text stays inside the canvas instead of running
// off the right edge.
const LABEL_FLIP_X = LAYOUT_W * 0.74;
const labelSide = {};
NODES.forEach((n) => {
  labelSide[n.name] = positions[n.name].x > LABEL_FLIP_X ? "left" : "right";
});

// Second pass: two same-side labels on vertically close nodes can land close
// enough horizontally that their background chips touch with no gap (reads
// as one run-on phrase). echarts' graph "view" coordinate system stretches
// our layout-space x/y independently (non-uniform, no aspect preservation)
// to fill the series' left/right/top/bottom box, so the collision check
// below re-derives real screen-pixel positions the same way before
// estimating label chip spans — checking in raw layout units would miss
// collisions the horizontal stretch factor closes up.
const GRID_LEFT = 70;
const GRID_RIGHT = 110;
const GRID_TOP = 150;
const GRID_BOTTOM = 60;
const DATA_W = LAYOUT_W - 2 * EDGE_PAD;
const DATA_H = LAYOUT_H - 2 * EDGE_PAD;
const drawW = window.ANYPLOT_SIZE.width - GRID_LEFT - GRID_RIGHT;
const drawH = window.ANYPLOT_SIZE.height - GRID_TOP - GRID_BOTTOM;
const SCALE_X = drawW / DATA_W;
const SCALE_Y = drawH / DATA_H;
function screenX(x) {
  return GRID_LEFT + (x - EDGE_PAD) * SCALE_X;
}
function screenY(y) {
  return GRID_TOP + (y - EDGE_PAD) * SCALE_Y;
}

const LABEL_DISTANCE = 6;
const LABEL_CHAR_W = 7.2;
const LABEL_PAD_X = 10;
const LABEL_ROW_GAP = 18;
// Require a real visible gap between two chips, not just non-overlap — a
// few px of clearance still reads as "touching" once anti-aliasing and the
// chip's rounded corners are rendered.
const LABEL_MIN_GAP = 18;
function labelSpan(n, side) {
  const sx = screenX(positions[n.name].x);
  const half = sizeForDegree(degree[n.name]) / 2;
  const width = n.name.length * LABEL_CHAR_W + LABEL_PAD_X;
  if (side === "right") {
    const start = sx + half + LABEL_DISTANCE;
    return { start, end: start + width };
  }
  const end = sx - half - LABEL_DISTANCE;
  return { start: end - width, end };
}
for (let i = 0; i < NODES.length; i++) {
  for (let j = i + 1; j < NODES.length; j++) {
    const a = NODES[i];
    const b = NODES[j];
    if (
      Math.abs(screenY(positions[a.name].y) - screenY(positions[b.name].y)) >
      LABEL_ROW_GAP
    )
      continue;
    const spanA = labelSpan(a, labelSide[a.name]);
    const spanB = labelSpan(b, labelSide[b.name]);
    if (
      spanA.start >= spanB.end + LABEL_MIN_GAP ||
      spanB.start >= spanA.end + LABEL_MIN_GAP
    )
      continue;
    // A collision here is most often two nearby nodes whose labels point
    // *toward* each other into the same gap (e.g. the left node flipped
    // "right" by the canvas-edge rule while the right node is naturally
    // "left"). Point both labels away from each other instead — the
    // leftward node's label goes left, the rightward node's label goes
    // right — which is also the direction that opens the most free space.
    const [leftNode, rightNode] =
      positions[a.name].x <= positions[b.name].x ? [a, b] : [b, a];
    labelSide[leftNode.name] = "left";
    labelSide[rightNode.name] = "right";
  }
}

const graphNodes = NODES.map((n) => ({
  name: n.name,
  category: n.group,
  x: positions[n.name].x,
  y: positions[n.name].y,
  symbolSize: sizeForDegree(degree[n.name]),
  value: degree[n.name],
  label: {
    position: labelSide[n.name],
  },
}));

const graphEdges = EDGES.map(([source, target]) => ({ source, target }));
const categories = GROUP_NAMES.map((name) => ({ name }));

// --- Init --------------------------------------------------------------------
const chart = echarts.init(document.getElementById("container"));
chart.on("finished", () => {
  window.__anyplotReady = true;
});

// --- Option --------------------------------------------------------------------
const title =
  "Microservice Dependency Graph · network-basic · javascript · echarts · anyplot.ai";
const titleFontSize =
  title.length > 67 ? Math.round(22 * (67 / title.length)) : 22;

chart.setOption({
  animation: false,
  color: t.palette,
  backgroundColor: "transparent",
  title: {
    text: title,
    left: "center",
    top: 24,
    textStyle: { color: t.ink, fontSize: titleFontSize, fontWeight: 500 },
  },
  legend: {
    data: GROUP_NAMES,
    orient: "horizontal",
    left: "center",
    top: 66,
    icon: "circle",
    itemWidth: 12,
    itemHeight: 12,
    itemGap: 32,
    textStyle: { color: t.inkSoft, fontSize: 16 },
  },
  tooltip: {
    formatter: (params) =>
      params.dataType === "edge"
        ? `${params.data.source} → ${params.data.target}`
        : `${params.data.name}<br/>connections: ${params.data.value}`,
  },
  series: [
    {
      type: "graph",
      layout: "none",
      left: GRID_LEFT,
      right: GRID_RIGHT,
      top: GRID_TOP,
      bottom: GRID_BOTTOM,
      roam: false,
      draggable: false,
      symbol: "circle",
      categories,
      label: {
        show: true,
        distance: LABEL_DISTANCE,
        color: t.inkSoft,
        fontSize: 14,
        // Solid page-bg chip keeps labels legible where an edge crosses
        // directly behind the text (e.g. two adjacent connected nodes).
        backgroundColor: t.pageBg,
        padding: [2, 5],
        borderRadius: 3,
      },
      edgeSymbol: ["none", "none"],
      lineStyle: {
        color: t.inkSoft,
        opacity: 0.35,
        width: 1.6,
        curveness: 0,
      },
      itemStyle: {
        borderColor: t.pageBg,
        borderWidth: 2,
      },
      emphasis: { disabled: true },
      data: graphNodes,
      links: graphEdges,
    },
  ],
});
Runnable source as JSON, for any HTTP client: https://api.anyplot.ai/specs/network-basic/echarts/code. Any spec id and library id listed in llms-full.txt fit the same URL shape; every URL below is complete and callable.
{
  "spec_id": "network-basic",
  "language": "javascript",
  "library": "echarts",
  "page": "https://anyplot.ai/network-basic/javascript/echarts",
  "hub": "https://anyplot.ai/network-basic",
  "code_json": "https://api.anyplot.ai/specs/network-basic/echarts/code",
  "spec_json": "https://api.anyplot.ai/specs/network-basic",
  "render_light_png": "https://storage.googleapis.com/anyplot-images/plots/network-basic/javascript/echarts/plot-light.png",
  "render_dark_png": "https://storage.googleapis.com/anyplot-images/plots/network-basic/javascript/echarts/plot-dark.png",
  "interactive_light_html": "https://storage.googleapis.com/anyplot-images/plots/network-basic/javascript/echarts/plot-light.html",
  "interactive_dark_html": "https://storage.googleapis.com/anyplot-images/plots/network-basic/javascript/echarts/plot-dark.html",
  "quality_score": 91.0,
  "license": "MIT",
  "guide": "https://anyplot.ai/llms.txt"
}
Part of Basic Network Graph on anyplot.ai.