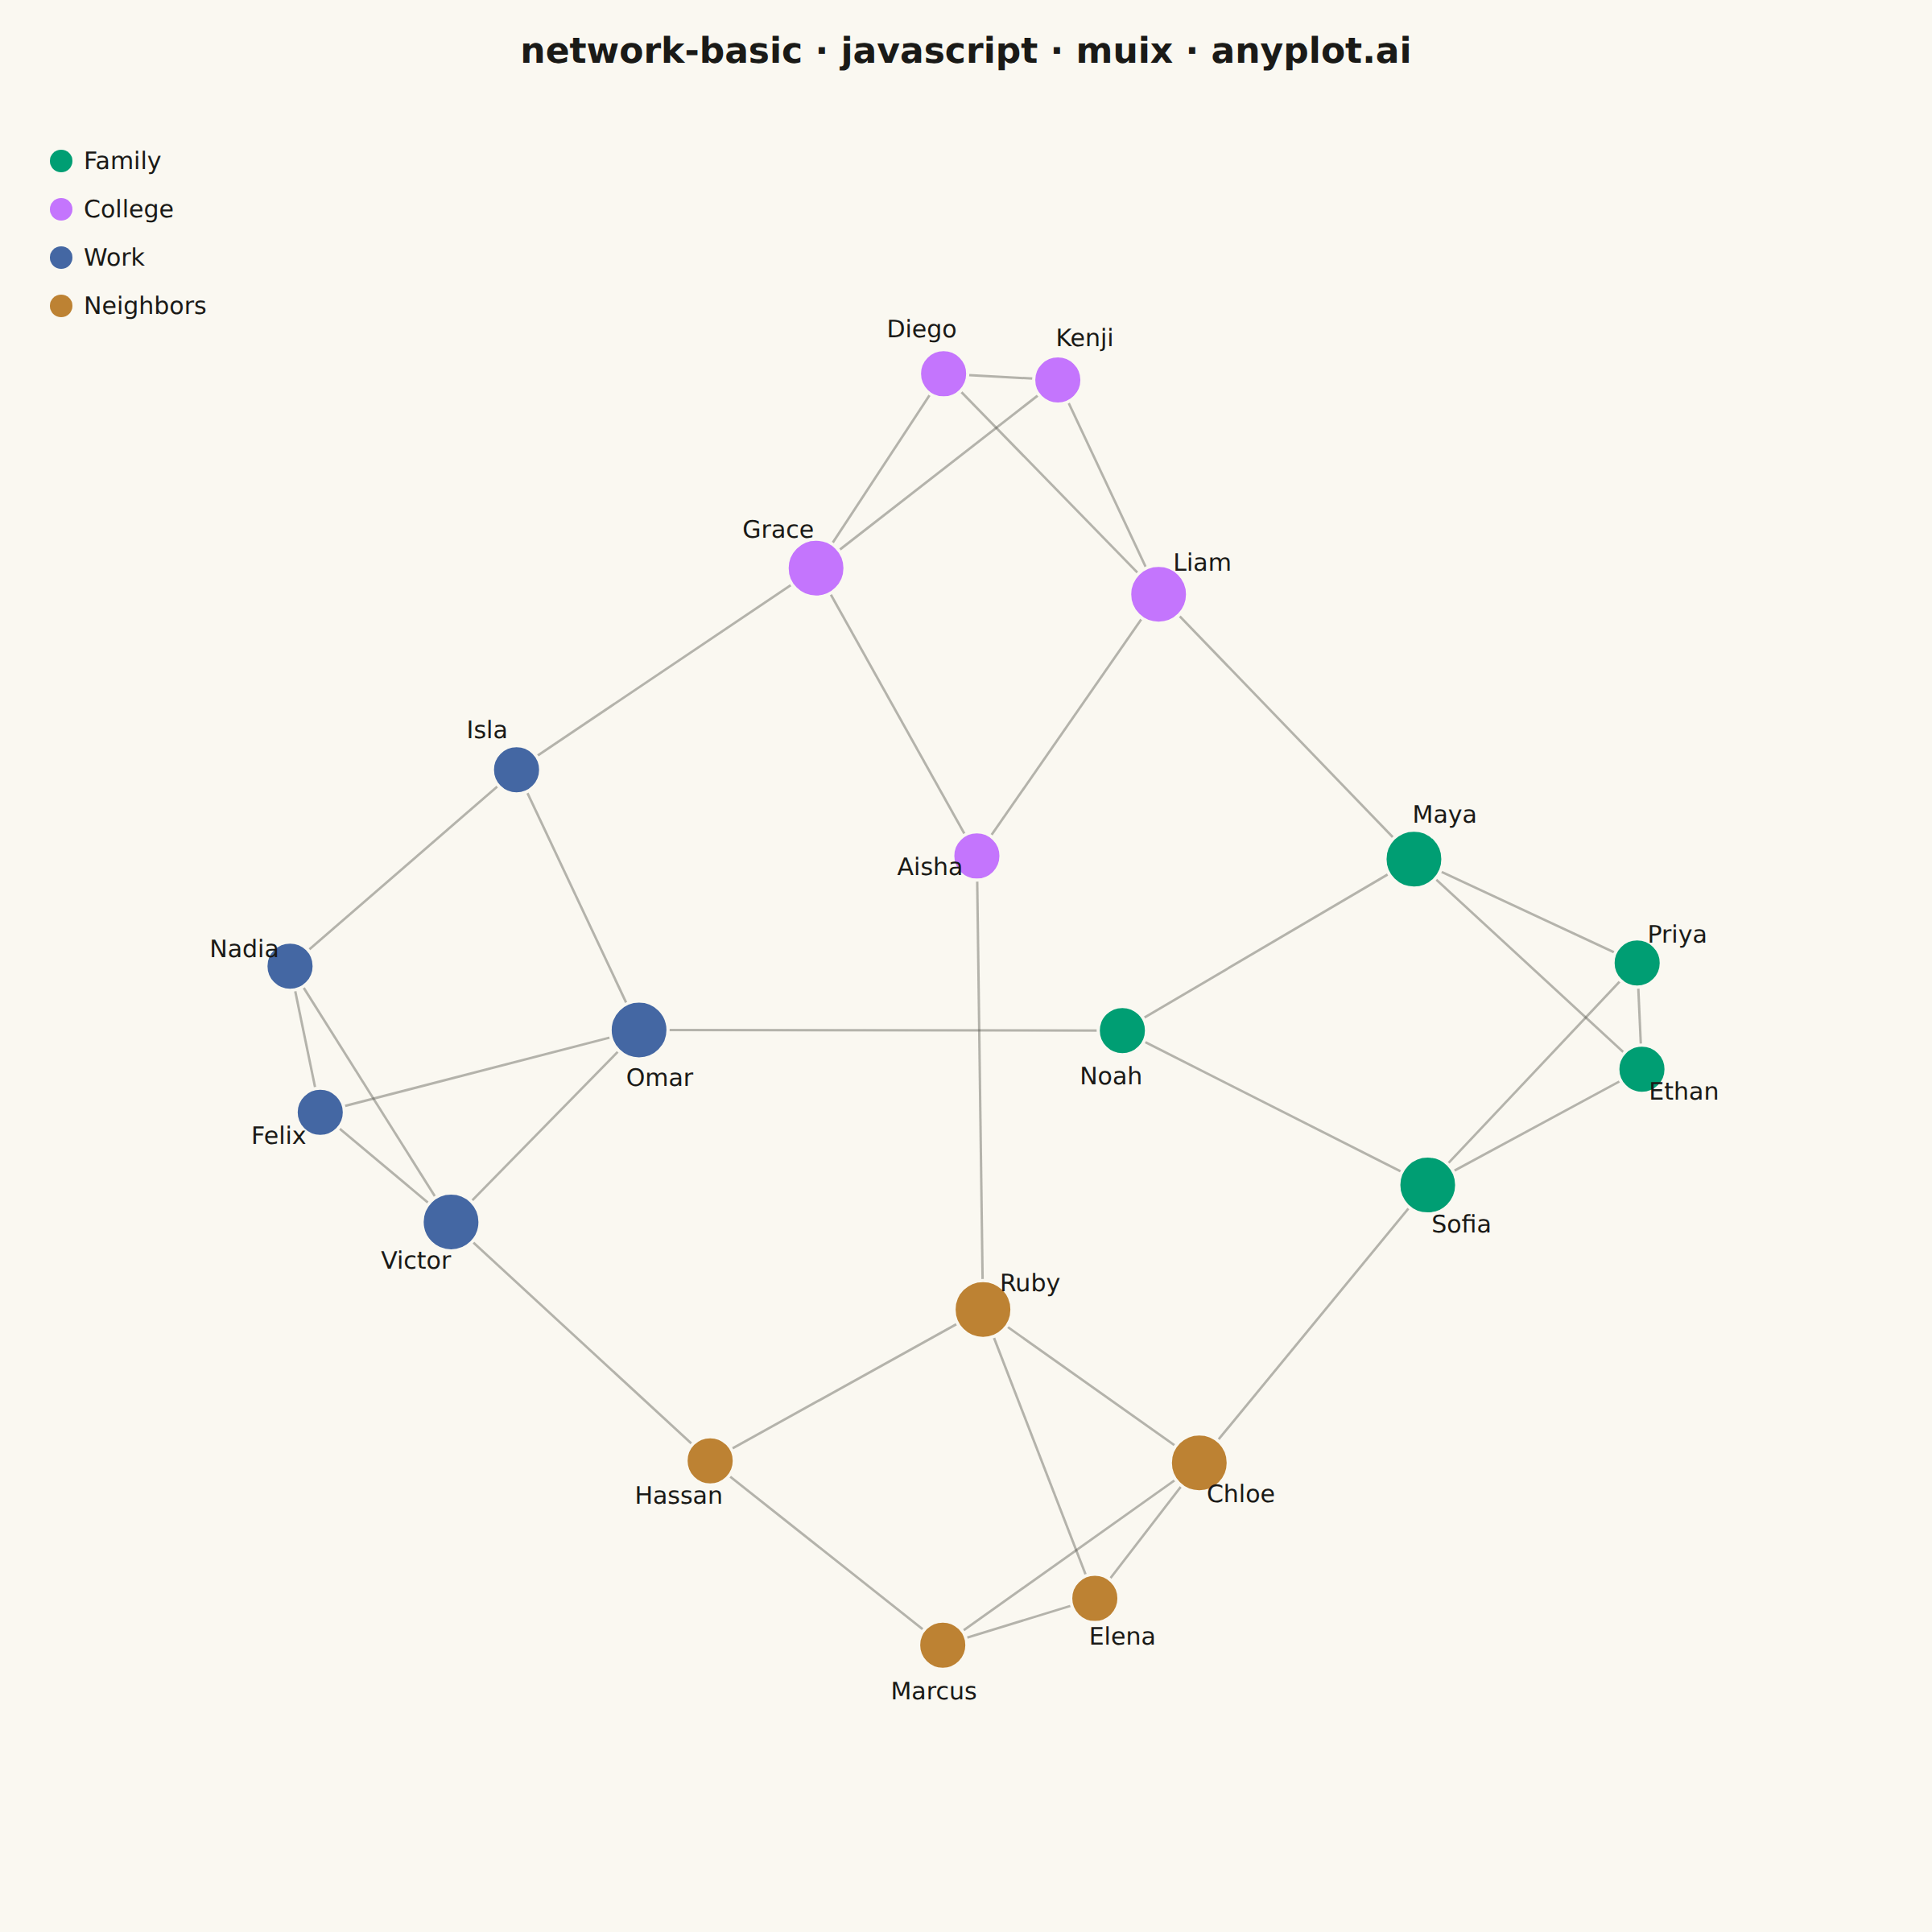
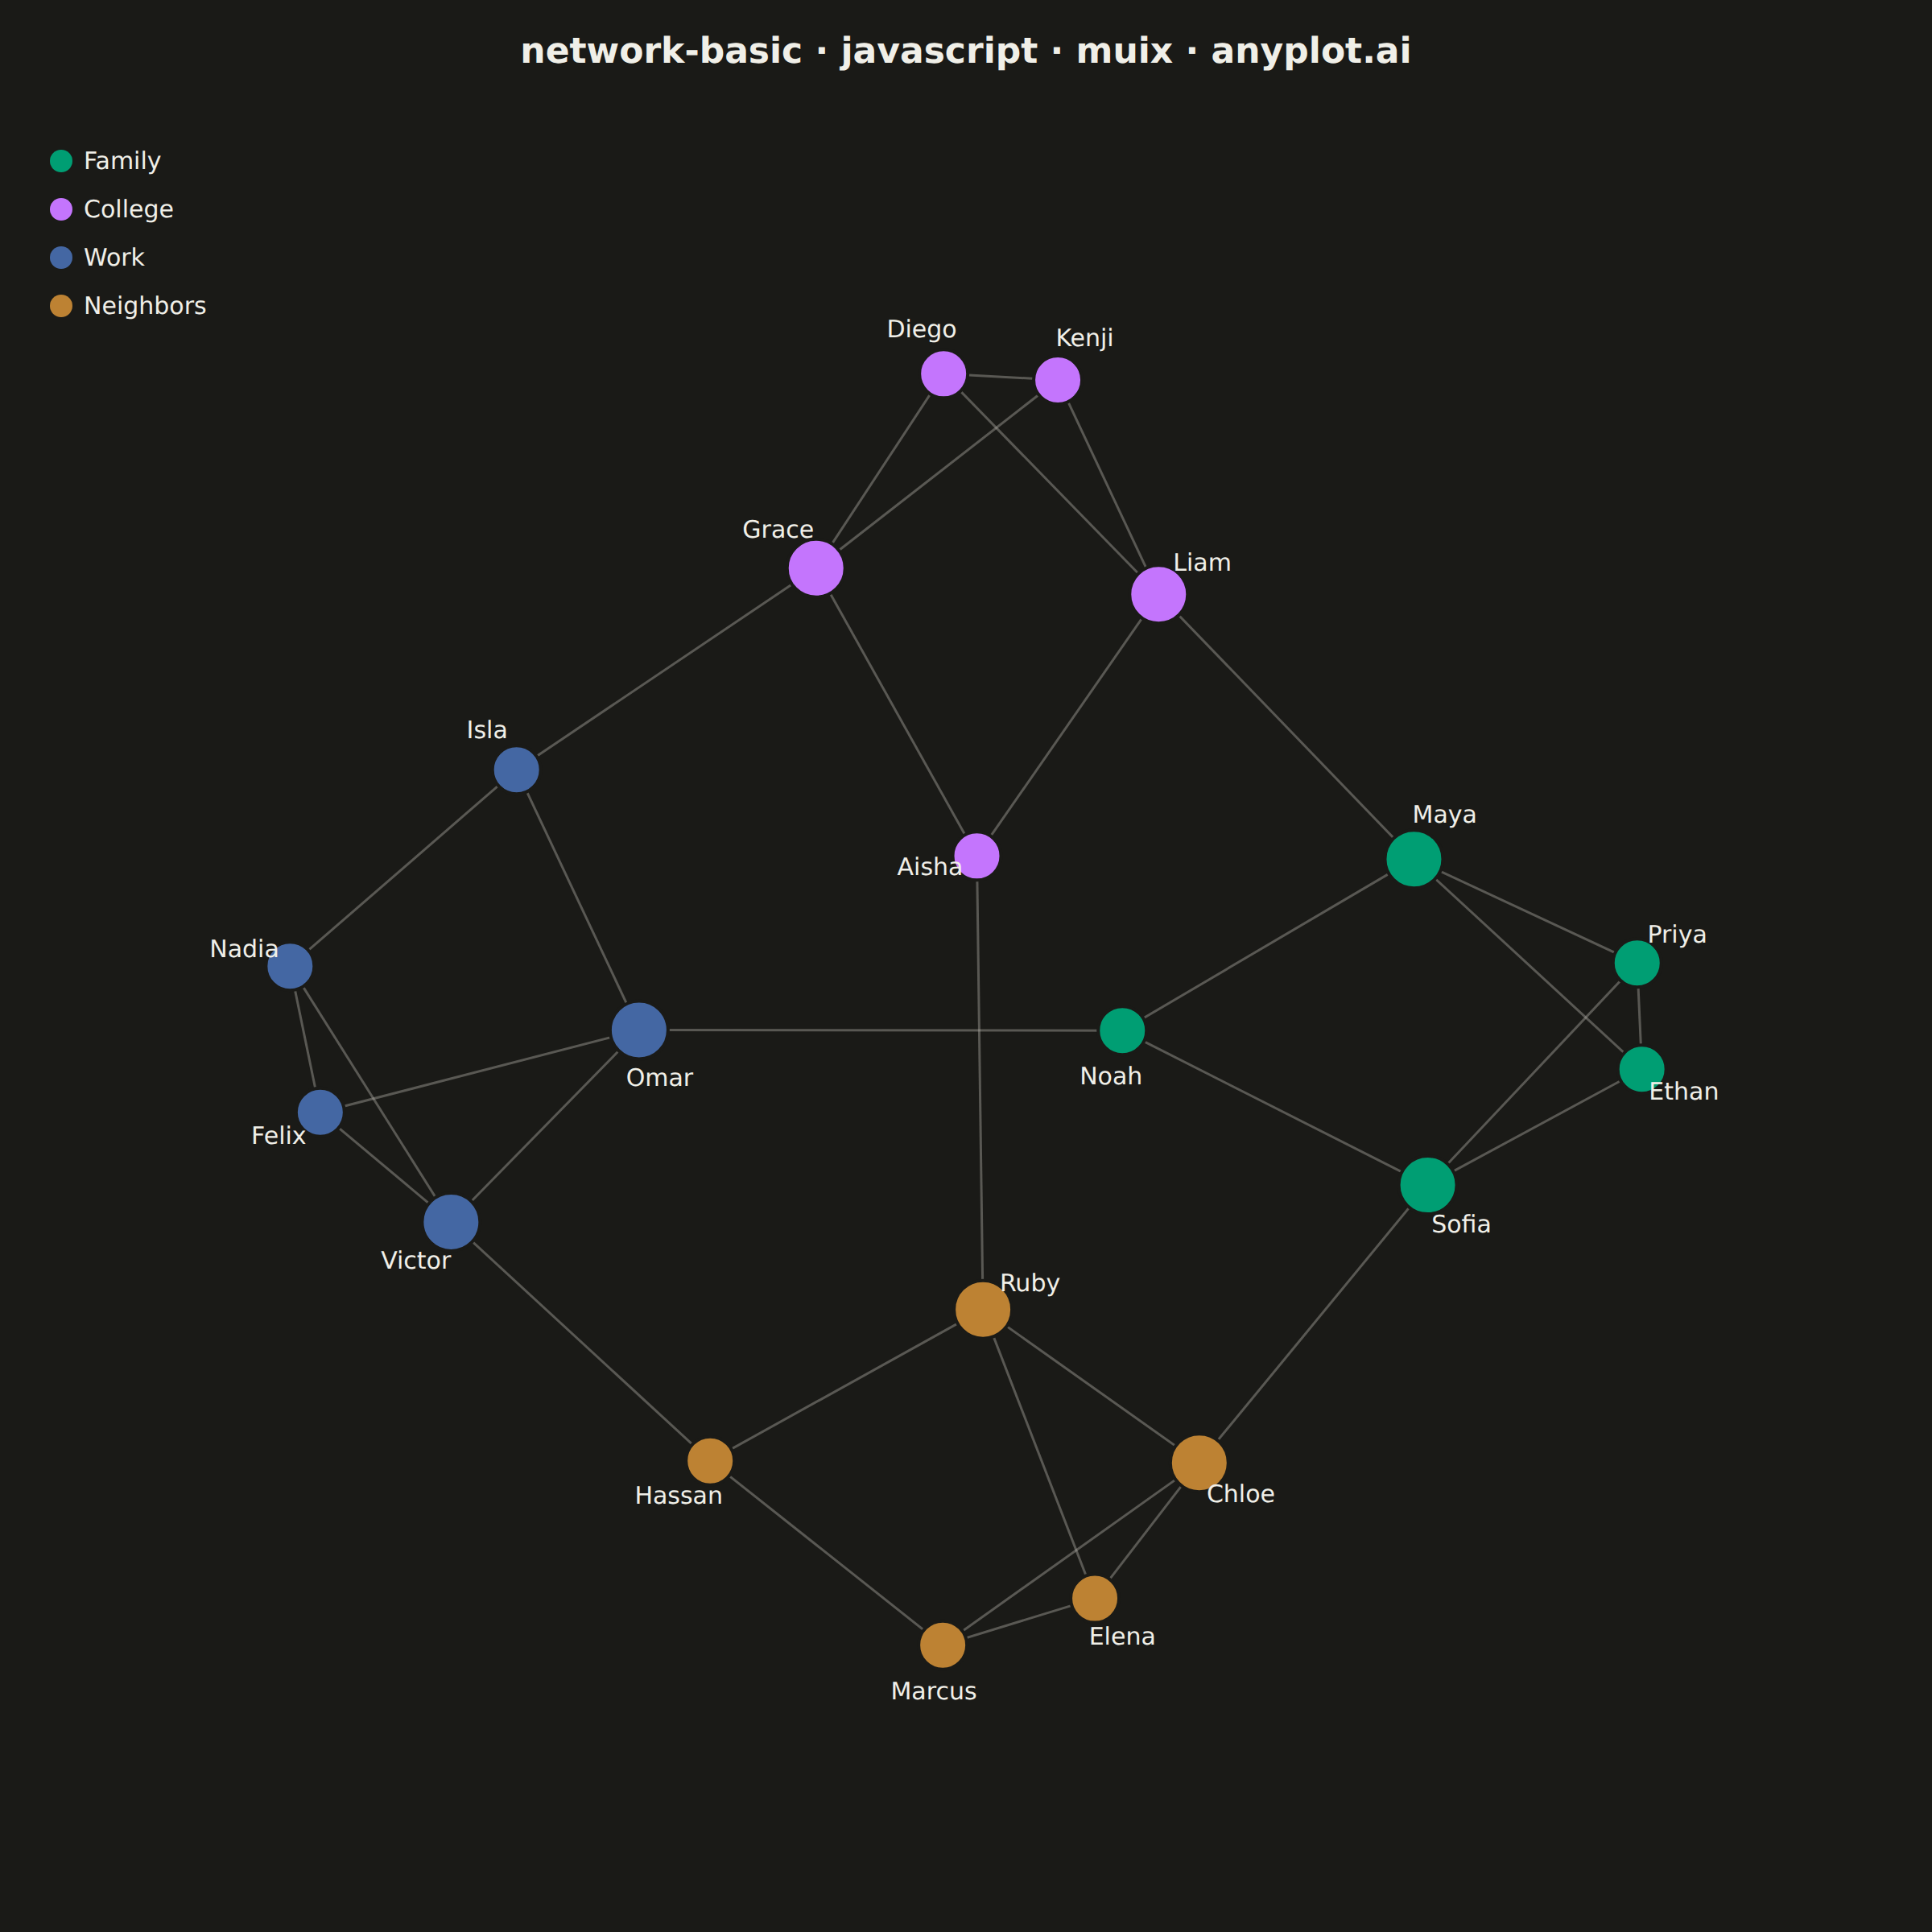
The same plot in 14 other libraries — JavaScript: Chart.js, D3.js, Apache ECharts, Highcharts; Python: Altair, Bokeh, lets-plot, Matplotlib, Plotly, plotnine, Pygal, Seaborn; R: ggplot2; Julia: Makie.jl. Compare all 15 side by side: Basic Network Graph in Python, R, Julia and JavaScript.
A network graph (node-link diagram) visualizes relationships between entities as nodes connected by edges. It reveals the structure of connections, clusters, and central nodes in relational data. Network graphs are essential for understanding complex systems where relationships matter as much as the entities themselves, making hidden patterns of connectivity visible at a glance.
// anyplot.ai
// network-basic: Basic Network Graph
// Library: muix 7.29.1 | JavaScript 22.23.1
// Quality: 91/100 | Created: 2026-07-24
//# anyplot-orientation: square
// anyplot.ai
// network-basic: Basic Network Graph
// Library: muix 7.29.1 | JavaScript 22.22.3
// License: @mui/x-charts — MIT (community). Pro/Premium are out of scope.
// Quality: pending | Created: 2026-07-24

import { ChartContainer } from "@mui/x-charts/ChartContainer";
import { useXScale, useYScale } from "@mui/x-charts/hooks";

const t = window.ANYPLOT_TOKENS;
const FONT = "Inter, system-ui, -apple-system, sans-serif";

// --- Data: a small social network — 20 people across 4 friend circles ------
// Nodes carry a group (friend circle) for color; edges are friendships.
const GROUPS = ["Family", "College", "Work", "Neighbors"];
const GROUP_COLOR = {
  Family: t.palette[0],
  College: t.palette[1],
  Work: t.palette[2],
  Neighbors: t.palette[3],
};

const NODES = [
  { label: "Maya", group: "Family" },
  { label: "Noah", group: "Family" },
  { label: "Priya", group: "Family" },
  { label: "Ethan", group: "Family" },
  { label: "Sofia", group: "Family" },
  { label: "Liam", group: "College" },
  { label: "Aisha", group: "College" },
  { label: "Kenji", group: "College" },
  { label: "Grace", group: "College" },
  { label: "Diego", group: "College" },
  { label: "Omar", group: "Work" },
  { label: "Isla", group: "Work" },
  { label: "Victor", group: "Work" },
  { label: "Nadia", group: "Work" },
  { label: "Felix", group: "Work" },
  { label: "Ruby", group: "Neighbors" },
  { label: "Hassan", group: "Neighbors" },
  { label: "Chloe", group: "Neighbors" },
  { label: "Marcus", group: "Neighbors" },
  { label: "Elena", group: "Neighbors" },
];

const EDGES = [
  // Family circle
  [0, 1], [0, 2], [0, 3], [1, 4], [2, 3], [3, 4], [2, 4],
  // College circle
  [5, 6], [5, 7], [6, 8], [7, 8], [7, 9], [8, 9], [5, 9],
  // Work circle
  [10, 11], [10, 12], [11, 13], [12, 13], [12, 14], [13, 14], [10, 14],
  // Neighbors circle
  [15, 16], [15, 17], [16, 18], [17, 18], [17, 19], [18, 19], [15, 19],
  // Bridges between circles (small-world shortcuts)
  [0, 5], [1, 10], [6, 15], [8, 11], [12, 16], [4, 17],
];

const DEGREES = NODES.map(() => 0);
EDGES.forEach(([a, b]) => {
  DEGREES[a] += 1;
  DEGREES[b] += 1;
});

// --- Force-directed layout (Fruchterman-Reingold), computed once, --------
// deterministic — no random numbers, so the same layout renders every run.
function initialPositions() {
  const groupCount = GROUPS.length;
  return NODES.map((node) => {
    const groupIndex = GROUPS.indexOf(node.group);
    const groupAngle = (2 * Math.PI * groupIndex) / groupCount;
    const withinGroup = NODES.filter((n) => n.group === node.group);
    const localIndex = withinGroup.indexOf(node);
    const localAngle = (2 * Math.PI * localIndex) / withinGroup.length;
    return {
      x: Math.cos(groupAngle) * 0.6 + Math.cos(localAngle) * 0.18,
      y: Math.sin(groupAngle) * 0.6 + Math.sin(localAngle) * 0.18,
    };
  });
}

function forceDirectedLayout() {
  const positions = initialPositions();
  const n = NODES.length;
  const k = 0.32; // ideal spring length
  const iterations = 300;
  let temperature = 0.06;
  const cooling = temperature / iterations;

  for (let iter = 0; iter < iterations; iter += 1) {
    const disp = positions.map(() => ({ x: 0, y: 0 }));

    for (let i = 0; i < n; i += 1) {
      for (let j = i + 1; j < n; j += 1) {
        const dx = positions[i].x - positions[j].x;
        const dy = positions[i].y - positions[j].y;
        const dist = Math.sqrt(dx * dx + dy * dy) || 0.001;
        const force = (k * k) / dist;
        const fx = (dx / dist) * force;
        const fy = (dy / dist) * force;
        disp[i].x += fx;
        disp[i].y += fy;
        disp[j].x -= fx;
        disp[j].y -= fy;
      }
    }

    EDGES.forEach(([a, b]) => {
      const dx = positions[a].x - positions[b].x;
      const dy = positions[a].y - positions[b].y;
      const dist = Math.sqrt(dx * dx + dy * dy) || 0.001;
      const force = (dist * dist) / k;
      const fx = (dx / dist) * force;
      const fy = (dy / dist) * force;
      disp[a].x -= fx;
      disp[a].y -= fy;
      disp[b].x += fx;
      disp[b].y += fy;
    });

    for (let i = 0; i < n; i += 1) {
      disp[i].x -= positions[i].x * 0.01;
      disp[i].y -= positions[i].y * 0.01;
    }

    for (let i = 0; i < n; i += 1) {
      const dist = Math.sqrt(disp[i].x ** 2 + disp[i].y ** 2) || 0.001;
      const move = Math.min(dist, temperature);
      positions[i].x += (disp[i].x / dist) * move;
      positions[i].y += (disp[i].y / dist) * move;
    }
    temperature -= cooling;
  }

  return positions;
}

const LAYOUT = forceDirectedLayout();
const xs = LAYOUT.map((p) => p.x);
const ys = LAYOUT.map((p) => p.y);
const centerX = (Math.min(...xs) + Math.max(...xs)) / 2;
const centerY = (Math.min(...ys) + Math.max(...ys)) / 2;
const extent =
  (Math.max(Math.max(...xs) - Math.min(...xs), Math.max(...ys) - Math.min(...ys)) / 2) * 1.35;
const X_DOMAIN = [centerX - extent, centerX + extent];
const Y_DOMAIN = [centerY - extent, centerY + extent];

// --- Custom marks — drawn on the MUI X coordinate system --------------------
function NetworkEdges() {
  const xs2 = useXScale();
  const ys2 = useYScale();
  return (
    <g stroke={t.inkSoft} strokeOpacity={0.4} strokeWidth={1.5}>
      {EDGES.map(([a, b], i) => (
        <line
          key={`edge-${i}`}
          x1={xs2(LAYOUT[a].x)}
          y1={ys2(LAYOUT[a].y)}
          x2={xs2(LAYOUT[b].x)}
          y2={ys2(LAYOUT[b].y)}
        />
      ))}
    </g>
  );
}

function NetworkNodes() {
  const xs2 = useXScale();
  const ys2 = useYScale();
  const screenPos = LAYOUT.map((p) => ({ x: xs2(p.x), y: ys2(p.y) }));
  return (
    <g fontFamily={FONT}>
      {NODES.map((node, i) => {
        const { x: cx, y: cy } = screenPos[i];
        const r = 6 + DEGREES[i] * 3;
        // Place the label in the widest angular gap between this node's edges, so
        // it never sits on top of a line (e.g. the Aisha-Ruby bridge edge).
        const edgeAngles = [];
        EDGES.forEach(([a, b]) => {
          if (a === i) edgeAngles.push(Math.atan2(screenPos[b].y - cy, screenPos[b].x - cx));
          else if (b === i) edgeAngles.push(Math.atan2(screenPos[a].y - cy, screenPos[a].x - cx));
        });
        let labelAngle = Math.PI / 2;
        if (edgeAngles.length > 0) {
          edgeAngles.sort((a, b) => a - b);
          let bestGap = -1;
          for (let k = 0; k < edgeAngles.length; k += 1) {
            const start = edgeAngles[k];
            const end = edgeAngles[(k + 1) % edgeAngles.length] + (k === edgeAngles.length - 1 ? 2 * Math.PI : 0);
            const gap = end - start;
            if (gap > bestGap) {
              bestGap = gap;
              labelAngle = start + gap / 2;
            }
          }
        }
        const labelDist = r + 15;
        const lx = cx + Math.cos(labelAngle) * labelDist;
        const ly = cy + Math.sin(labelAngle) * labelDist;
        return (
          <g key={node.label}>
            <circle cx={cx} cy={cy} r={r} fill={GROUP_COLOR[node.group]} stroke={t.pageBg} strokeWidth={2} />
            <text x={lx} y={ly} fontSize={15} fill={t.ink} textAnchor="middle" dominantBaseline="middle">
              {node.label}
            </text>
          </g>
        );
      })}
    </g>
  );
}

function Legend() {
  return (
    <g transform="translate(30, 28)" fontFamily={FONT}>
      {GROUPS.map((group, i) => (
        <g key={group} transform={`translate(0, ${i * 30})`}>
          <circle cx={8} cy={8} r={7} fill={GROUP_COLOR[group]} />
          <text x={22} y={13} fontSize={15} fill={t.ink}>
            {group}
          </text>
        </g>
      ))}
    </g>
  );
}

const TITLE_H = 64;

export default function Chart() {
  const W = window.ANYPLOT_SIZE.width;
  const H = window.ANYPLOT_SIZE.height;
  return (
    <div
      style={{
        width: W,
        height: H,
        background: t.pageBg,
        fontFamily: FONT,
        display: "flex",
        flexDirection: "column",
      }}
    >
      <div style={{ height: TITLE_H, display: "flex", alignItems: "center", justifyContent: "center" }}>
        <span style={{ fontSize: 22, fontWeight: 600, color: t.ink }}>
          network-basic · javascript · muix · anyplot.ai
        </span>
      </div>
      <ChartContainer
        width={W}
        height={H - TITLE_H}
        skipAnimation
        series={[]}
        margin={{ top: 30, right: 30, bottom: 40, left: 30 }}
        xAxis={[{ min: X_DOMAIN[0], max: X_DOMAIN[1], scaleType: "linear" }]}
        yAxis={[{ min: Y_DOMAIN[0], max: Y_DOMAIN[1], scaleType: "linear" }]}
      >
        <NetworkEdges />
        <NetworkNodes />
        <Legend />
      </ChartContainer>
    </div>
  );
}
Runnable source as JSON, for any HTTP client: https://api.anyplot.ai/specs/network-basic/muix/code. Any spec id and library id listed in llms-full.txt fit the same URL shape; every URL below is complete and callable.
{
  "spec_id": "network-basic",
  "language": "javascript",
  "library": "muix",
  "page": "https://anyplot.ai/network-basic/javascript/muix",
  "hub": "https://anyplot.ai/network-basic",
  "code_json": "https://api.anyplot.ai/specs/network-basic/muix/code",
  "spec_json": "https://api.anyplot.ai/specs/network-basic",
  "render_light_png": "https://storage.googleapis.com/anyplot-images/plots/network-basic/javascript/muix/plot-light.png",
  "render_dark_png": "https://storage.googleapis.com/anyplot-images/plots/network-basic/javascript/muix/plot-dark.png",
  "interactive_light_html": "https://storage.googleapis.com/anyplot-images/plots/network-basic/javascript/muix/plot-light.html",
  "interactive_dark_html": "https://storage.googleapis.com/anyplot-images/plots/network-basic/javascript/muix/plot-dark.html",
  "quality_score": 91.0,
  "license": "MIT",
  "guide": "https://anyplot.ai/llms.txt"
}
Part of Basic Network Graph on anyplot.ai.