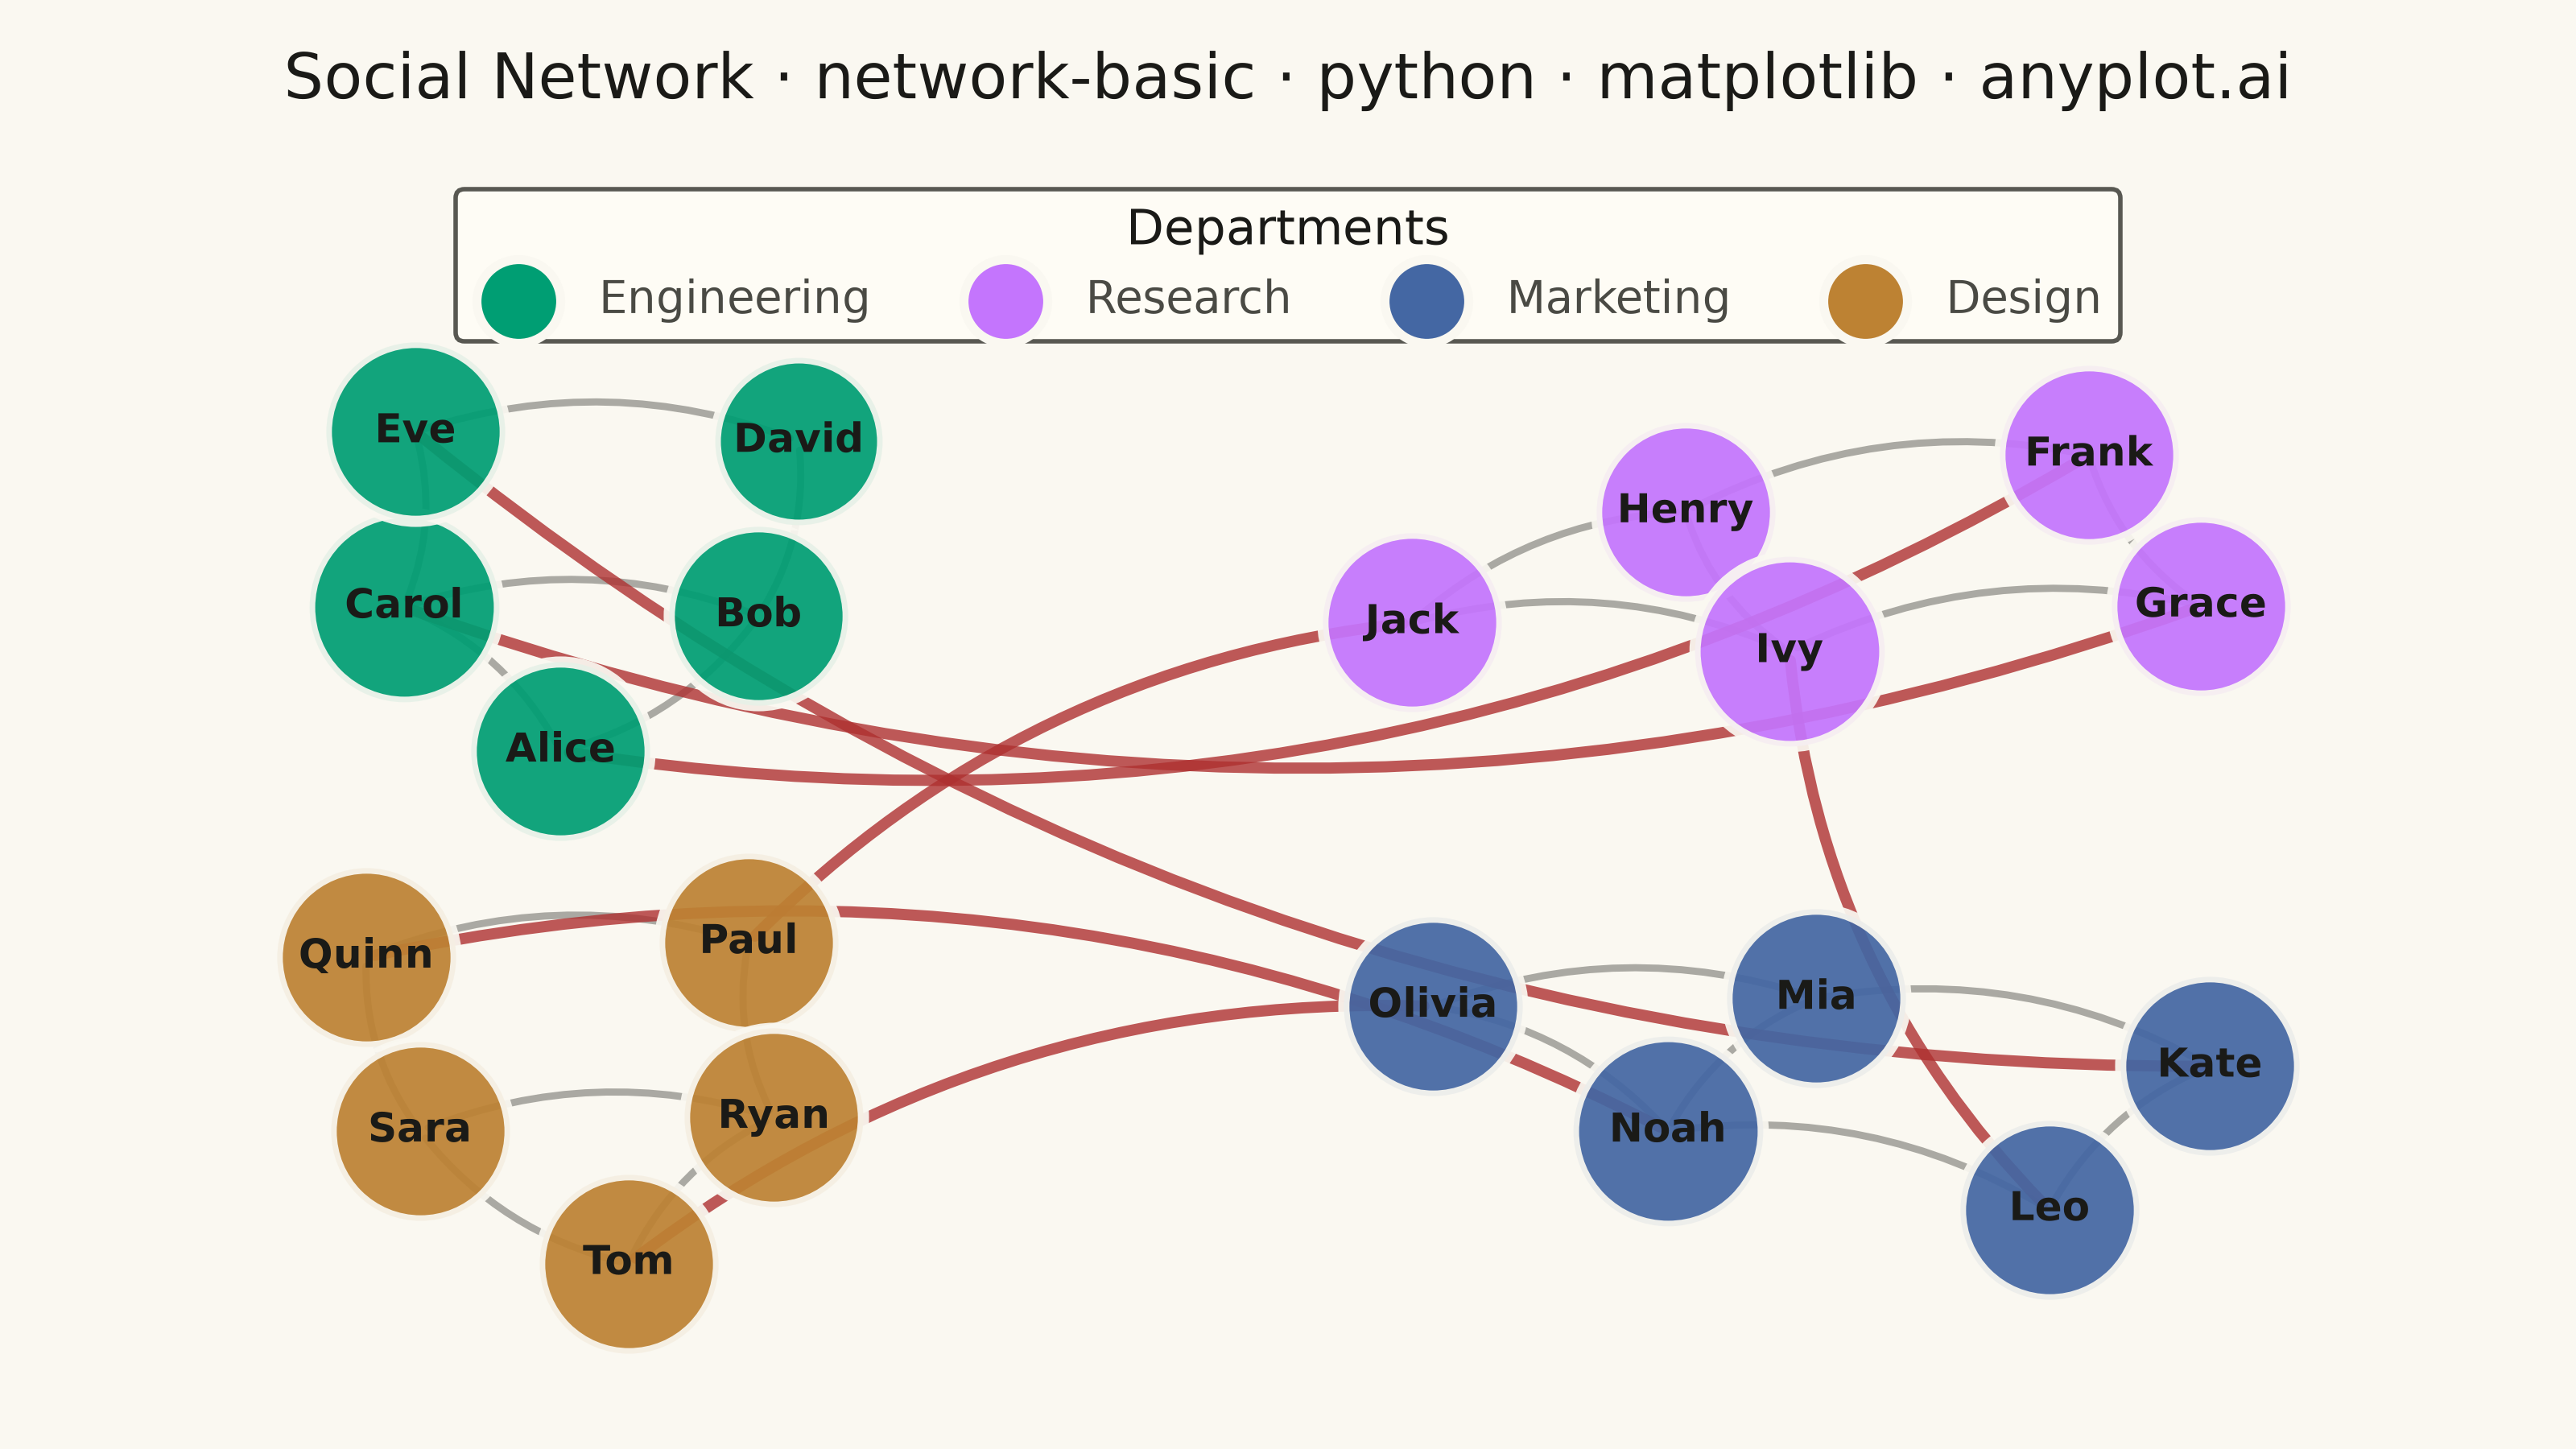
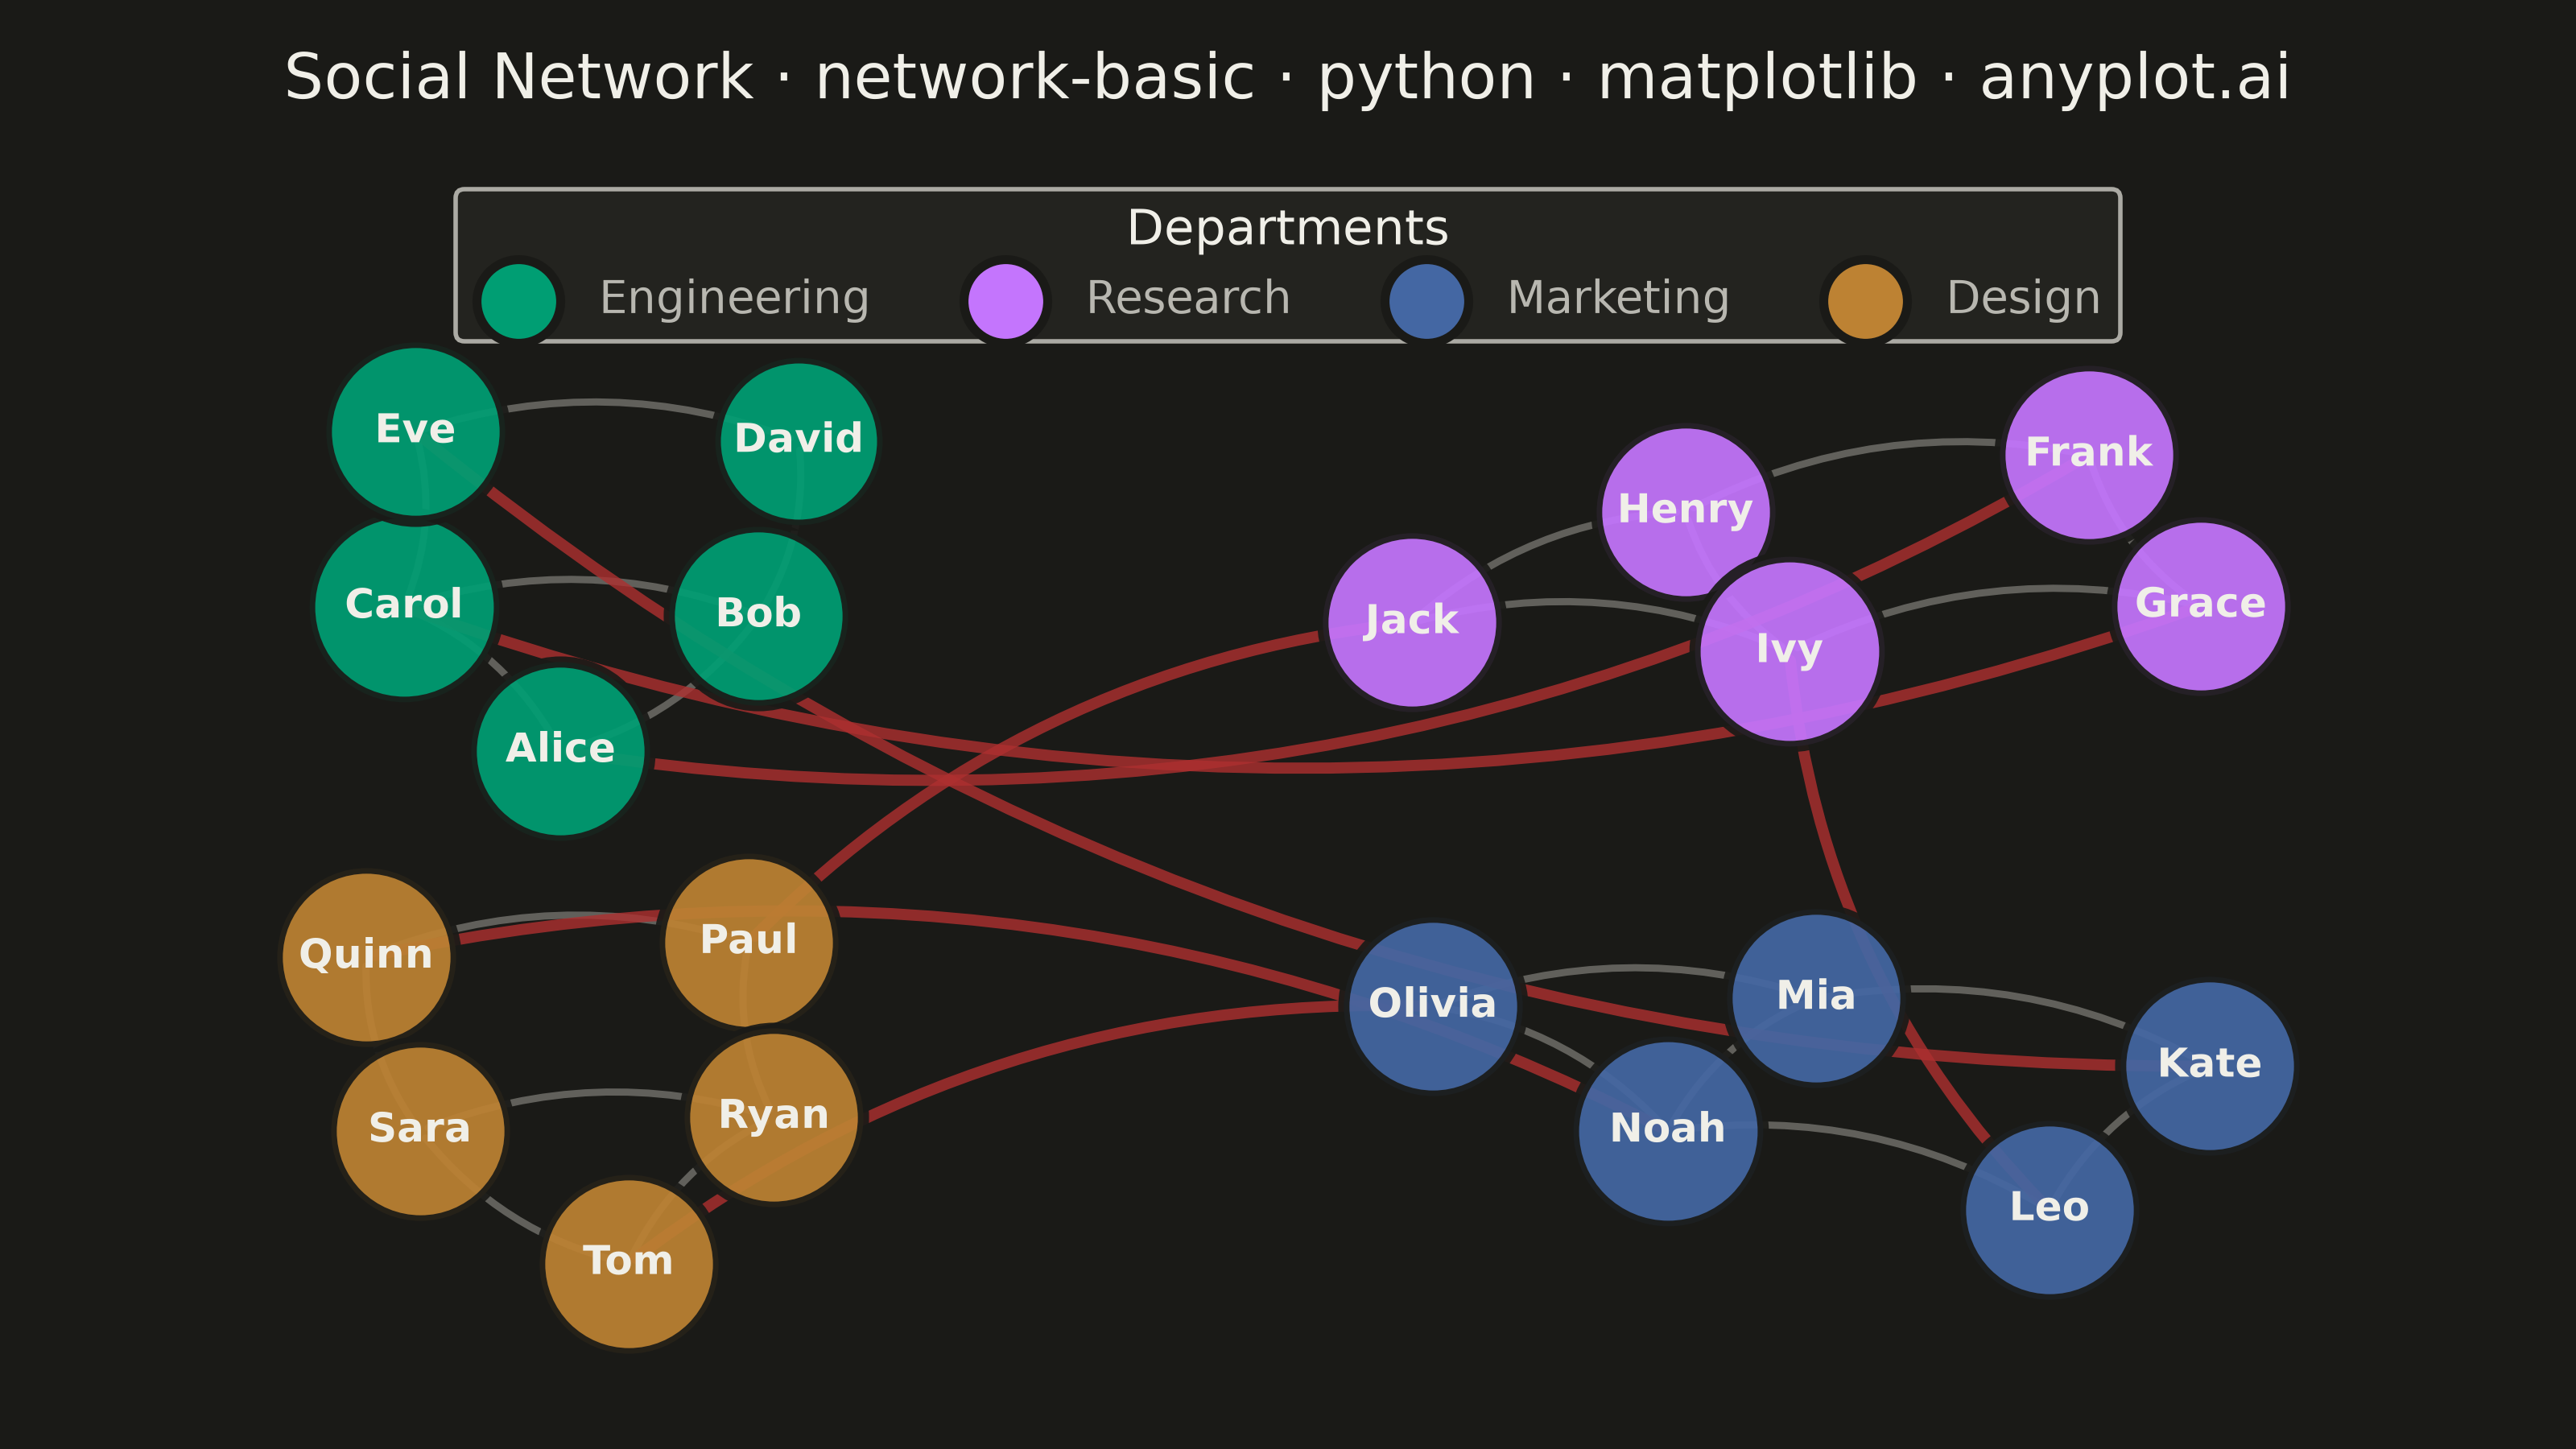
A network graph (node-link diagram) visualizes relationships between entities as nodes connected by edges. It reveals the structure of connections, clusters, and central nodes in relational data. Network graphs are essential for understanding complex systems where relationships matter as much as the entities themselves, making hidden patterns of connectivity visible at a glance.
""" anyplot.ai
network-basic: Basic Network Graph
Library: matplotlib 3.11.1 | Python 3.13.14
Quality: 86/100 | Updated: 2026-07-24
"""

import os

import matplotlib.pyplot as plt
import numpy as np
from matplotlib.patches import FancyArrowPatch


# Theme tokens
THEME = os.getenv("ANYPLOT_THEME", "light")
PAGE_BG = "#FAF8F1" if THEME == "light" else "#1A1A17"
ELEVATED_BG = "#FFFDF6" if THEME == "light" else "#242420"
INK = "#1A1A17" if THEME == "light" else "#F0EFE8"
INK_SOFT = "#4A4A44" if THEME == "light" else "#B8B7B0"

# Imprint palette for 4 departments
GROUP_COLORS = ["#009E73", "#C475FD", "#4467A3", "#BD8233"]
GROUP_NAMES = ["Engineering", "Research", "Marketing", "Design"]
BRIDGE_COLOR = "#AE3030"  # Imprint palette position 5 (matte red) — cross-department highlight

# Data: social network of 20 people across 4 company departments
np.random.seed(42)
nodes = [
    {"id": 0, "label": "Alice", "group": 0},
    {"id": 1, "label": "Bob", "group": 0},
    {"id": 2, "label": "Carol", "group": 0},
    {"id": 3, "label": "David", "group": 0},
    {"id": 4, "label": "Eve", "group": 0},
    {"id": 5, "label": "Frank", "group": 1},
    {"id": 6, "label": "Grace", "group": 1},
    {"id": 7, "label": "Henry", "group": 1},
    {"id": 8, "label": "Ivy", "group": 1},
    {"id": 9, "label": "Jack", "group": 1},
    {"id": 10, "label": "Kate", "group": 2},
    {"id": 11, "label": "Leo", "group": 2},
    {"id": 12, "label": "Mia", "group": 2},
    {"id": 13, "label": "Noah", "group": 2},
    {"id": 14, "label": "Olivia", "group": 2},
    {"id": 15, "label": "Paul", "group": 3},
    {"id": 16, "label": "Quinn", "group": 3},
    {"id": 17, "label": "Ryan", "group": 3},
    {"id": 18, "label": "Sara", "group": 3},
    {"id": 19, "label": "Tom", "group": 3},
]

edges = [
    # Engineering internal
    (0, 1),
    (0, 2),
    (1, 2),
    (1, 3),
    (2, 4),
    (3, 4),
    # Research internal
    (5, 6),
    (5, 7),
    (6, 8),
    (7, 8),
    (7, 9),
    (8, 9),
    # Marketing internal
    (10, 11),
    (10, 12),
    (11, 13),
    (12, 13),
    (12, 14),
    (13, 14),
    # Design internal
    (15, 16),
    (15, 17),
    (16, 18),
    (17, 18),
    (17, 19),
    (18, 19),
    # Cross-department bridges
    (0, 5),
    (4, 10),
    (9, 15),
    (14, 19),
    (2, 6),
    (8, 11),
    (13, 16),
]
cross_edge_set = {(src, tgt) for src, tgt in edges if nodes[src]["group"] != nodes[tgt]["group"]}

# Force-directed spring layout (Fruchterman-Reingold style, no networkx),
# run independently within each department. Laying out each community on
# its own — instead of one global simulation — guarantees 4 spatially
# distinct clusters: cross-department bridge edges are drawn afterwards as
# pure visual connectors and never distort the local layouts.
quadrant_centers = {
    0: np.array([-0.62, 0.62]),  # Engineering: upper-left
    1: np.array([0.62, 0.62]),  # Research: upper-right
    2: np.array([0.62, -0.62]),  # Marketing: lower-right
    3: np.array([-0.62, -0.62]),  # Design: lower-left
}
K_LOCAL = 0.45
pos = {}
for group in range(4):
    group_nodes = [node["id"] for node in nodes if node["group"] == group]
    local_edges = [(src, tgt) for src, tgt in edges if (src, tgt) not in cross_edge_set and src in group_nodes]
    m = len(group_nodes)
    idx = {node_id: i for i, node_id in enumerate(group_nodes)}
    local_pos = np.random.randn(m, 2) * 0.3

    for iteration in range(150):
        displacement = np.zeros((m, 2))
        for i in range(m):
            for j in range(i + 1, m):
                diff = local_pos[i] - local_pos[j]
                dist = max(np.linalg.norm(diff), 0.01)
                force = (K_LOCAL * K_LOCAL / dist) * (diff / dist)
                displacement[i] += force
                displacement[j] -= force
        for src, tgt in local_edges:
            i, j = idx[src], idx[tgt]
            diff = local_pos[i] - local_pos[j]
            dist = max(np.linalg.norm(diff), 0.01)
            force = (dist * dist / K_LOCAL) * (diff / dist)
            displacement[i] -= force
            displacement[j] += force
        cooling = 1 - iteration / 150
        for i in range(m):
            disp_norm = np.linalg.norm(displacement[i])
            if disp_norm > 0:
                local_pos[i] += (displacement[i] / disp_norm) * min(disp_norm, 0.08 * cooling)

    local_pos -= local_pos.mean(axis=0)
    radius = np.linalg.norm(local_pos, axis=1).max()
    local_pos = local_pos / radius * 0.44
    for node_id, i in idx.items():
        pos[node_id] = quadrant_centers[group] + local_pos[i]

all_pos = np.array([pos[node["id"]] for node in nodes])
pos_min = all_pos.min(axis=0)
pos_max = all_pos.max(axis=0)
for node in nodes:
    pos[node["id"]] = (pos[node["id"]] - pos_min) / (pos_max - pos_min) * 0.82 + 0.09

# Node degrees for size encoding
degrees = {node["id"]: 0 for node in nodes}
for src, tgt in edges:
    degrees[src] += 1
    degrees[tgt] += 1

# Plot
fig, ax = plt.subplots(figsize=(8, 4.5), dpi=400, facecolor=PAGE_BG)
fig.subplots_adjust(left=0.02, right=0.98, top=0.80, bottom=0.03)
ax.set_facecolor(PAGE_BG)

# Draw curved edges using FancyArrowPatch
for src, tgt in edges:
    is_cross = (src, tgt) in cross_edge_set
    patch = FancyArrowPatch(
        tuple(pos[src]),
        tuple(pos[tgt]),
        connectionstyle="arc3,rad=0.18",
        arrowstyle="-",
        color=BRIDGE_COLOR if is_cross else INK_SOFT,
        linewidth=2.5 if is_cross else 1.6,
        alpha=0.80 if is_cross else 0.45,
        zorder=1,
    )
    ax.add_patch(patch)

# Draw nodes (size encodes degree; large enough to fully contain the label below)
for node in nodes:
    x, y = pos[node["id"]]
    size = 1000 + degrees[node["id"]] * 200
    color = GROUP_COLORS[node["group"]]
    ax.scatter(x, y, s=size, c=color, edgecolors=PAGE_BG, linewidths=2.5, alpha=0.93, zorder=2)

# Draw labels inside nodes — fontsize kept small enough that even the
# longest name ("Olivia") stays within the smallest-degree node's circle
for node in nodes:
    x, y = pos[node["id"]]
    ax.text(x, y, node["label"], fontsize=9, fontweight="bold", ha="center", va="center", color=INK, zorder=3)

# Style
title = "Social Network · network-basic · python · matplotlib · anyplot.ai"
fig.suptitle(title, fontsize=14, fontweight="medium", color=INK, y=0.965)
ax.set_xlim(-0.05, 1.05)
ax.set_ylim(-0.05, 1.05)
ax.axis("off")

# Legend — placed as a horizontal row in the reserved top margin, clear of
# the network area, so it never overlaps a department cluster
legend_handles = [
    ax.scatter([], [], c=color, s=350, edgecolors=PAGE_BG, linewidths=2, label=name)
    for color, name in zip(GROUP_COLORS, GROUP_NAMES, strict=True)
]
leg = fig.legend(
    handles=legend_handles,
    loc="upper center",
    bbox_to_anchor=(0.5, 0.885),
    ncol=4,
    fontsize=10,
    title="Departments",
    title_fontsize=11,
    frameon=True,
)
leg.get_frame().set_facecolor(ELEVATED_BG)
leg.get_frame().set_edgecolor(INK_SOFT)
leg.get_frame().set_alpha(0.92)
plt.setp(leg.get_texts(), color=INK_SOFT)
leg.get_title().set_color(INK)

plt.savefig(f"plot-{THEME}.png", dpi=400, facecolor=PAGE_BG)  # bbox_inches MUST stay default (None)
Runnable source as JSON, for any HTTP client: https://api.anyplot.ai/specs/network-basic/matplotlib/code. Any spec id and library id listed in llms-full.txt fit the same URL shape; every URL below is complete and callable.
{
  "spec_id": "network-basic",
  "language": "python",
  "library": "matplotlib",
  "page": "https://anyplot.ai/network-basic/python/matplotlib",
  "hub": "https://anyplot.ai/network-basic",
  "code_json": "https://api.anyplot.ai/specs/network-basic/matplotlib/code",
  "spec_json": "https://api.anyplot.ai/specs/network-basic",
  "render_light_png": "https://storage.googleapis.com/anyplot-images/plots/network-basic/python/matplotlib/plot-light.png",
  "render_dark_png": "https://storage.googleapis.com/anyplot-images/plots/network-basic/python/matplotlib/plot-dark.png",
  "quality_score": 86.0,
  "license": "MIT",
  "guide": "https://anyplot.ai/llms.txt"
}
Part of Basic Network Graph on anyplot.ai.