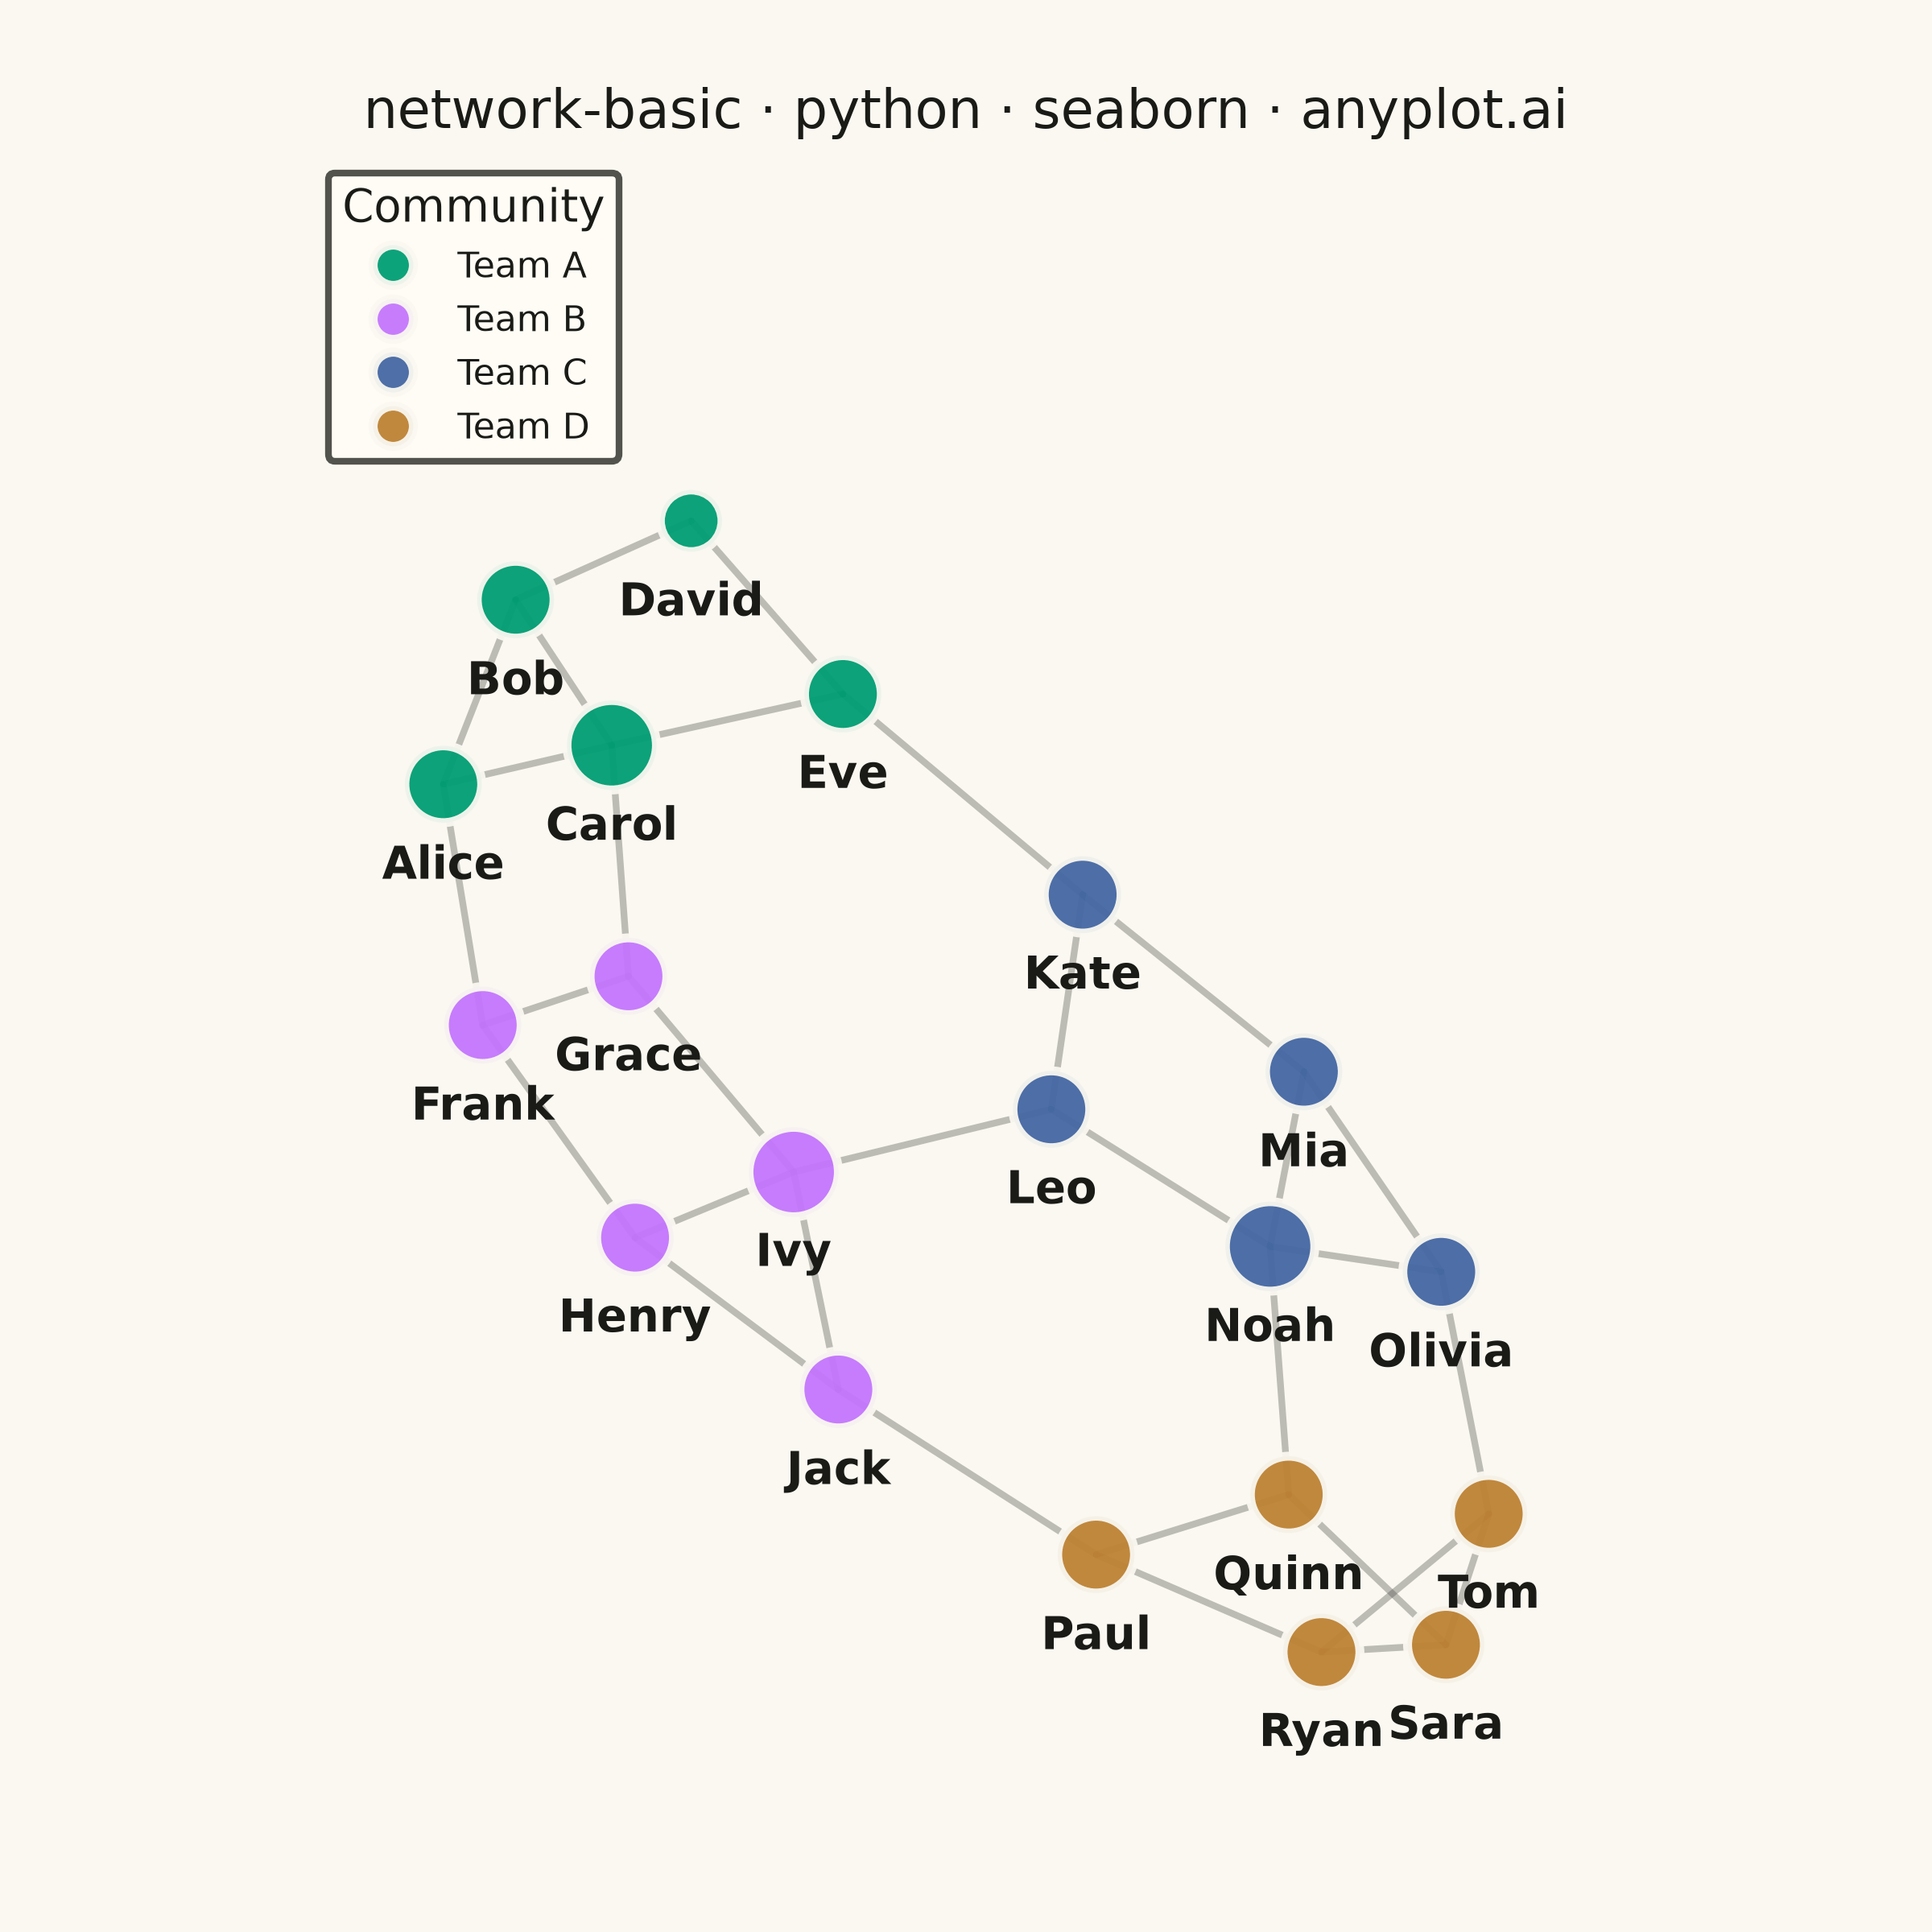
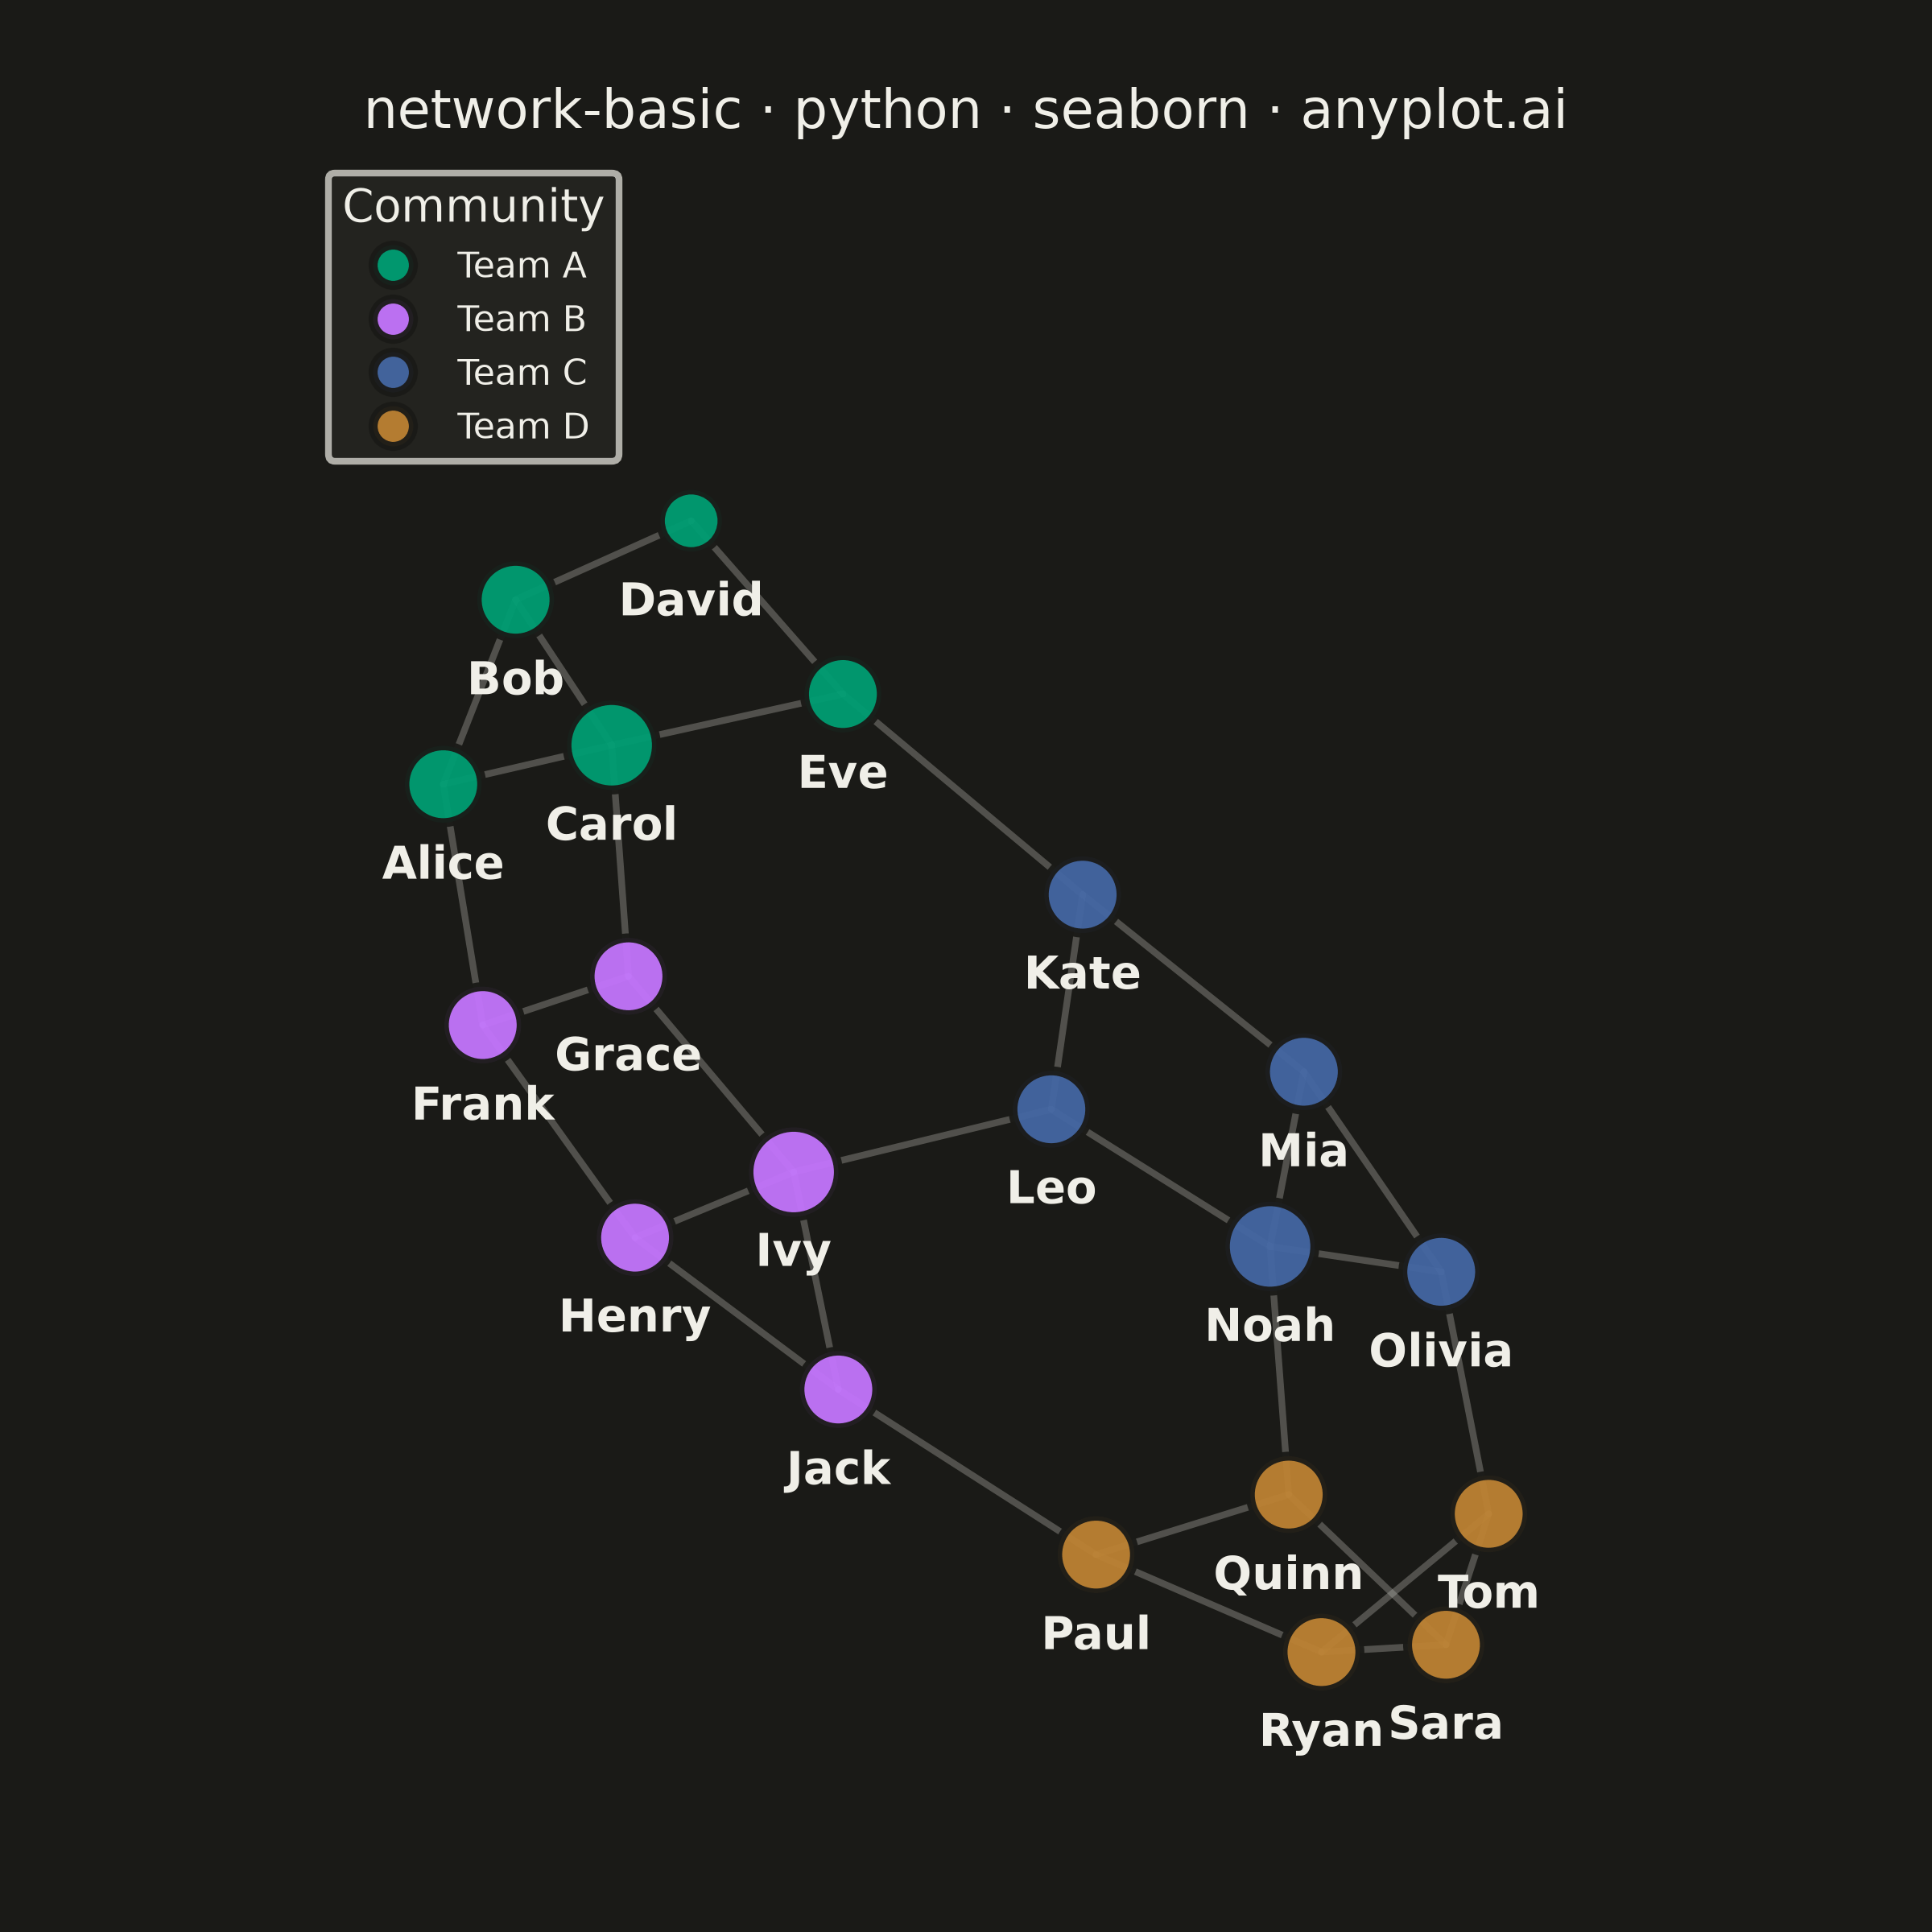
A network graph (node-link diagram) visualizes relationships between entities as nodes connected by edges. It reveals the structure of connections, clusters, and central nodes in relational data. Network graphs are essential for understanding complex systems where relationships matter as much as the entities themselves, making hidden patterns of connectivity visible at a glance.
""" anyplot.ai
network-basic: Basic Network Graph
Library: seaborn 0.13.2 | Python 3.13.14
Quality: 90/100 | Updated: 2026-07-24
"""

import os

import matplotlib.pyplot as plt
import numpy as np
import pandas as pd
import seaborn as sns


# Theme tokens (see prompts/default-style-guide.md "Theme-adaptive Chrome")
THEME = os.getenv("ANYPLOT_THEME", "light")
PAGE_BG = "#FAF8F1" if THEME == "light" else "#1A1A17"
ELEVATED_BG = "#FFFDF6" if THEME == "light" else "#242420"
INK = "#1A1A17" if THEME == "light" else "#F0EFE8"
INK_SOFT = "#4A4A44" if THEME == "light" else "#B8B7B0"

# Imprint categorical palette — first 4 positions for the 4 communities
IMPRINT_PALETTE = ["#009E73", "#C475FD", "#4467A3", "#BD8233"]

sns.set_theme(
    style="white",
    context="talk",
    rc={
        "figure.facecolor": PAGE_BG,
        "axes.facecolor": PAGE_BG,
        "text.color": INK,
        "legend.facecolor": ELEVATED_BG,
        "legend.edgecolor": INK_SOFT,
    },
)

# Seed for reproducibility
np.random.seed(42)

# Data: a small social network with 20 people in 4 communities
nodes = [
    {"id": 0, "label": "Alice", "group": "Team A"},
    {"id": 1, "label": "Bob", "group": "Team A"},
    {"id": 2, "label": "Carol", "group": "Team A"},
    {"id": 3, "label": "David", "group": "Team A"},
    {"id": 4, "label": "Eve", "group": "Team A"},
    {"id": 5, "label": "Frank", "group": "Team B"},
    {"id": 6, "label": "Grace", "group": "Team B"},
    {"id": 7, "label": "Henry", "group": "Team B"},
    {"id": 8, "label": "Ivy", "group": "Team B"},
    {"id": 9, "label": "Jack", "group": "Team B"},
    {"id": 10, "label": "Kate", "group": "Team C"},
    {"id": 11, "label": "Leo", "group": "Team C"},
    {"id": 12, "label": "Mia", "group": "Team C"},
    {"id": 13, "label": "Noah", "group": "Team C"},
    {"id": 14, "label": "Olivia", "group": "Team C"},
    {"id": 15, "label": "Paul", "group": "Team D"},
    {"id": 16, "label": "Quinn", "group": "Team D"},
    {"id": 17, "label": "Ryan", "group": "Team D"},
    {"id": 18, "label": "Sara", "group": "Team D"},
    {"id": 19, "label": "Tom", "group": "Team D"},
]

# Edges: friendship connections (within and between groups)
edges = [
    # Team A internal connections
    (0, 1),
    (0, 2),
    (1, 2),
    (1, 3),
    (2, 4),
    (3, 4),
    # Team B internal connections
    (5, 6),
    (5, 7),
    (6, 8),
    (7, 8),
    (7, 9),
    (8, 9),
    # Team C internal connections
    (10, 11),
    (10, 12),
    (11, 13),
    (12, 13),
    (12, 14),
    (13, 14),
    # Team D internal connections
    (15, 16),
    (15, 17),
    (16, 18),
    (17, 18),
    (17, 19),
    (18, 19),
    # Cross-group bridges between communities
    (0, 5),
    (4, 10),
    (9, 15),
    (14, 19),
    (2, 6),
    (8, 11),
    (13, 16),
    # Direct Team A <-> Team D bridges close the A-B-C-D chain into a loop,
    # which pulls the force-directed layout into a rounder shape instead of
    # stretching diagonally and leaving the opposite canvas corners empty
    (3, 17),
    (4, 15),
]

# Node degree (connection count)
n = len(nodes)
degrees = {node["id"]: 0 for node in nodes}
for src, tgt in edges:
    degrees[src] += 1
    degrees[tgt] += 1

# Force-directed (Fruchterman-Reingold) spring layout, vectorized with numpy
k = 0.4  # optimal inter-node distance
edge_src = np.array([e[0] for e in edges])
edge_tgt = np.array([e[1] for e in edges])
positions = np.random.rand(n, 2) * 2 - 1

iterations = 600
for iteration in range(iterations):
    delta = positions[:, np.newaxis, :] - positions[np.newaxis, :, :]
    dist = np.linalg.norm(delta, axis=-1)
    np.fill_diagonal(dist, np.inf)  # ignore self-repulsion
    dist = np.maximum(dist, 0.01)
    displacement = ((k * k / dist**2)[..., np.newaxis] * delta).sum(axis=1)

    edge_delta = positions[edge_src] - positions[edge_tgt]
    edge_dist = np.maximum(np.linalg.norm(edge_delta, axis=-1), 0.01)
    attraction = (edge_dist / k)[:, np.newaxis] * edge_delta
    np.add.at(displacement, edge_src, -attraction)
    np.add.at(displacement, edge_tgt, attraction)

    cooling = 1 - iteration / iterations
    disp_norm = np.linalg.norm(displacement, axis=1, keepdims=True)
    unit = np.divide(displacement, disp_norm, out=np.zeros_like(displacement), where=disp_norm > 0)
    positions += unit * np.minimum(disp_norm, 0.1 * cooling)

# Center on the bounding box (not the mean) and scale uniformly (not per-axis)
# so inter-node distances stay undistorted once drawn on the square canvas below
bbox_min, bbox_max = positions.min(axis=0), positions.max(axis=0)
positions -= (bbox_min + bbox_max) / 2
positions /= (bbox_max - bbox_min).max() / 1.7

df_nodes = pd.DataFrame(
    {
        "x": positions[:, 0],
        "y": positions[:, 1],
        "label": [node["label"] for node in nodes],
        "group": [node["group"] for node in nodes],
        "degree": [degrees[node["id"]] for node in nodes],
    }
)

# Square canvas: a force-directed layout has no preferred horizontal axis
fig, ax = plt.subplots(figsize=(6, 6), dpi=400)
ax.set_aspect("equal", adjustable="box")

# Draw edges beneath the nodes
for src, tgt in edges:
    ax.plot(
        [positions[src, 0], positions[tgt, 0]],
        [positions[src, 1], positions[tgt, 1]],
        color=INK_SOFT,
        linewidth=1.5,
        alpha=0.35,
        zorder=1,
    )

# Draw nodes with seaborn — hue for community, size for degree
sns.scatterplot(
    data=df_nodes,
    x="x",
    y="y",
    hue="group",
    hue_order=["Team A", "Team B", "Team C", "Team D"],
    size="degree",
    sizes=(190, 400),
    palette=IMPRINT_PALETTE,
    edgecolor=PAGE_BG,
    linewidth=2,
    alpha=0.95,
    legend="brief",
    ax=ax,
    zorder=2,
)

# Labels sit just below each node, so text color never clashes with the node fill
text_artists = [
    ax.text(
        row["x"],
        row["y"] - 0.09,
        row["label"],
        fontsize=10,
        fontweight="bold",
        ha="center",
        va="top",
        color=INK,
        zorder=3,
    )
    for _, row in df_nodes.iterrows()
]

title = "network-basic · python · seaborn · anyplot.ai"
ax.set_title(title, fontsize=12, fontweight="medium", color=INK)
# Fit the view tightly around the network (plus margin for nodes/labels) so the
# square canvas isn't mostly empty around an off-center force-directed layout
margin = 0.2
ax.set_xlim(positions[:, 0].min() - margin, positions[:, 0].max() + margin)
# Extra headroom on top keeps the community legend clear of the topmost node
ax.set_ylim(positions[:, 1].min() - margin - 0.09, positions[:, 1].max() + margin + 0.35)
ax.axis("off")

# Keep only the community legend entries — drop the automatic size legend
handles, labels = ax.get_legend_handles_labels()
community_names = set(df_nodes["group"])
community_handles = [h for h, lbl in zip(handles, labels, strict=False) if lbl in community_names]
community_labels = [lbl for lbl in labels if lbl in community_names]
legend = ax.legend(
    community_handles,
    community_labels,
    loc="upper left",
    fontsize=8,
    framealpha=0.95,
    title="Community",
    title_fontsize=10,
)
legend.get_frame().set_facecolor(ELEVATED_BG)
legend.get_frame().set_edgecolor(INK_SOFT)

plt.tight_layout()

# Measure the actual rendered label boxes (after the view/layout is final) and
# nudge any that collide apart horizontally — cheaper than hand-tuning offsets
# per node, and it adapts automatically if the layout places different nodes
# close together on a re-run
fig.canvas.draw()
renderer = fig.canvas.get_renderer()
inv = ax.transData.inverted()
label_boxes = [inv.transform_bbox(t.get_window_extent(renderer)) for t in text_artists]
for i in range(len(text_artists)):
    for j in range(i + 1, len(text_artists)):
        if not label_boxes[i].overlaps(label_boxes[j]):
            continue
        left, right = (i, j) if label_boxes[i].x0 < label_boxes[j].x0 else (j, i)
        overlap_x = min(label_boxes[left].x1, label_boxes[right].x1) - label_boxes[right].x0
        push = overlap_x / 2 + 0.01
        xl, yl = text_artists[left].get_position()
        xr, yr = text_artists[right].get_position()
        text_artists[left].set_position((xl - push, yl))
        text_artists[left].set_ha("right")
        text_artists[right].set_position((xr + push, yr))
        text_artists[right].set_ha("left")

plt.savefig(f"plot-{THEME}.png", dpi=400, facecolor=PAGE_BG)
Runnable source as JSON, for any HTTP client: https://api.anyplot.ai/specs/network-basic/seaborn/code. Any spec id and library id listed in llms-full.txt fit the same URL shape; every URL below is complete and callable.
{
  "spec_id": "network-basic",
  "language": "python",
  "library": "seaborn",
  "page": "https://anyplot.ai/network-basic/python/seaborn",
  "hub": "https://anyplot.ai/network-basic",
  "code_json": "https://api.anyplot.ai/specs/network-basic/seaborn/code",
  "spec_json": "https://api.anyplot.ai/specs/network-basic",
  "render_light_png": "https://storage.googleapis.com/anyplot-images/plots/network-basic/python/seaborn/plot-light.png",
  "render_dark_png": "https://storage.googleapis.com/anyplot-images/plots/network-basic/python/seaborn/plot-dark.png",
  "quality_score": 90.0,
  "license": "MIT",
  "guide": "https://anyplot.ai/llms.txt"
}
Part of Basic Network Graph on anyplot.ai.