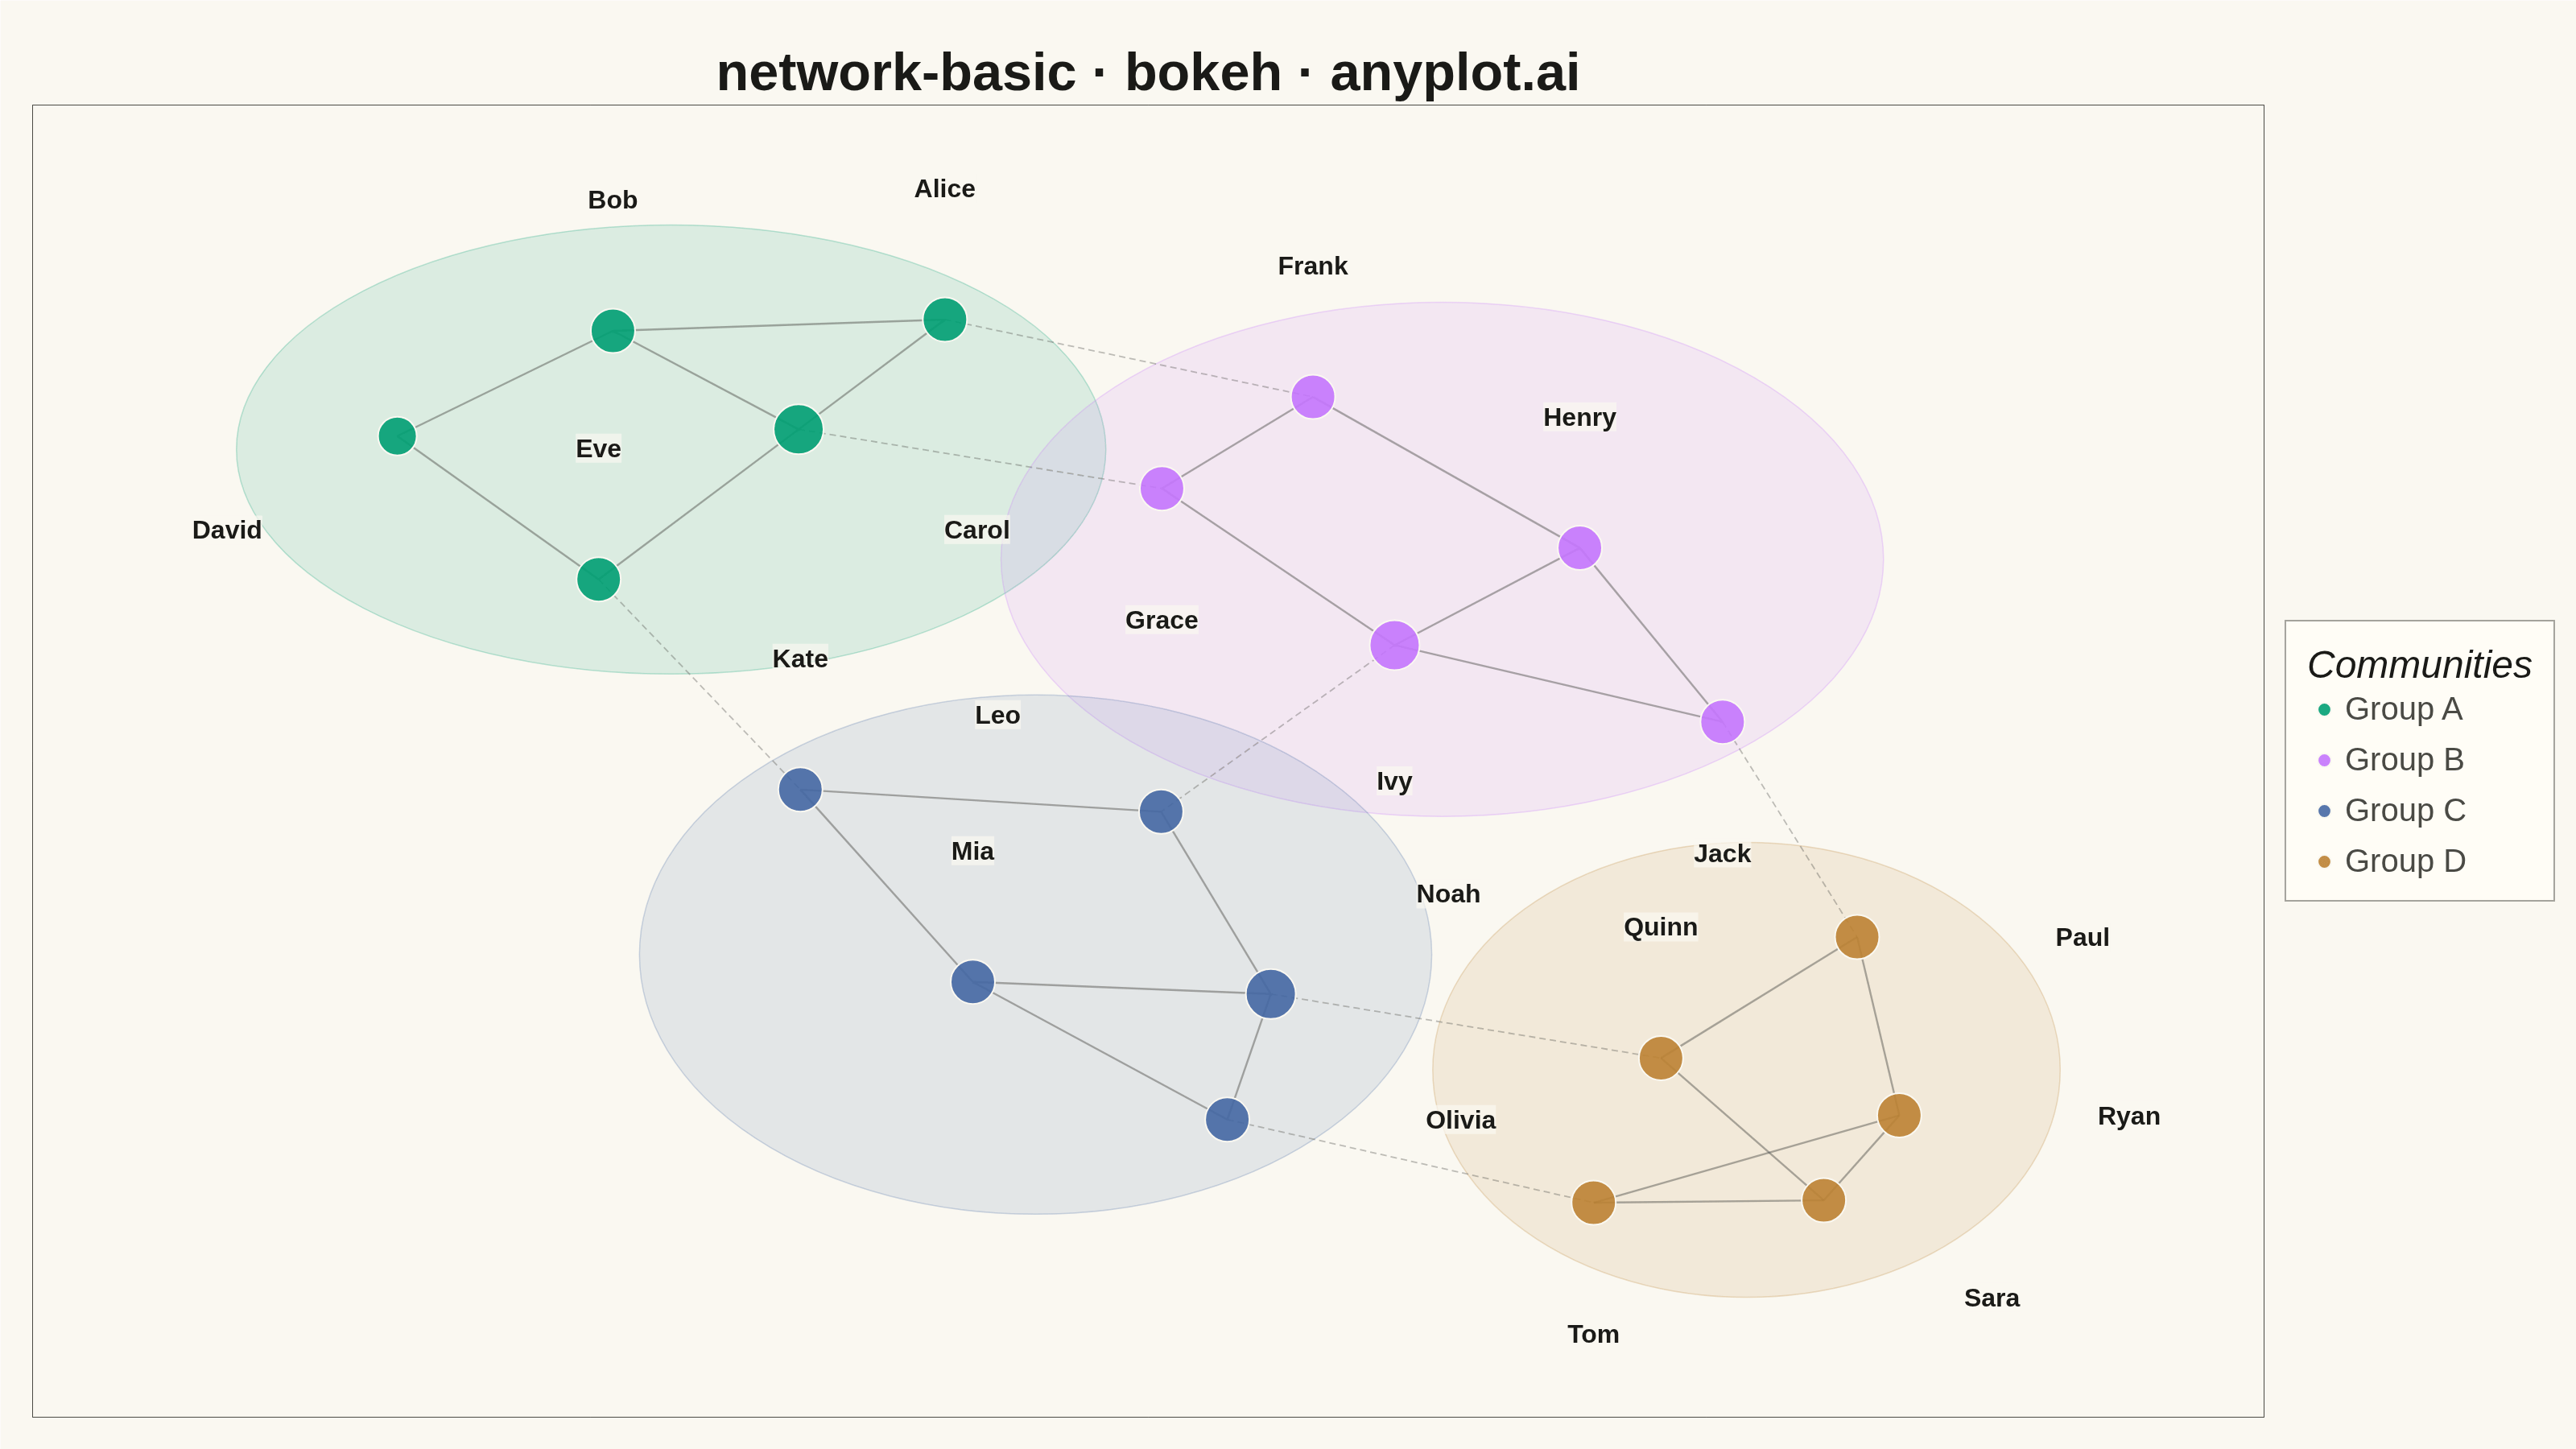
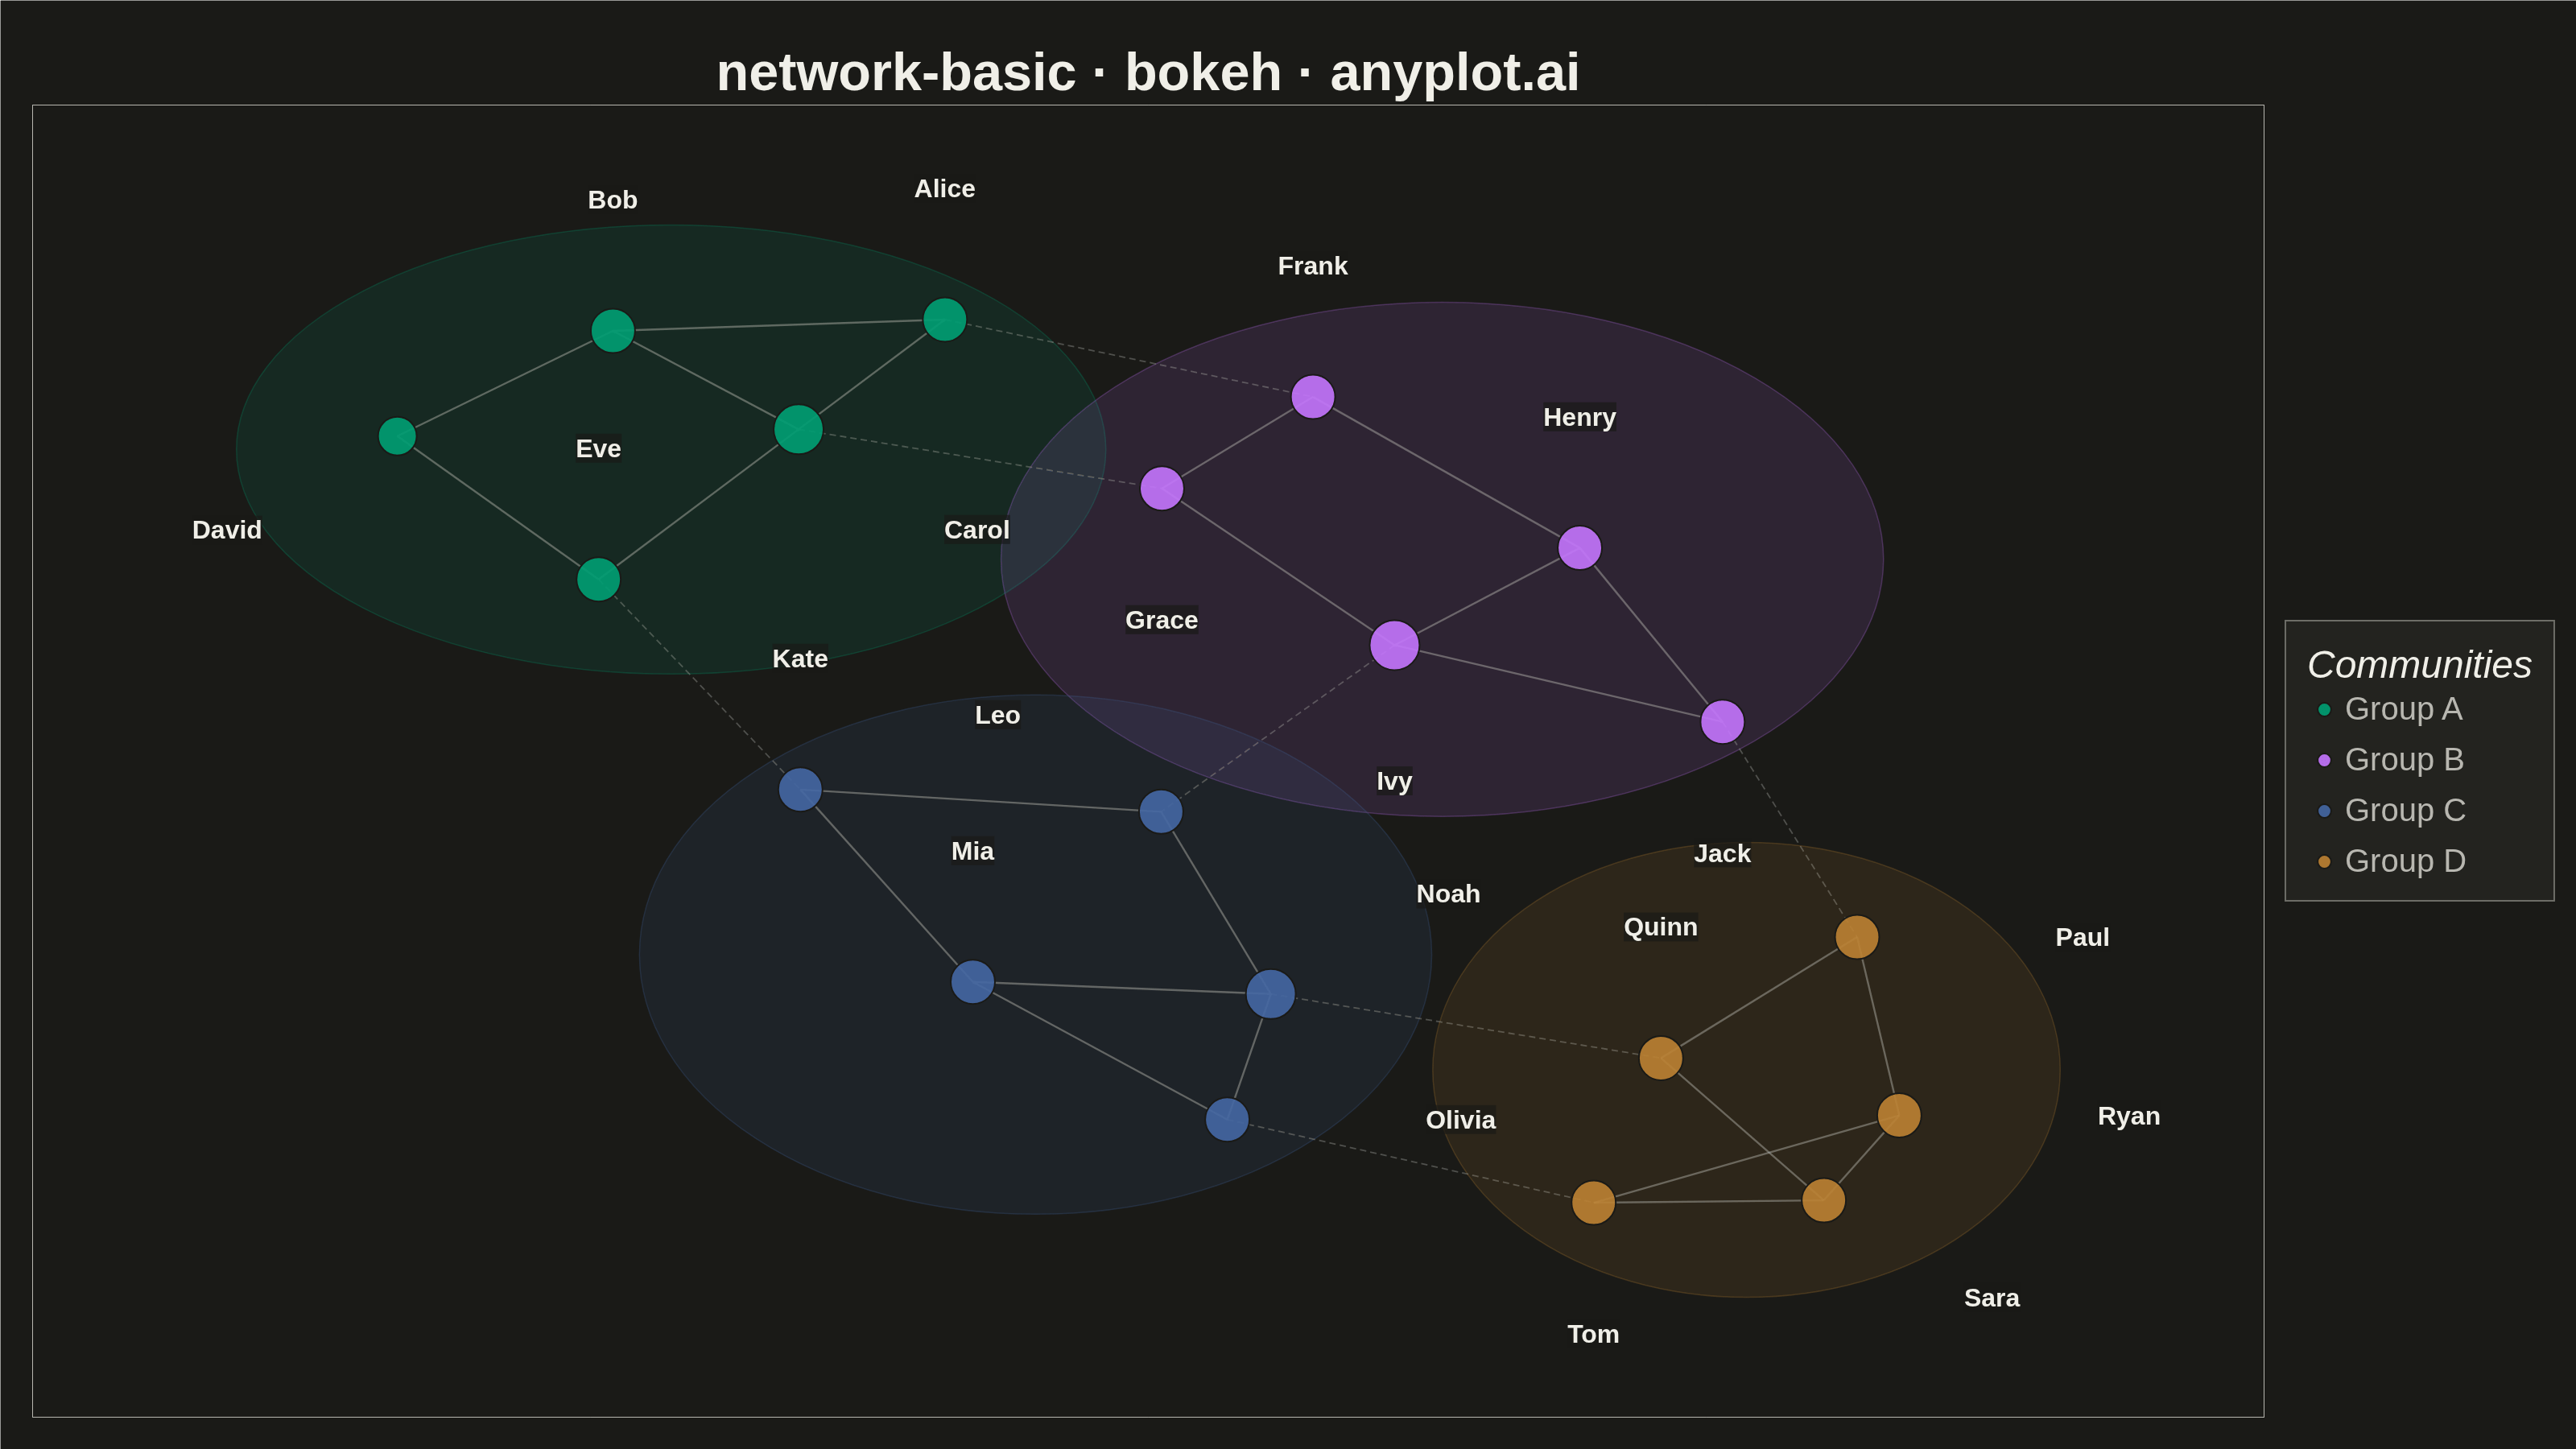
A network graph (node-link diagram) visualizes relationships between entities as nodes connected by edges. It reveals the structure of connections, clusters, and central nodes in relational data. Network graphs are essential for understanding complex systems where relationships matter as much as the entities themselves, making hidden patterns of connectivity visible at a glance.
""" anyplot.ai
network-basic: Basic Network Graph
Library: bokeh 3.9.1 | Python 3.13.14
Quality: 90/100 | Updated: 2026-07-24
"""

import os
import time
from pathlib import Path

import numpy as np
from bokeh.io import output_file, save
from bokeh.models import ColumnDataSource, HoverTool, Legend, LegendItem
from bokeh.plotting import figure
from selenium import webdriver
from selenium.webdriver.chrome.options import Options


# Theme tokens (Imprint palette — theme-adaptive chrome)
THEME = os.getenv("ANYPLOT_THEME", "light")
PAGE_BG = "#FAF8F1" if THEME == "light" else "#1A1A17"
ELEVATED_BG = "#FFFDF6" if THEME == "light" else "#242420"
INK = "#1A1A17" if THEME == "light" else "#F0EFE8"
INK_SOFT = "#4A4A44" if THEME == "light" else "#B8B7B0"

# Imprint categorical palette — first 4 positions for the 4 communities
IMPRINT = ["#009E73", "#C475FD", "#4467A3", "#BD8233"]

# Data: A small social network with 20 people in 4 friend groups
np.random.seed(42)
nodes = [
    {"id": 0, "label": "Alice", "group": 0},
    {"id": 1, "label": "Bob", "group": 0},
    {"id": 2, "label": "Carol", "group": 0},
    {"id": 3, "label": "David", "group": 0},
    {"id": 4, "label": "Eve", "group": 0},
    {"id": 5, "label": "Frank", "group": 1},
    {"id": 6, "label": "Grace", "group": 1},
    {"id": 7, "label": "Henry", "group": 1},
    {"id": 8, "label": "Ivy", "group": 1},
    {"id": 9, "label": "Jack", "group": 1},
    {"id": 10, "label": "Kate", "group": 2},
    {"id": 11, "label": "Leo", "group": 2},
    {"id": 12, "label": "Mia", "group": 2},
    {"id": 13, "label": "Noah", "group": 2},
    {"id": 14, "label": "Olivia", "group": 2},
    {"id": 15, "label": "Paul", "group": 3},
    {"id": 16, "label": "Quinn", "group": 3},
    {"id": 17, "label": "Ryan", "group": 3},
    {"id": 18, "label": "Sara", "group": 3},
    {"id": 19, "label": "Tom", "group": 3},
]

edges = [
    # Group 0 internal
    (0, 1),
    (0, 2),
    (1, 2),
    (1, 3),
    (2, 4),
    (3, 4),
    # Group 1 internal
    (5, 6),
    (5, 7),
    (6, 8),
    (7, 8),
    (7, 9),
    (8, 9),
    # Group 2 internal
    (10, 11),
    (10, 12),
    (11, 13),
    (12, 13),
    (12, 14),
    (13, 14),
    # Group 3 internal
    (15, 16),
    (15, 17),
    (16, 18),
    (17, 18),
    (17, 19),
    (18, 19),
    # Cross-group bridges
    (0, 5),
    (4, 10),
    (9, 15),
    (14, 19),
    (2, 6),
    (8, 11),
    (13, 16),
]
group_of = {node["id"]: node["group"] for node in nodes}
is_bridge = {(src, tgt): group_of[src] != group_of[tgt] for src, tgt in edges}

# Spring layout (force-directed algorithm)
n = len(nodes)
group_centers = {0: (0.35, 0.60), 1: (0.65, 0.60), 2: (0.35, 0.40), 3: (0.65, 0.40)}
positions = np.zeros((n, 2))
for i, node in enumerate(nodes):
    cx, cy = group_centers[node["group"]]
    angle = np.random.rand() * 2 * np.pi
    radius = np.random.rand() * 0.12
    positions[i] = [cx + radius * np.cos(angle), cy + radius * np.sin(angle)]

k = 0.18
for iteration in range(200):
    displacement = np.zeros((n, 2))
    for i in range(n):
        for j in range(i + 1, n):
            diff = positions[i] - positions[j]
            dist = max(np.linalg.norm(diff), 0.01)
            force = (k * k / dist) * (diff / dist)
            displacement[i] += force
            displacement[j] -= force
    for src, tgt in edges:
        diff = positions[src] - positions[tgt]
        dist = max(np.linalg.norm(diff), 0.01)
        force = (dist * dist / k) * (diff / dist)
        displacement[src] -= force
        displacement[tgt] += force
    cooling = 1 - iteration / 200
    for i in range(n):
        disp_norm = np.linalg.norm(displacement[i])
        if disp_norm > 0:
            positions[i] += (displacement[i] / disp_norm) * min(disp_norm, 0.08 * cooling)

pos_min = positions.min(axis=0)
pos_max = positions.max(axis=0)
pos_range = pos_max - pos_min + 1e-6
positions = (positions - pos_min) / pos_range * 0.70 + 0.15
pos = {node["id"]: positions[i] for i, node in enumerate(nodes)}

degrees = {node["id"]: 0 for node in nodes}
for src, tgt in edges:
    degrees[src] += 1
    degrees[tgt] += 1

group_names = ["Group A", "Group B", "Group C", "Group D"]

# Per-community hull (padded bounding ellipse around each group's nodes)
hull_pad = 0.075
hulls = []
for group_id in range(4):
    group_ids = [node["id"] for node in nodes if node["group"] == group_id]
    gx = [pos[gid][0] for gid in group_ids]
    gy = [pos[gid][1] for gid in group_ids]
    hulls.append(
        {
            "cx": (min(gx) + max(gx)) / 2,
            "cy": (min(gy) + max(gy)) / 2,
            "w": (max(gx) - min(gx)) + 2 * hull_pad,
            "h": (max(gy) - min(gy)) + 2 * hull_pad,
        }
    )

# Plot
p = figure(
    width=3200,
    height=1800,
    title="network-basic · bokeh · anyplot.ai",
    x_range=(-0.02, 1.02),
    y_range=(-0.02, 1.02),
    toolbar_location=None,  # bokeh's default toolbar adds ~30-50px above the canvas,
    # which would shrink the saved PNG below the mandated 3200x1800
    min_border_top=130,
    min_border_bottom=40,
    min_border_left=40,
    min_border_right=40,
)

# Theme-adaptive chrome
p.background_fill_color = PAGE_BG
p.border_fill_color = PAGE_BG
p.outline_line_color = INK_SOFT
p.title.text_font_size = "50pt"
p.title.align = "center"
p.title.text_color = INK
p.axis.visible = False
p.grid.visible = False

# Community hulls (soft translucent regions behind edges/nodes)
for hull, color in zip(hulls, IMPRINT, strict=True):
    p.ellipse(
        x=hull["cx"],
        y=hull["cy"],
        width=hull["w"],
        height=hull["h"],
        fill_color=color,
        fill_alpha=0.12,
        line_color=color,
        line_alpha=0.25,
        line_width=1.5,
    )

# Edges — intra-community ties are solid, cross-group bridges are dashed and
# thinner so the two connection types read as visually distinct at a glance
for src, tgt in edges:
    x0, y0 = pos[src]
    x1, y1 = pos[tgt]
    if is_bridge[(src, tgt)]:
        p.line([x0, x1], [y0, y1], line_width=1.8, line_color=INK_SOFT, line_alpha=0.35, line_dash=[8, 5])
    else:
        p.line([x0, x1], [y0, y1], line_width=2.4, line_color=INK_SOFT, line_alpha=0.45)

# Nodes by group
legend_items = []
renderers_for_hover = []
for group_id, (color, name) in enumerate(zip(IMPRINT, group_names, strict=True)):
    group_nodes = [node for node in nodes if node["group"] == group_id]
    node_x = [pos[node["id"]][0] for node in group_nodes]
    node_y = [pos[node["id"]][1] for node in group_nodes]
    node_sizes = [34 + degrees[node["id"]] * 7 for node in group_nodes]
    node_labels = [node["label"] for node in group_nodes]
    node_degrees = [degrees[node["id"]] for node in group_nodes]

    source = ColumnDataSource(
        data={"x": node_x, "y": node_y, "size": node_sizes, "label": node_labels, "connections": node_degrees}
    )
    renderer = p.scatter(
        x="x", y="y", size="size", source=source, fill_color=color, line_color=PAGE_BG, line_width=2, fill_alpha=0.9
    )
    legend_items.append(LegendItem(label=name, renderers=[renderer]))
    renderers_for_hover.append(renderer)

# Node labels: greedy 8-direction placement. Each label tries N/NE/E/SE/S/SW/W/NW
# offsets from its own node and keeps whichever direction lands farthest from every
# other node and every already-placed label — this is what actually prevents collisions
# in a force-directed layout, where a fixed "always above" or "always radial" rule still
# stacks labels wherever two nodes happen to sit close together (as bridge-region nodes do).
label_offset = 0.065
placed_labels = []
all_positions = list(pos.values())
label_order = sorted(nodes, key=lambda nd: -degrees[nd["id"]])
for node in label_order:
    x, y = pos[node["id"]]
    node_size = 34 + degrees[node["id"]] * 7
    reach = label_offset + node_size / 2000
    best_xy, best_dxdy, best_score = None, None, -1.0
    for angle_deg in (90, 135, 45, 270, 0, 180, 315, 225):
        dx, dy = np.cos(np.radians(angle_deg)), np.sin(np.radians(angle_deg))
        lx, ly = x + reach * dx, y + reach * dy
        if ly > 0.95 and dy > 0:  # keep labels from clipping the top edge under the title
            continue
        rivals = all_positions + placed_labels
        score = min(((lx - ox) ** 2 + (ly - oy) ** 2) ** 0.5 for ox, oy in rivals) if rivals else 1.0
        if score > best_score:
            best_score, best_xy, best_dxdy = score, (lx, ly), (dx, dy)
    x_label, y_label = best_xy
    dx, dy = best_dxdy
    placed_labels.append((x_label, y_label))
    align = "left" if dx > 0.25 else ("right" if dx < -0.25 else "center")
    baseline = "bottom" if dy > 0.25 else ("top" if dy < -0.25 else "middle")
    p.text(
        x=[x_label],
        y=[y_label],
        text=[node["label"]],
        text_font_size="24pt",
        text_font_style="bold",
        text_color=INK,
        text_align=align,
        text_baseline=baseline,
        background_fill_color=PAGE_BG,
        background_fill_alpha=0.7,
    )

# Hover tool
hover = HoverTool(tooltips=[("Name", "@label"), ("Connections", "@connections")], renderers=renderers_for_hover)
p.add_tools(hover)

# Legend
legend = Legend(items=legend_items, location="center", title="Communities")
legend.title_text_font_size = "36pt"
legend.title_text_color = INK
legend.label_text_font_size = "30pt"
legend.label_text_color = INK_SOFT
legend.background_fill_color = ELEVATED_BG
legend.background_fill_alpha = 0.95
legend.border_line_color = INK_SOFT
legend.border_line_width = 2
legend.padding = 26
legend.spacing = 18
legend.glyph_height = 42
legend.glyph_width = 42
legend.margin = 26
p.add_layout(legend, "right")

# Save the interactive HTML artifact
output_file(f"plot-{THEME}.html")
save(p)

# Screenshot with headless Chrome via Selenium (export_png uses snap chromedriver which fails)
# CDP setDeviceMetricsOverride forces the exact inner viewport — --window-size alone is
# consumed by browser chrome in headless mode and shrinks the rendered height.
W, H = 3200, 1800
opts = Options()
for arg in (
    "--headless=new",
    "--no-sandbox",
    "--disable-dev-shm-usage",
    "--disable-gpu",
    f"--window-size={W},{H}",
    "--hide-scrollbars",
):
    opts.add_argument(arg)
driver = webdriver.Chrome(options=opts)
driver.execute_cdp_cmd(
    "Emulation.setDeviceMetricsOverride", {"width": W, "height": H, "deviceScaleFactor": 1, "mobile": False}
)
driver.get(f"file://{Path(f'plot-{THEME}.html').resolve()}")
time.sleep(3)
driver.save_screenshot(f"plot-{THEME}.png")
driver.quit()

# Belt-and-braces: pad/crop to exact dims so the post-render gate always passes
from PIL import Image as _PILImage


_img = _PILImage.open(f"plot-{THEME}.png").convert("RGB")
if _img.size != (W, H):
    _norm = _PILImage.new("RGB", (W, H), PAGE_BG)
    _norm.paste(_img, ((W - _img.size[0]) // 2, (H - _img.size[1]) // 2))
    _norm.save(f"plot-{THEME}.png")
Runnable source as JSON, for any HTTP client: https://api.anyplot.ai/specs/network-basic/bokeh/code. Any spec id and library id listed in llms-full.txt fit the same URL shape; every URL below is complete and callable.
{
  "spec_id": "network-basic",
  "language": "python",
  "library": "bokeh",
  "page": "https://anyplot.ai/network-basic/python/bokeh",
  "hub": "https://anyplot.ai/network-basic",
  "code_json": "https://api.anyplot.ai/specs/network-basic/bokeh/code",
  "spec_json": "https://api.anyplot.ai/specs/network-basic",
  "render_light_png": "https://storage.googleapis.com/anyplot-images/plots/network-basic/python/bokeh/plot-light.png",
  "render_dark_png": "https://storage.googleapis.com/anyplot-images/plots/network-basic/python/bokeh/plot-dark.png",
  "interactive_light_html": "https://storage.googleapis.com/anyplot-images/plots/network-basic/python/bokeh/plot-light.html",
  "interactive_dark_html": "https://storage.googleapis.com/anyplot-images/plots/network-basic/python/bokeh/plot-dark.html",
  "quality_score": 90.0,
  "license": "MIT",
  "guide": "https://anyplot.ai/llms.txt"
}
Part of Basic Network Graph on anyplot.ai.