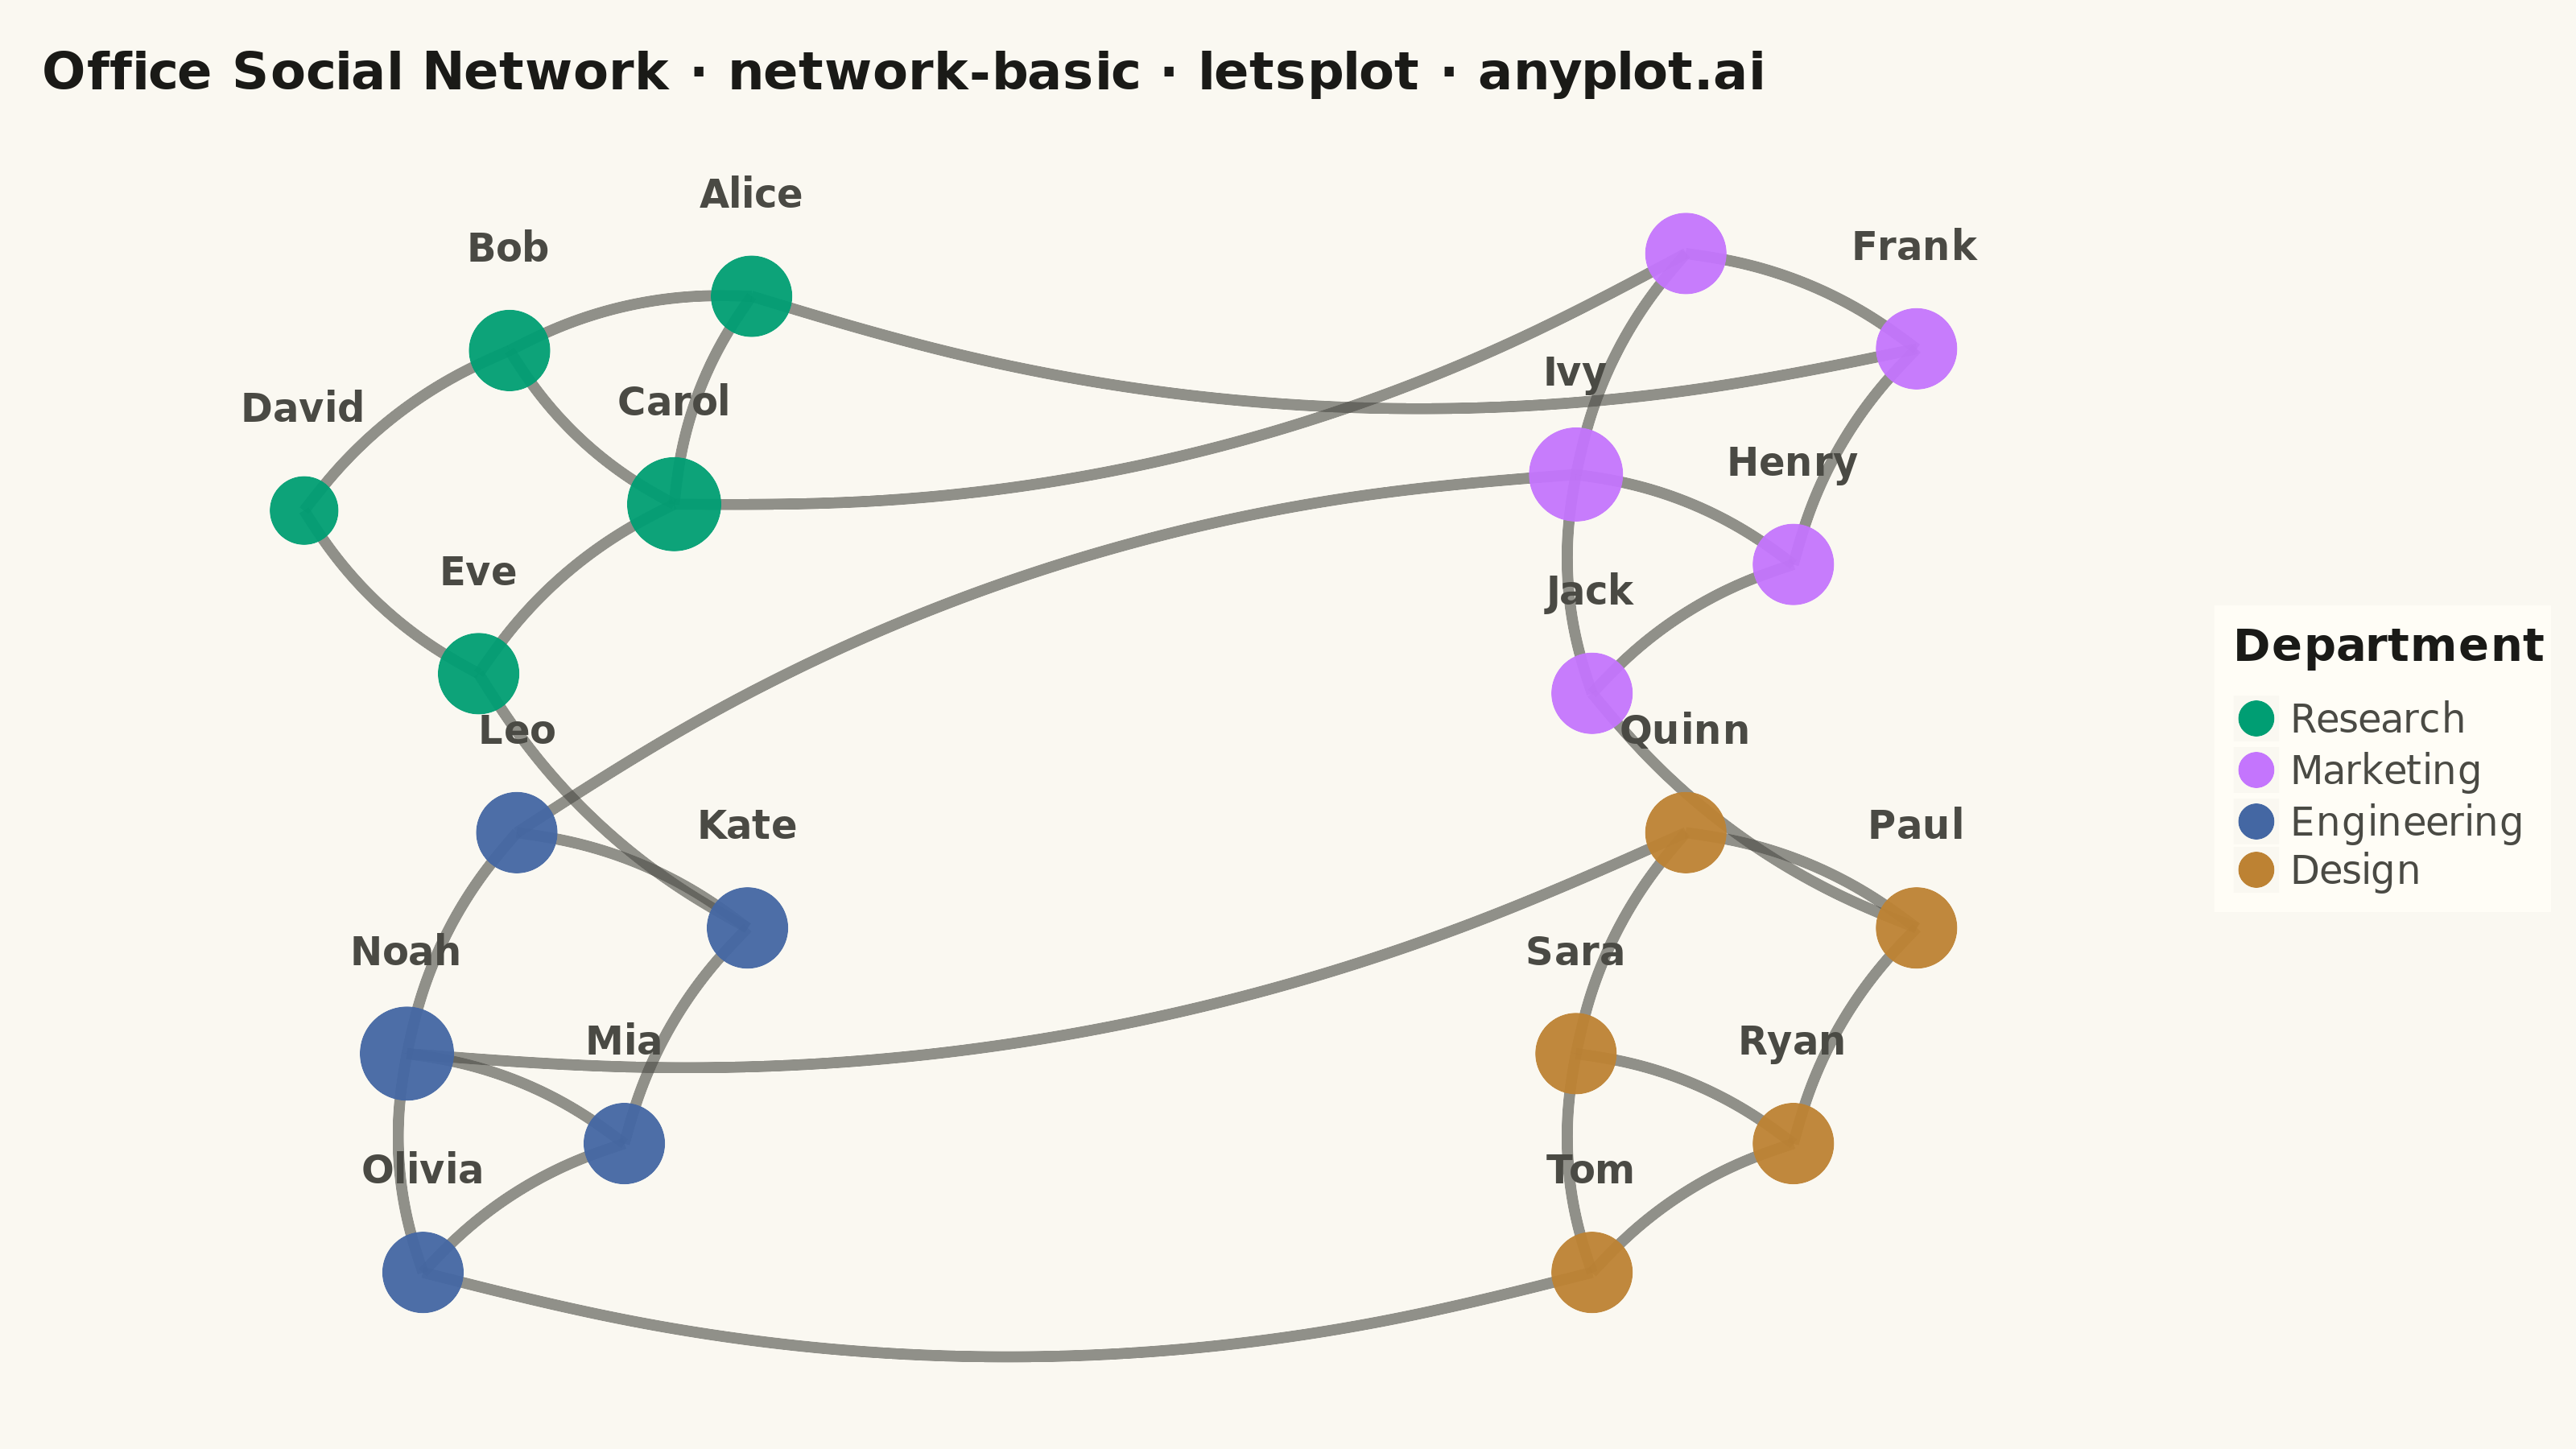
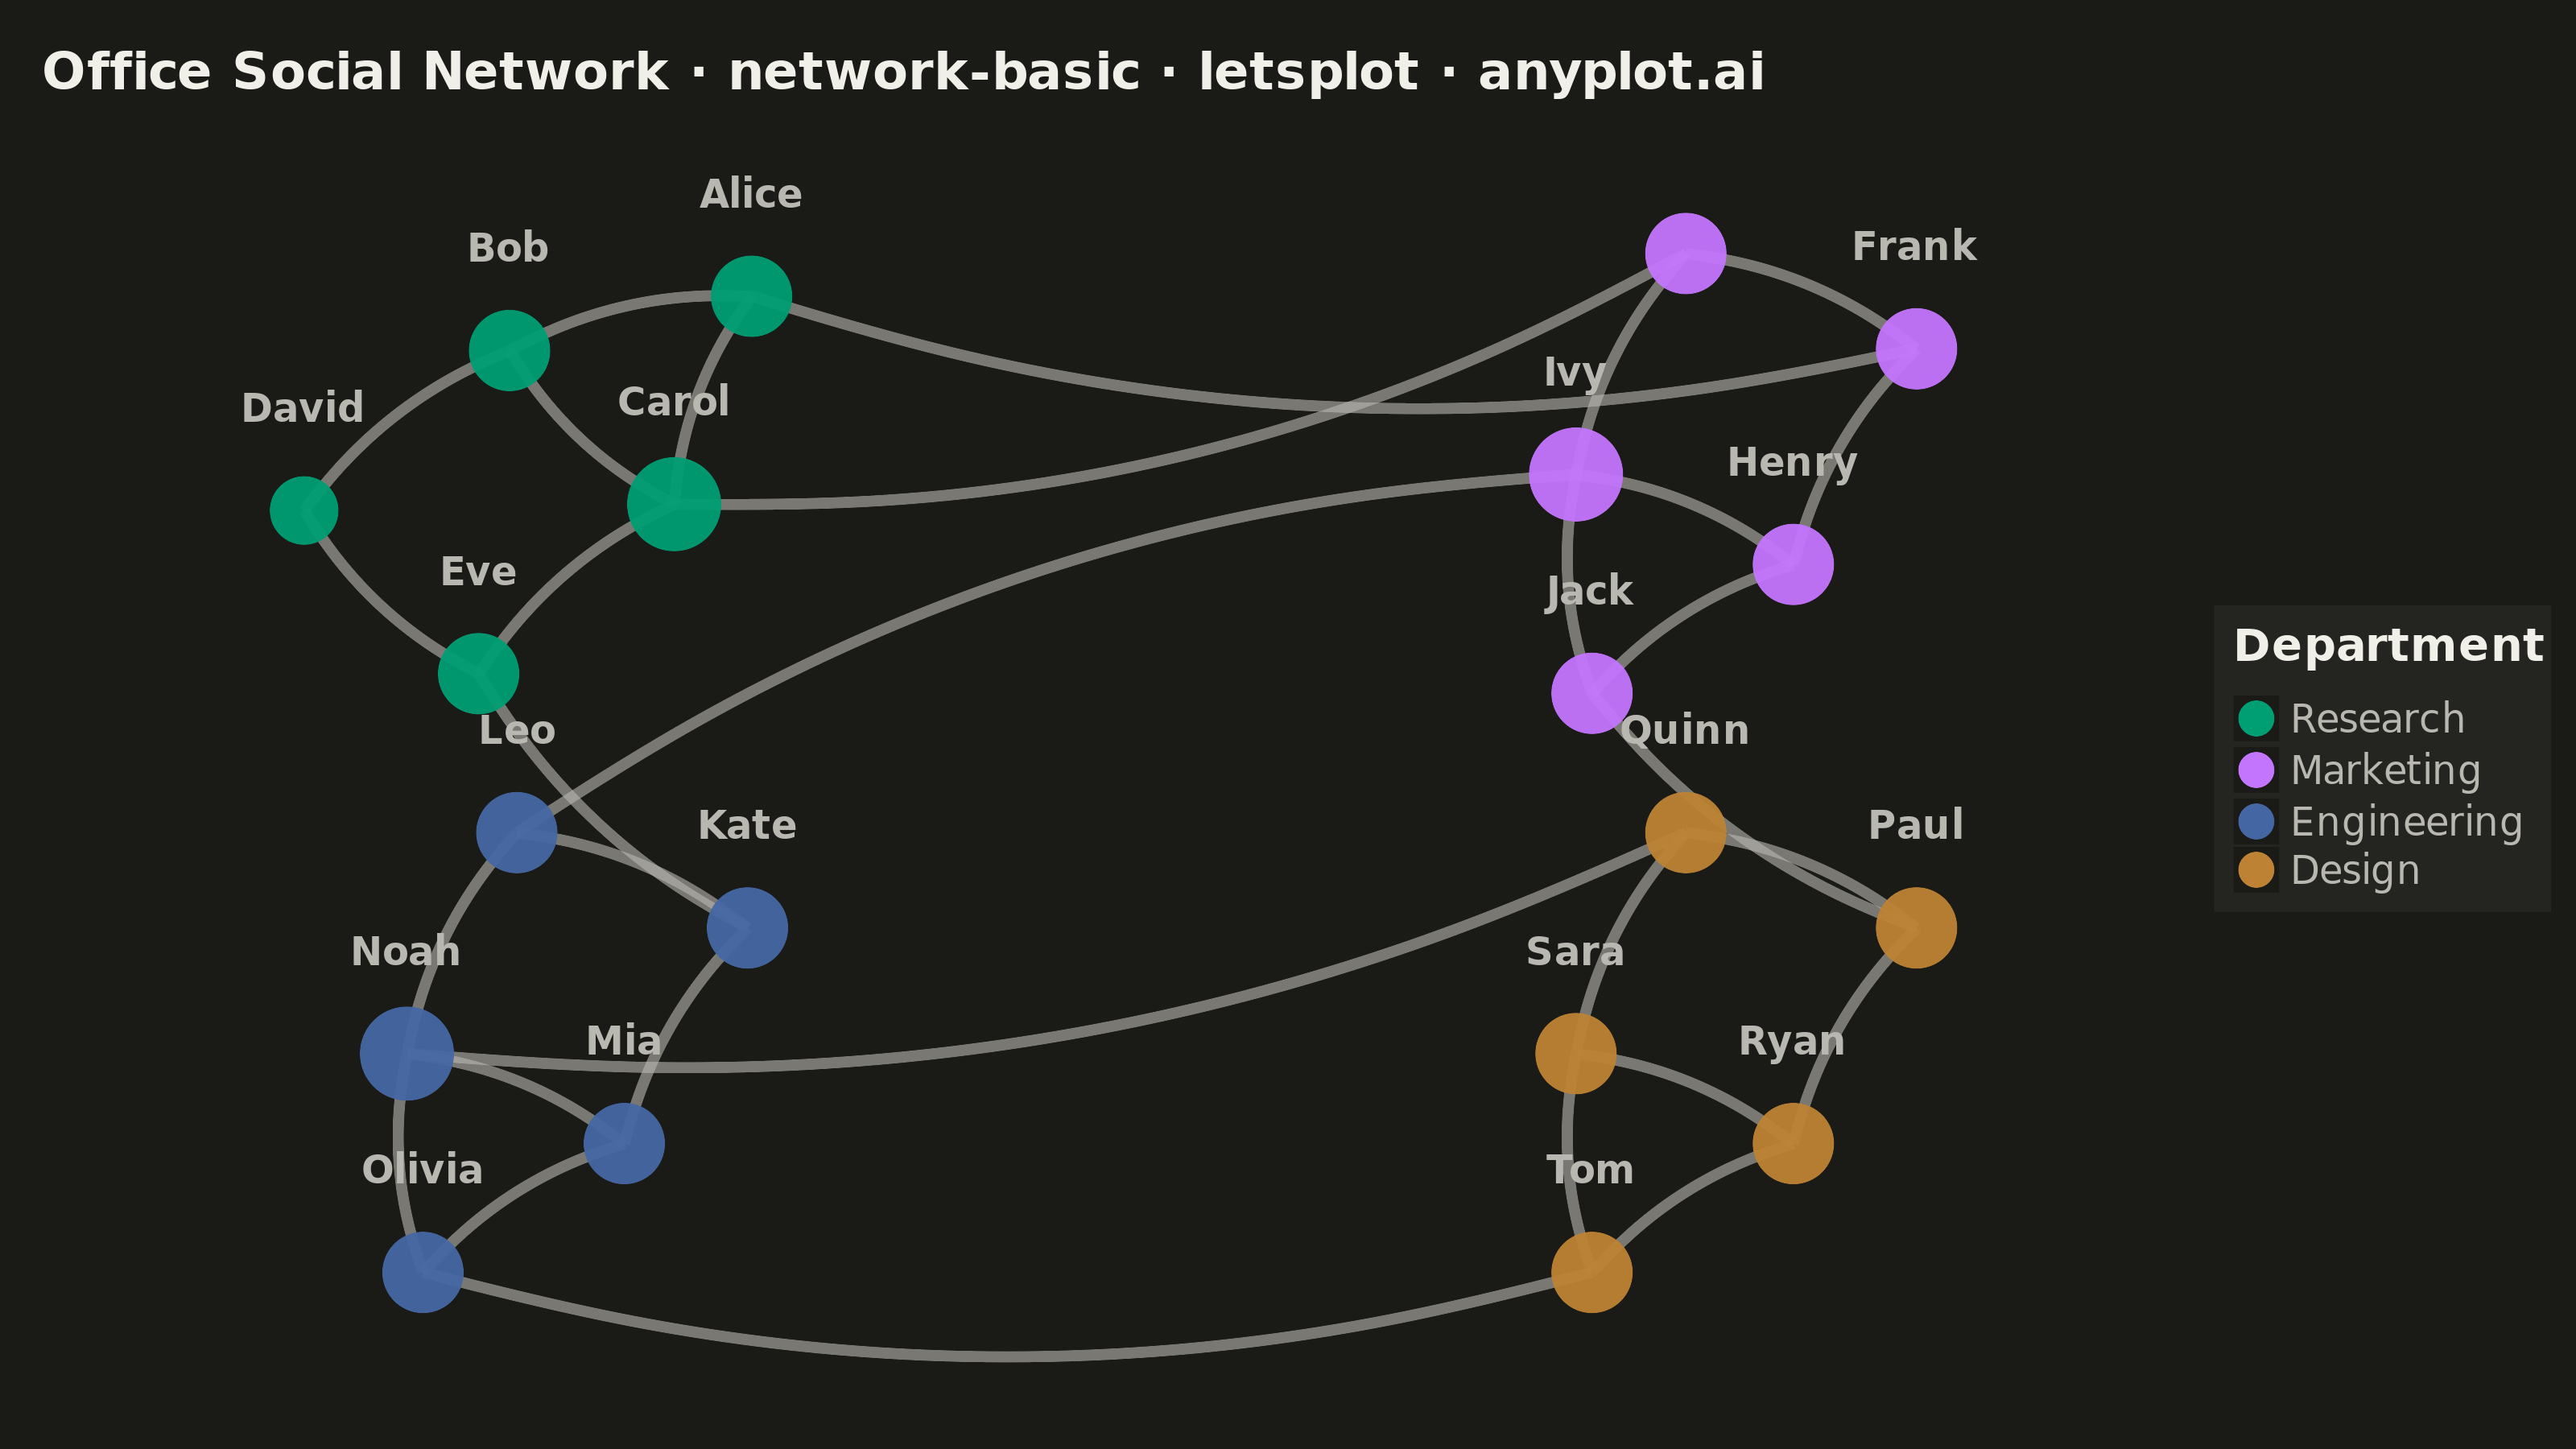
A network graph (node-link diagram) visualizes relationships between entities as nodes connected by edges. It reveals the structure of connections, clusters, and central nodes in relational data. Network graphs are essential for understanding complex systems where relationships matter as much as the entities themselves, making hidden patterns of connectivity visible at a glance.
""" anyplot.ai
network-basic: Basic Network Graph
Library: letsplot 4.11.0 | Python 3.13.14
Quality: 87/100 | Updated: 2026-07-24
"""

import os

import numpy as np
import pandas as pd
from lets_plot import (
    LetsPlot,
    aes,
    element_blank,
    element_rect,
    element_text,
    geom_curve,
    geom_point,
    geom_text,
    ggplot,
    ggsize,
    labs,
    layer_tooltips,
    scale_color_manual,
    scale_size_identity,
    scale_x_continuous,
    scale_y_continuous,
    theme,
)
from lets_plot.export import ggsave


LetsPlot.setup_html()

# Theme tokens
THEME = os.getenv("ANYPLOT_THEME", "light")
PAGE_BG = "#FAF8F1" if THEME == "light" else "#1A1A17"
ELEVATED_BG = "#FFFDF6" if THEME == "light" else "#242420"
INK = "#1A1A17" if THEME == "light" else "#F0EFE8"
INK_SOFT = "#4A4A44" if THEME == "light" else "#B8B7B0"
EDGE_COLOR = "#4A4A44" if THEME == "light" else "#B8B7B0"

# Imprint categorical palette (first series always #009E73)
IMPRINT = ["#009E73", "#C475FD", "#4467A3", "#BD8233"]

# Data: A small social network with 20 people in 4 departments
np.random.seed(42)

nodes = [
    {"id": 0, "label": "Alice", "group": 0},
    {"id": 1, "label": "Bob", "group": 0},
    {"id": 2, "label": "Carol", "group": 0},
    {"id": 3, "label": "David", "group": 0},
    {"id": 4, "label": "Eve", "group": 0},
    {"id": 5, "label": "Frank", "group": 1},
    {"id": 6, "label": "Grace", "group": 1},
    {"id": 7, "label": "Henry", "group": 1},
    {"id": 8, "label": "Ivy", "group": 1},
    {"id": 9, "label": "Jack", "group": 1},
    {"id": 10, "label": "Kate", "group": 2},
    {"id": 11, "label": "Leo", "group": 2},
    {"id": 12, "label": "Mia", "group": 2},
    {"id": 13, "label": "Noah", "group": 2},
    {"id": 14, "label": "Olivia", "group": 2},
    {"id": 15, "label": "Paul", "group": 3},
    {"id": 16, "label": "Quinn", "group": 3},
    {"id": 17, "label": "Ryan", "group": 3},
    {"id": 18, "label": "Sara", "group": 3},
    {"id": 19, "label": "Tom", "group": 3},
]

edges = [
    # Group 0 internal connections
    (0, 1),
    (0, 2),
    (1, 2),
    (1, 3),
    (2, 4),
    (3, 4),
    # Group 1 internal connections
    (5, 6),
    (5, 7),
    (6, 8),
    (7, 8),
    (7, 9),
    (8, 9),
    # Group 2 internal connections
    (10, 11),
    (10, 12),
    (11, 13),
    (12, 13),
    (12, 14),
    (13, 14),
    # Group 3 internal connections
    (15, 16),
    (15, 17),
    (16, 18),
    (17, 18),
    (17, 19),
    (18, 19),
    # Cross-group connections (bridges between communities)
    (0, 5),
    (4, 10),
    (9, 15),
    (14, 19),
    (2, 6),
    (8, 11),
    (13, 16),
]

# Layout: each group anchored to a canvas quadrant, force-directed within each group
n = len(nodes)
group_corners = {
    0: np.array([0.18, 0.77]),  # Research: top-left
    1: np.array([0.84, 0.77]),  # Marketing: top-right
    2: np.array([0.18, 0.23]),  # Engineering: bottom-left
    3: np.array([0.84, 0.23]),  # Design: bottom-right
}

# Place each group's nodes in a circle around their quadrant center
group_node_map = {g: [i for i, nd in enumerate(nodes) if nd["group"] == g] for g in range(4)}
positions = np.zeros((n, 2))
for group_id, node_indices in group_node_map.items():
    m = len(node_indices)
    center = group_corners[group_id]
    for idx, ni in enumerate(node_indices):
        angle = (idx / m) * 2 * np.pi
        positions[ni] = center + 0.14 * np.array([np.cos(angle), np.sin(angle)])

# Intra-group spring layout with centroid anchor (200 iterations)
k = 0.13
for iteration in range(200):
    displacement = np.zeros((n, 2))

    # Repulsion between same-group nodes only
    for i in range(n):
        for j in range(i + 1, n):
            if nodes[i]["group"] != nodes[j]["group"]:
                continue
            diff = positions[i] - positions[j]
            dist = max(np.linalg.norm(diff), 0.001)
            force = (k * k / dist) * (diff / dist)
            displacement[i] += force
            displacement[j] -= force

    # Attraction along intra-group edges only
    for src, tgt in edges:
        if nodes[src]["group"] != nodes[tgt]["group"]:
            continue
        diff = positions[src] - positions[tgt]
        dist = max(np.linalg.norm(diff), 0.001)
        force = (dist * dist / k) * (diff / dist)
        displacement[src] -= force
        displacement[tgt] += force

    # Strong centroid anchor keeps each group in its quadrant
    for i, node in enumerate(nodes):
        center = group_corners[node["group"]]
        displacement[i] += 0.35 * (center - positions[i])

    cooling = 1 - iteration / 200
    for i in range(n):
        disp_norm = np.linalg.norm(displacement[i])
        if disp_norm > 0:
            positions[i] += (displacement[i] / disp_norm) * min(disp_norm, 0.025 * cooling)

# The panel maps more pixels per data-unit horizontally than vertically (16:9
# canvas minus the right-hand legend column), so an isotropic spring layout
# renders each quadrant's circular cluster as a squashed ellipse. Stretch the
# vertical spread around each group's centroid to compensate, without shrinking
# the horizontal footprint that already fills the canvas width.
Y_ASPECT_COMPENSATION = 1.45
for i, node in enumerate(nodes):
    center = group_corners[node["group"]]
    positions[i][1] = center[1] + (positions[i][1] - center[1]) * Y_ASPECT_COMPENSATION

pos = {node["id"]: positions[i] for i, node in enumerate(nodes)}

# Calculate node degrees for sizing and tooltips
degrees = {node["id"]: 0 for node in nodes}
for src, tgt in edges:
    degrees[src] += 1
    degrees[tgt] += 1

group_names = ["Research", "Marketing", "Engineering", "Design"]

# Build dataframes
edge_data = []
for src, tgt in edges:
    x0, y0 = pos[src]
    x1, y1 = pos[tgt]
    edge_data.append({"x": x0, "y": y0, "xend": x1, "yend": y1})
df_edges = pd.DataFrame(edge_data)

node_data = []
for node in nodes:
    x, y = pos[node["id"]]
    degree = degrees[node["id"]]
    node_data.append(
        {
            "x": x,
            "y": y,
            "label": node["label"],
            "group": group_names[node["group"]],
            # Wider spread than a flat linear term so hub nodes (higher degree)
            # stand out as a clear focal point rather than a subtle size nudge.
            "size": 6 + degree * 1.8,
            "degree": degree,
            "label_y": y + 0.095,
        }
    )
df_nodes = pd.DataFrame(node_data)

# Plot — no coord_fixed so the network fills the full 16:9 landscape canvas
plot = (
    ggplot()
    + geom_curve(
        aes(x="x", y="y", xend="xend", yend="yend"),
        data=df_edges,
        color=EDGE_COLOR,
        size=1.5,
        alpha=0.6,
        curvature=0.15,
    )
    + geom_point(
        aes(x="x", y="y", color="group", size="size"),
        data=df_nodes,
        tooltips=layer_tooltips().line("@label").line("Department|@group").line("Connections|@degree"),
        stroke=1.5,
        alpha=0.95,
    )
    + geom_text(aes(x="x", y="label_y", label="label"), data=df_nodes, size=6, color=INK_SOFT, fontface="bold")
    + scale_color_manual(values=IMPRINT, name="Department")
    + scale_size_identity()
    + scale_x_continuous(limits=(-0.05, 1.05))
    + scale_y_continuous(limits=(-0.05, 1.05))
    + labs(title="Office Social Network · network-basic · letsplot · anyplot.ai")
    + ggsize(800, 450)
    + theme(
        plot_background=element_rect(fill=PAGE_BG, color=PAGE_BG),
        panel_background=element_rect(fill=PAGE_BG, color=PAGE_BG),
        plot_title=element_text(size=16, face="bold", color=INK),
        axis_title=element_blank(),
        axis_text=element_blank(),
        axis_ticks=element_blank(),
        axis_line=element_blank(),
        panel_grid=element_blank(),
        panel_border=element_blank(),
        legend_background=element_rect(fill=ELEVATED_BG, color=INK_SOFT),
        legend_text=element_text(size=12, color=INK_SOFT),
        legend_title=element_text(size=14, face="bold", color=INK),
        legend_position="right",
        legend_key_size=14,
        legend_spacing=4,
        legend_box_spacing=6,
        legend_margin=6,
        plot_margin=[15, 8, 10, 10],
    )
)

# Save
ggsave(plot, f"plot-{THEME}.png", path=".", scale=4)
ggsave(plot, f"plot-{THEME}.html", path=".")
Runnable source as JSON, for any HTTP client: https://api.anyplot.ai/specs/network-basic/letsplot/code. Any spec id and library id listed in llms-full.txt fit the same URL shape; every URL below is complete and callable.
{
  "spec_id": "network-basic",
  "language": "python",
  "library": "letsplot",
  "page": "https://anyplot.ai/network-basic/python/letsplot",
  "hub": "https://anyplot.ai/network-basic",
  "code_json": "https://api.anyplot.ai/specs/network-basic/letsplot/code",
  "spec_json": "https://api.anyplot.ai/specs/network-basic",
  "render_light_png": "https://storage.googleapis.com/anyplot-images/plots/network-basic/python/letsplot/plot-light.png",
  "render_dark_png": "https://storage.googleapis.com/anyplot-images/plots/network-basic/python/letsplot/plot-dark.png",
  "interactive_light_html": "https://storage.googleapis.com/anyplot-images/plots/network-basic/python/letsplot/plot-light.html",
  "interactive_dark_html": "https://storage.googleapis.com/anyplot-images/plots/network-basic/python/letsplot/plot-dark.html",
  "quality_score": 87.0,
  "license": "MIT",
  "guide": "https://anyplot.ai/llms.txt"
}
Part of Basic Network Graph on anyplot.ai.