The same plot in 14 other libraries — JavaScript: Chart.js, D3.js, Apache ECharts, MUI X Charts; Python: Altair, Bokeh, lets-plot, Matplotlib, Plotly, plotnine, Pygal, Seaborn; R: ggplot2; Julia: Makie.jl. Compare all 15 side by side: Basic Network Graph in Python, R, Julia and JavaScript.
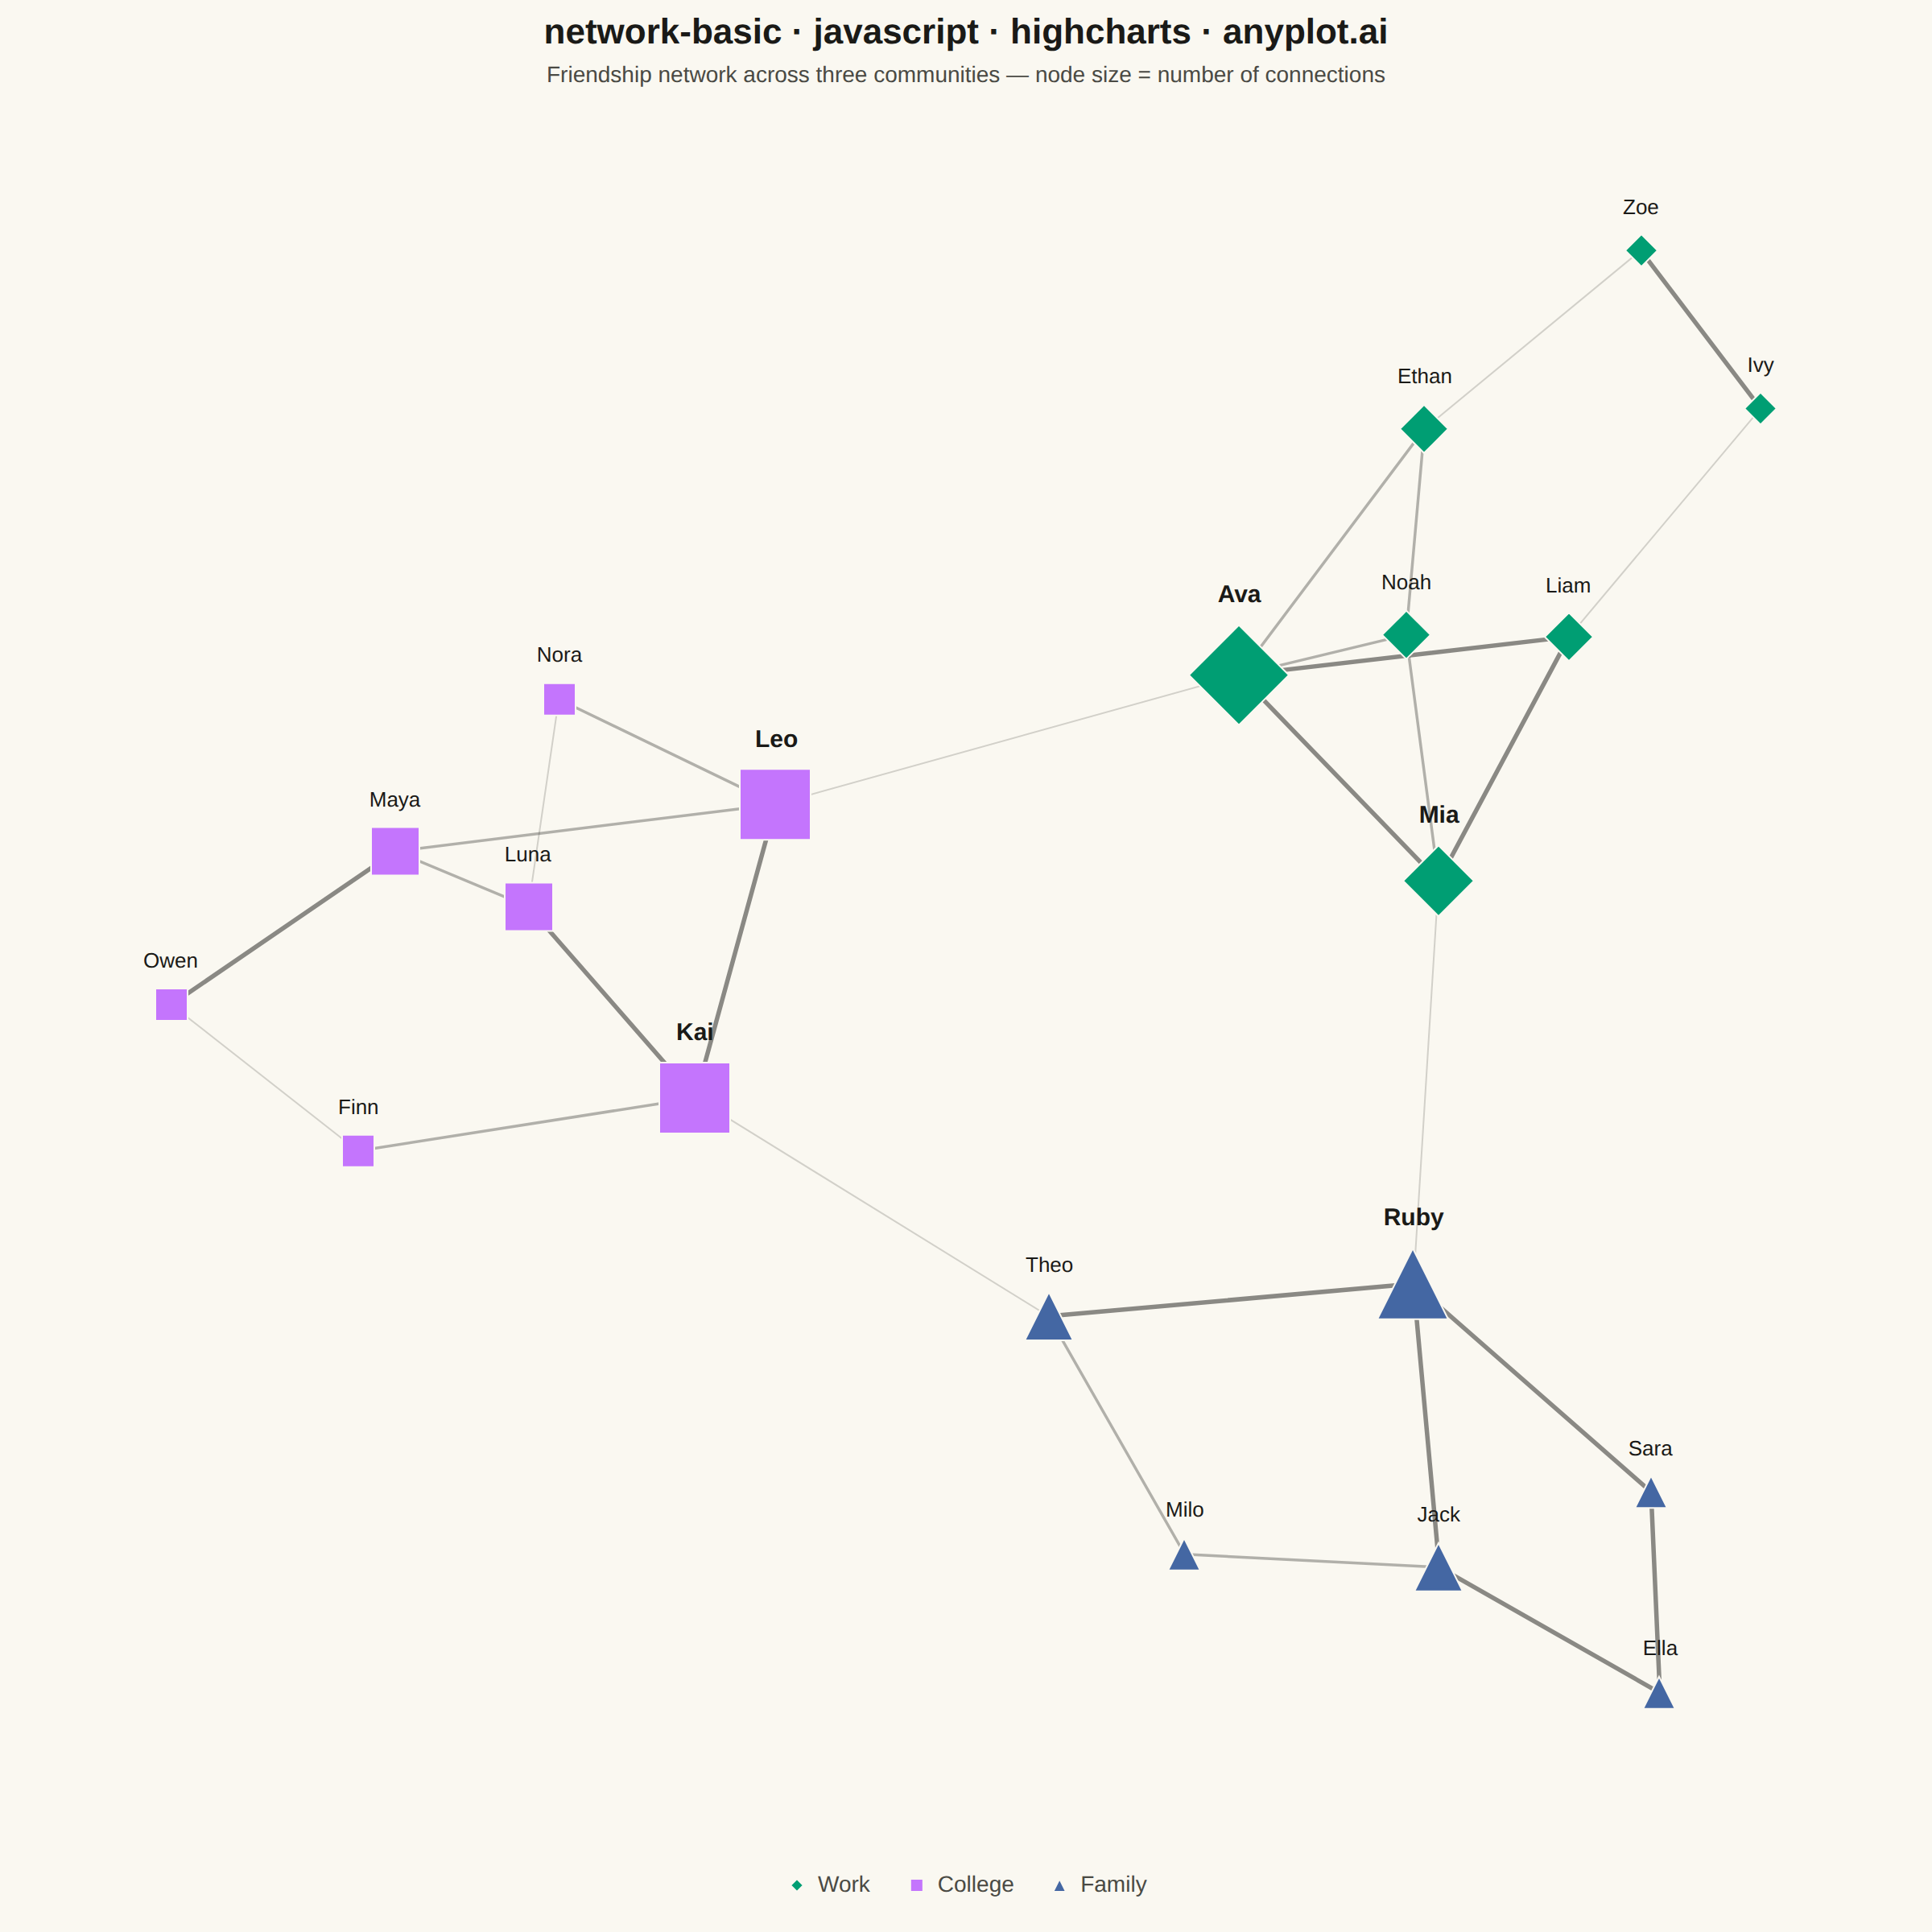
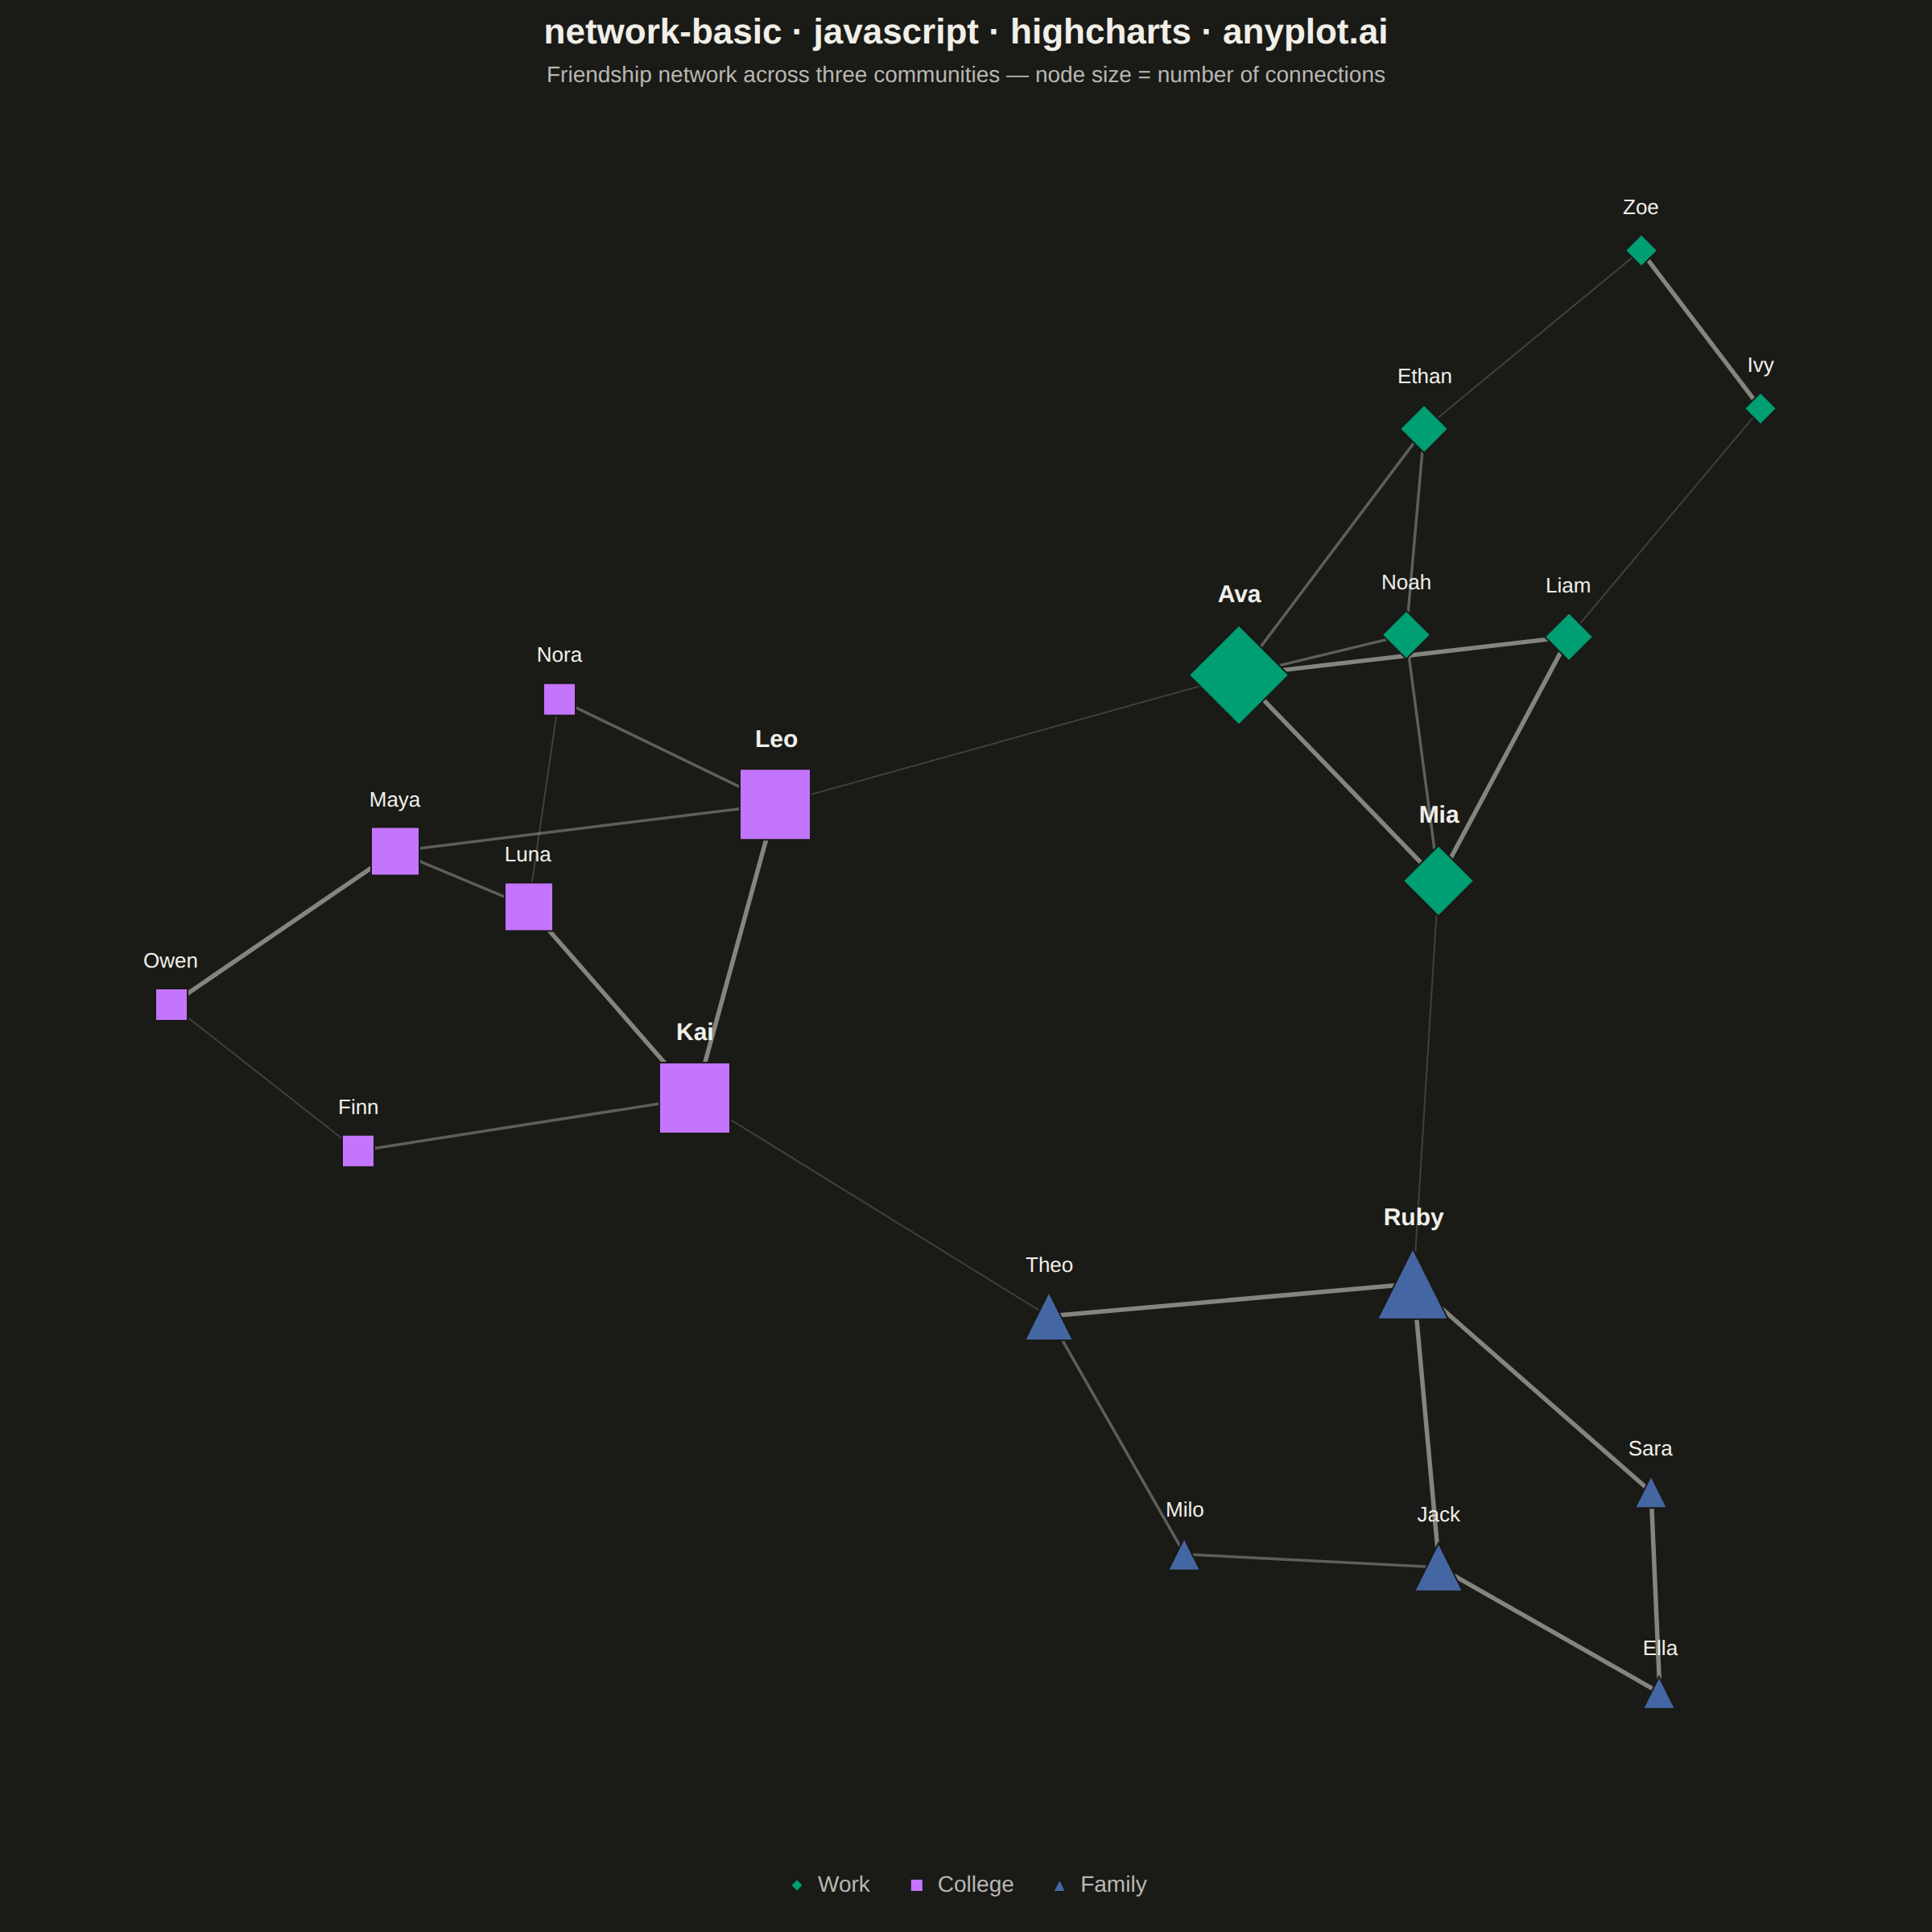
A network graph (node-link diagram) visualizes relationships between entities as nodes connected by edges. It reveals the structure of connections, clusters, and central nodes in relational data. Network graphs are essential for understanding complex systems where relationships matter as much as the entities themselves, making hidden patterns of connectivity visible at a glance.
// anyplot.ai
// network-basic: Basic Network Graph
// Library: highcharts 12.6.0 | JavaScript 22.23.1
// Quality: 90/100 | Created: 2026-07-24
//# anyplot-orientation: square

// Only the core Highcharts bundle is loaded (no `networkgraph` module), so node
// positions are computed here with a Fruchterman-Reingold force-directed layout
// and drawn as a `line` series (edges) plus per-community `scatter` series
// (nodes) — the same approach anyone would take without the add-on module.
const t = window.ANYPLOT_TOKENS;

// --- Data: a small friendship network across three communities -------------
const NODES = [
  { id: "Ava", group: "Work" },
  { id: "Liam", group: "Work" },
  { id: "Mia", group: "Work" },
  { id: "Noah", group: "Work" },
  { id: "Ivy", group: "Work" },
  { id: "Ethan", group: "Work" },
  { id: "Zoe", group: "Work" },
  { id: "Leo", group: "College" },
  { id: "Nora", group: "College" },
  { id: "Kai", group: "College" },
  { id: "Luna", group: "College" },
  { id: "Finn", group: "College" },
  { id: "Maya", group: "College" },
  { id: "Owen", group: "College" },
  { id: "Ruby", group: "Family" },
  { id: "Theo", group: "Family" },
  { id: "Sara", group: "Family" },
  { id: "Milo", group: "Family" },
  { id: "Ella", group: "Family" },
  { id: "Jack", group: "Family" },
];

// Third element is tie strength (1-5) — bridge edges between communities are
// weak acquaintance ties, within-community edges skew toward closer bonds.
const EDGES = [
  ["Ava", "Liam", 4], ["Ava", "Mia", 5], ["Ava", "Noah", 3], ["Liam", "Mia", 4], ["Liam", "Ivy", 2],
  ["Mia", "Noah", 3], ["Noah", "Ethan", 3], ["Ivy", "Zoe", 4], ["Ethan", "Zoe", 2], ["Ava", "Ethan", 3],
  ["Leo", "Nora", 3], ["Leo", "Kai", 5], ["Nora", "Luna", 2], ["Kai", "Luna", 4], ["Kai", "Finn", 3],
  ["Luna", "Maya", 3], ["Finn", "Owen", 2], ["Maya", "Owen", 4], ["Leo", "Maya", 3],
  ["Ruby", "Theo", 5], ["Ruby", "Sara", 4], ["Theo", "Milo", 3], ["Sara", "Ella", 4], ["Milo", "Jack", 3],
  ["Ella", "Jack", 5], ["Ruby", "Jack", 4],
  ["Ava", "Leo", 1], ["Mia", "Ruby", 2], ["Kai", "Theo", 1],
];

// Degree (connection count) drives node size.
const degree = {};
NODES.forEach((node) => { degree[node.id] = 0; });
EDGES.forEach(([a, b]) => { degree[a] += 1; degree[b] += 1; });
const maxDegree = Math.max(...Object.values(degree));

// --- Force-directed layout (Fruchterman-Reingold, fixed-seed LCG) ----------
let seed = 42;
function rand() {
  seed = (seed * 1103515245 + 12345) & 0x7fffffff;
  return seed / 0x7fffffff;
}

const AREA = 100;
const idealDistance = Math.sqrt((AREA * AREA) / NODES.length);
const pos = {};
NODES.forEach((node, i) => {
  const angle = (i / NODES.length) * 2 * Math.PI;
  pos[node.id] = {
    x: 40 * Math.cos(angle) + (rand() - 0.5) * 6,
    y: 40 * Math.sin(angle) + (rand() - 0.5) * 6,
  };
});

let temperature = AREA / 10;
for (let iter = 0; iter < 300; iter += 1) {
  const disp = {};
  NODES.forEach((node) => { disp[node.id] = { x: 0, y: 0 }; });

  for (let i = 0; i < NODES.length; i += 1) {
    for (let j = i + 1; j < NODES.length; j += 1) {
      const a = NODES[i].id;
      const b = NODES[j].id;
      const dx = pos[a].x - pos[b].x;
      const dy = pos[a].y - pos[b].y;
      const dist = Math.max(Math.sqrt(dx * dx + dy * dy), 0.01);
      const force = (idealDistance * idealDistance) / dist;
      disp[a].x += (dx / dist) * force;
      disp[a].y += (dy / dist) * force;
      disp[b].x -= (dx / dist) * force;
      disp[b].y -= (dy / dist) * force;
    }
  }

  EDGES.forEach(([a, b]) => {
    const dx = pos[a].x - pos[b].x;
    const dy = pos[a].y - pos[b].y;
    const dist = Math.max(Math.sqrt(dx * dx + dy * dy), 0.01);
    const force = (dist * dist) / idealDistance;
    disp[a].x -= (dx / dist) * force;
    disp[a].y -= (dy / dist) * force;
    disp[b].x += (dx / dist) * force;
    disp[b].y += (dy / dist) * force;
  });

  NODES.forEach((node) => {
    const dx = disp[node.id].x;
    const dy = disp[node.id].y;
    const dist = Math.max(Math.sqrt(dx * dx + dy * dy), 0.01);
    const capped = Math.min(dist, temperature);
    pos[node.id].x += (dx / dist) * capped;
    pos[node.id].y += (dy / dist) * capped;
  });
  temperature *= 0.97;
}

// Normalize the free-floating layout into a fixed, centered frame — the
// repulsion/attraction forces above have no boundary, so raw coordinates can
// land anywhere; rescale to a known extent before drawing.
let minX = Infinity;
let maxX = -Infinity;
let minY = Infinity;
let maxY = -Infinity;
NODES.forEach((node) => {
  minX = Math.min(minX, pos[node.id].x);
  maxX = Math.max(maxX, pos[node.id].x);
  minY = Math.min(minY, pos[node.id].y);
  maxY = Math.max(maxY, pos[node.id].y);
});
const centerX = (minX + maxX) / 2;
const centerY = (minY + maxY) / 2;
const halfExtent = Math.max(maxX - minX, maxY - minY) / 2;
NODES.forEach((node) => {
  pos[node.id].x = ((pos[node.id].x - centerX) / halfExtent) * 50;
  pos[node.id].y = ((pos[node.id].y - centerY) / halfExtent) * 50;
});

// --- Chart -------------------------------------------------------------------
const GROUPS = ["Work", "College", "Family"];
const GROUP_COLOR = { Work: t.palette[0], College: t.palette[1], Family: t.palette[2] };
// Deliberate per-group marker shapes (not left to Highcharts' default symbol
// cycling) — a second, colorblind-safe channel redundant with community color.
const GROUP_SYMBOL = { Work: "diamond", College: "square", Family: "triangle" };
// Hub threshold: nodes in the top degree band get bolder, larger labels — a
// per-point dataLabels override, a distinctly Highcharts (not library-agnostic)
// way to spotlight structurally important nodes without a second series.
const HUB_DEGREE = maxDegree - 1;

// Node radius uses a squared term on degree so hub nodes create a clear focal
// point instead of blending into the leaf nodes.
function nodeRadius(id) {
  return 6 + degree[id] ** 2;
}

// Tie-strength tiers (weak/medium/strong) become three separate edge series so
// lineWidth + opacity can vary by weight — a plain single "line" series can't
// vary per-segment, so splitting by tier is the idiomatic Highcharts route.
const EDGE_TIERS = [
  { key: "weak", test: (w) => w <= 2, lineWidth: 1, alpha: 0.18 },
  { key: "medium", test: (w) => w === 3, lineWidth: 1.75, alpha: 0.32 },
  { key: "strong", test: (w) => w >= 4, lineWidth: 2.75, alpha: 0.5 },
];

const edgeSeries = EDGE_TIERS.map((tier) => {
  const data = [];
  EDGES.filter(([, , w]) => tier.test(w)).forEach(([a, b]) => {
    data.push([pos[a].x, pos[a].y]);
    data.push([pos[b].x, pos[b].y]);
    data.push(null);
  });
  return {
    type: "line",
    name: `Connections (${tier.key})`,
    data,
    color: t.grid.replace(/[\d.]+\)$/, `${tier.alpha})`),
    lineWidth: tier.lineWidth,
    marker: { enabled: false },
    enableMouseTracking: false,
    showInLegend: false,
    zIndex: 0,
  };
});

const nodeSeries = GROUPS.map((group) => ({
  type: "scatter",
  name: group,
  color: GROUP_COLOR[group],
  marker: { symbol: GROUP_SYMBOL[group], lineColor: t.pageBg, lineWidth: 1 },
  data: NODES.filter((node) => node.group === group).map((node) => {
    const radius = nodeRadius(node.id);
    const isHub = degree[node.id] >= HUB_DEGREE;
    return {
      x: pos[node.id].x,
      y: pos[node.id].y,
      name: node.id,
      marker: { radius },
      dataLabels: {
        y: -(radius + 6),
        style: {
          fontSize: isHub ? "15px" : "13px",
          fontWeight: isHub ? "700" : "normal",
        },
      },
    };
  }),
  dataLabels: {
    enabled: true,
    format: "{point.name}",
    allowOverlap: false,
    style: { color: t.ink, fontWeight: "normal", textOutline: "none" },
  },
}));

Highcharts.chart("container", {
  chart: {
    backgroundColor: "transparent",
    animation: false,
    style: { fontFamily: "inherit" },
  },
  credits: { enabled: false },
  title: {
    text: "network-basic · javascript · highcharts · anyplot.ai",
    style: { color: t.ink, fontSize: "22px", fontWeight: "600" },
  },
  subtitle: {
    text: "Friendship network across three communities — node size = number of connections",
    style: { color: t.inkSoft, fontSize: "14px" },
  },
  xAxis: { visible: false, min: -58, max: 58 },
  yAxis: { visible: false, min: -58, max: 58, title: { text: null } },
  legend: {
    enabled: true,
    itemStyle: { color: t.inkSoft, fontSize: "14px" },
    itemHoverStyle: { color: t.ink },
  },
  tooltip: { enabled: false },
  plotOptions: {
    series: { animation: false },
    scatter: { states: { hover: { enabled: false } } },
  },
  series: [...edgeSeries, ...nodeSeries],
});
Runnable source as JSON, for any HTTP client: https://api.anyplot.ai/specs/network-basic/highcharts/code. Any spec id and library id listed in llms-full.txt fit the same URL shape; every URL below is complete and callable.
{
  "spec_id": "network-basic",
  "language": "javascript",
  "library": "highcharts",
  "page": "https://anyplot.ai/network-basic/javascript/highcharts",
  "hub": "https://anyplot.ai/network-basic",
  "code_json": "https://api.anyplot.ai/specs/network-basic/highcharts/code",
  "spec_json": "https://api.anyplot.ai/specs/network-basic",
  "render_light_png": "https://storage.googleapis.com/anyplot-images/plots/network-basic/javascript/highcharts/plot-light.png",
  "render_dark_png": "https://storage.googleapis.com/anyplot-images/plots/network-basic/javascript/highcharts/plot-dark.png",
  "interactive_light_html": "https://storage.googleapis.com/anyplot-images/plots/network-basic/javascript/highcharts/plot-light.html",
  "interactive_dark_html": "https://storage.googleapis.com/anyplot-images/plots/network-basic/javascript/highcharts/plot-dark.html",
  "quality_score": 90.0,
  "license": "MIT",
  "guide": "https://anyplot.ai/llms.txt"
}
Part of Basic Network Graph on anyplot.ai.