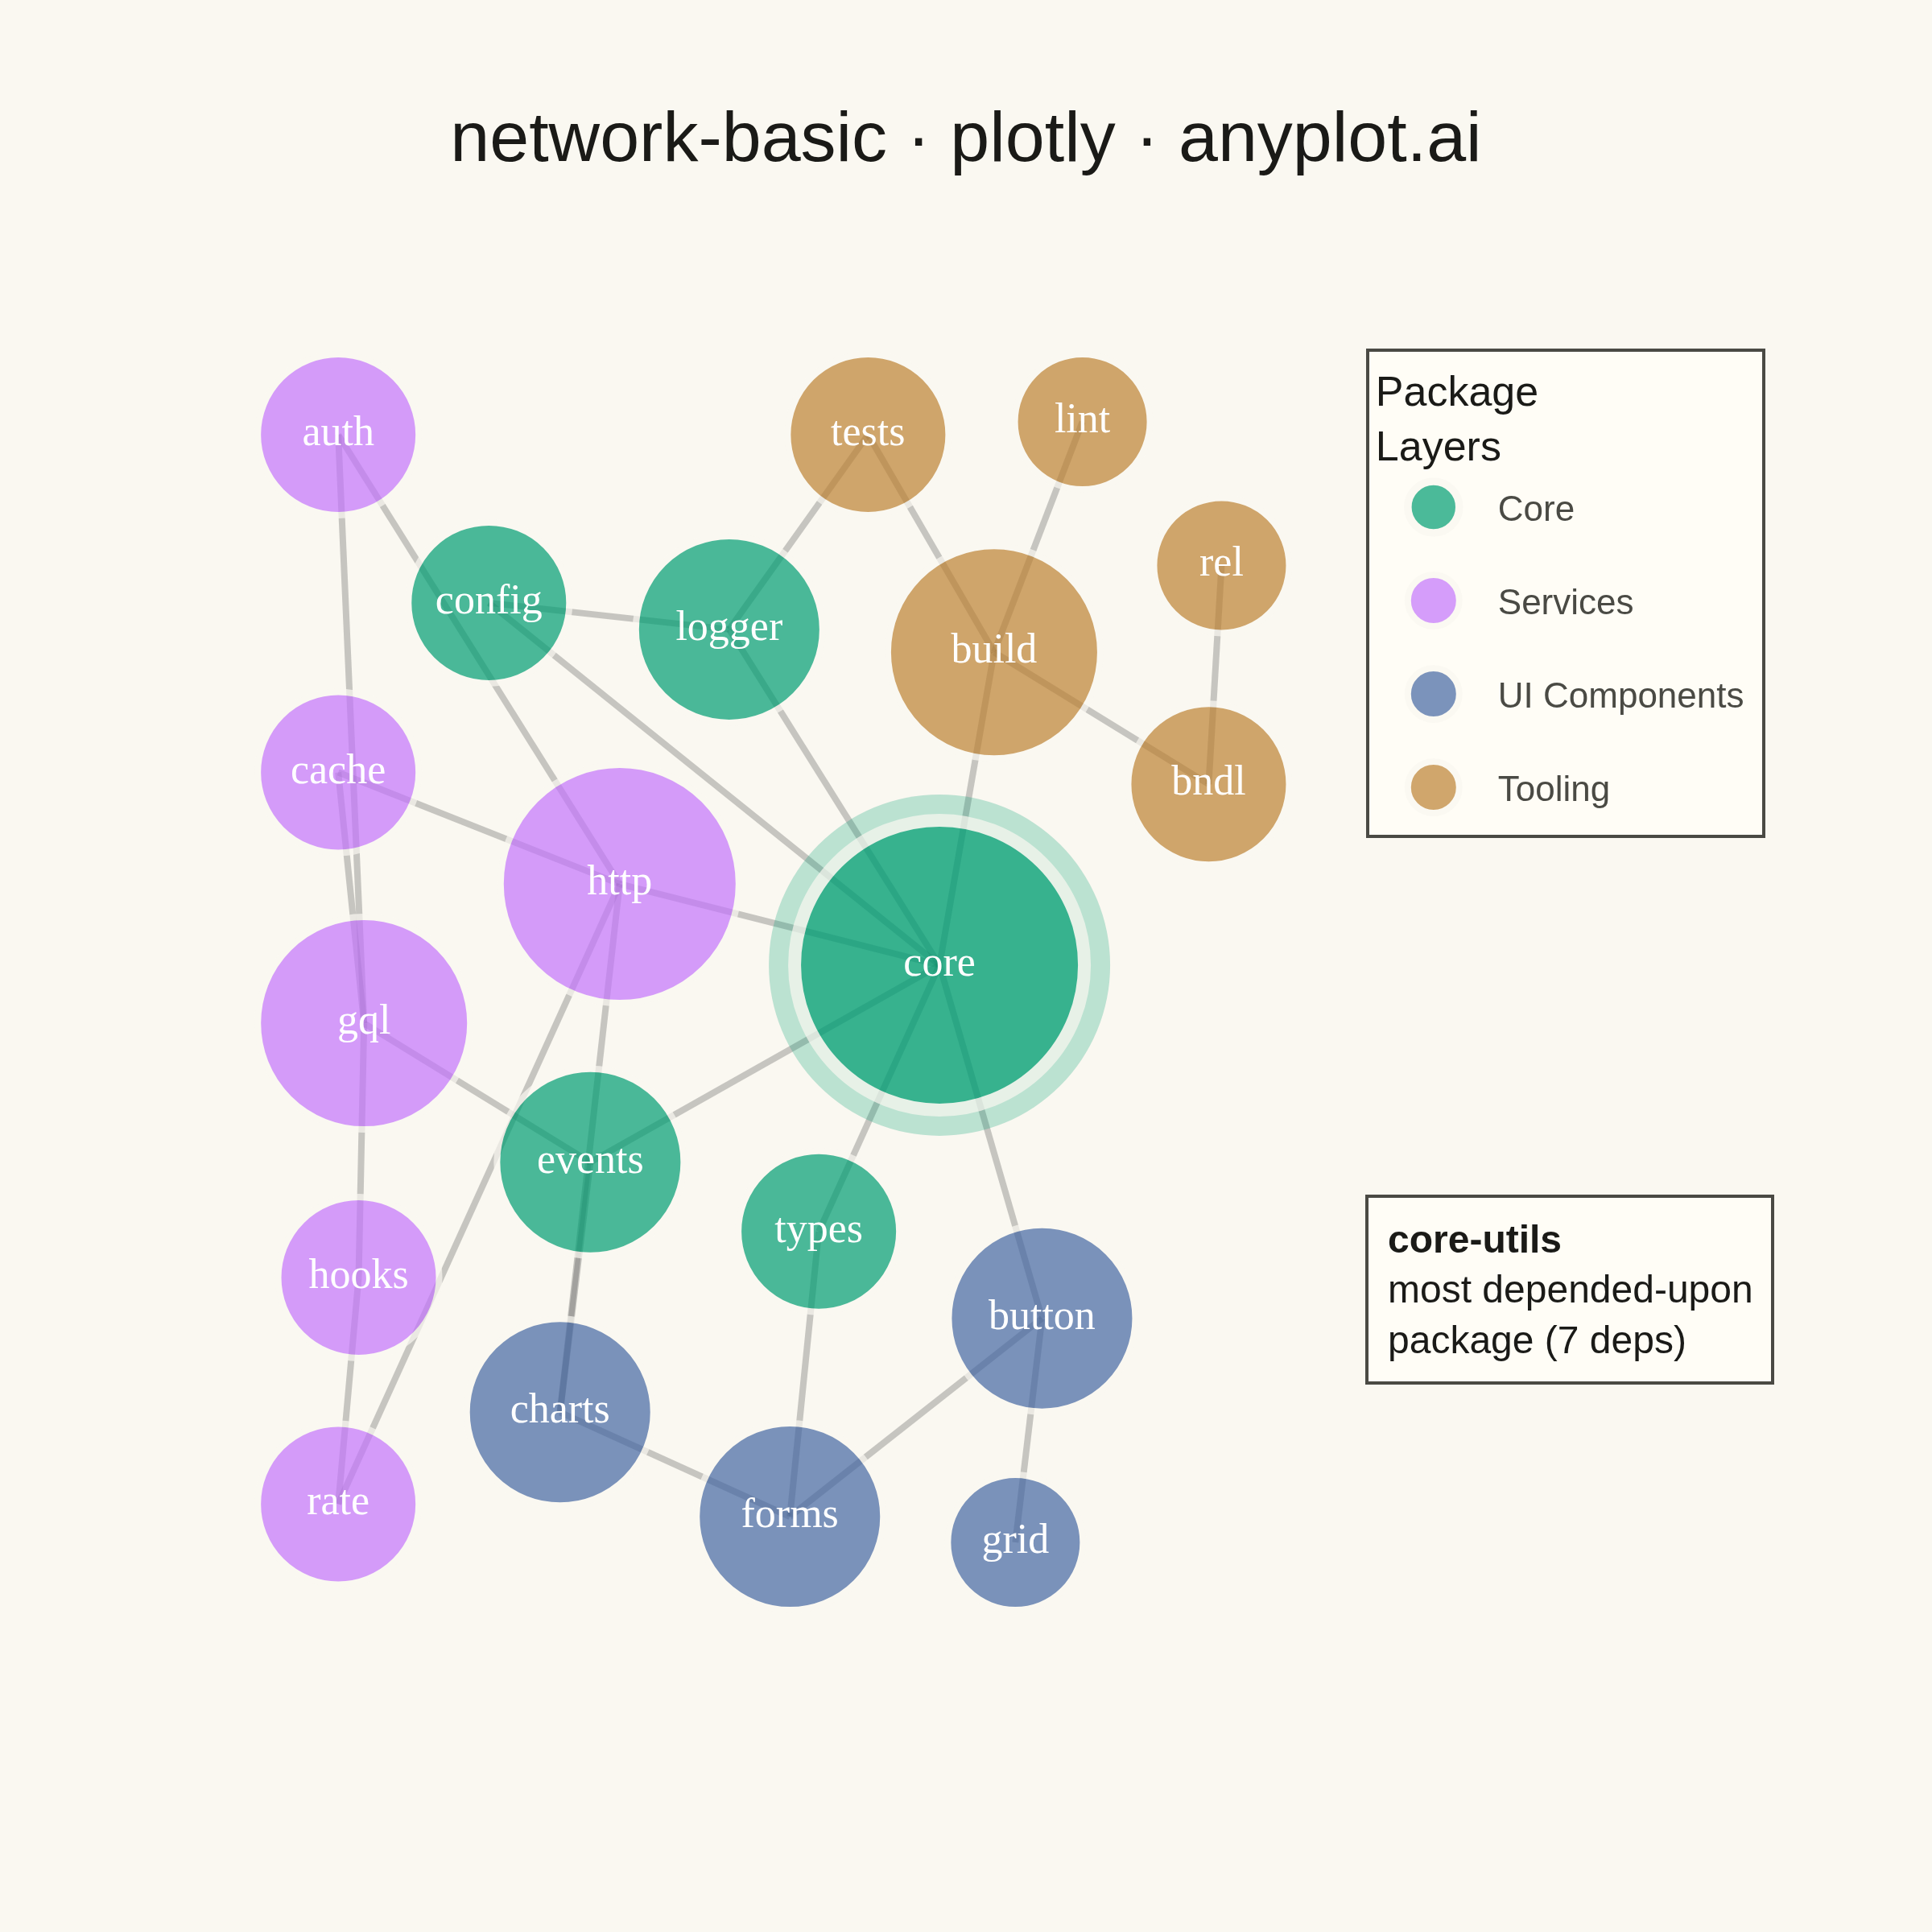
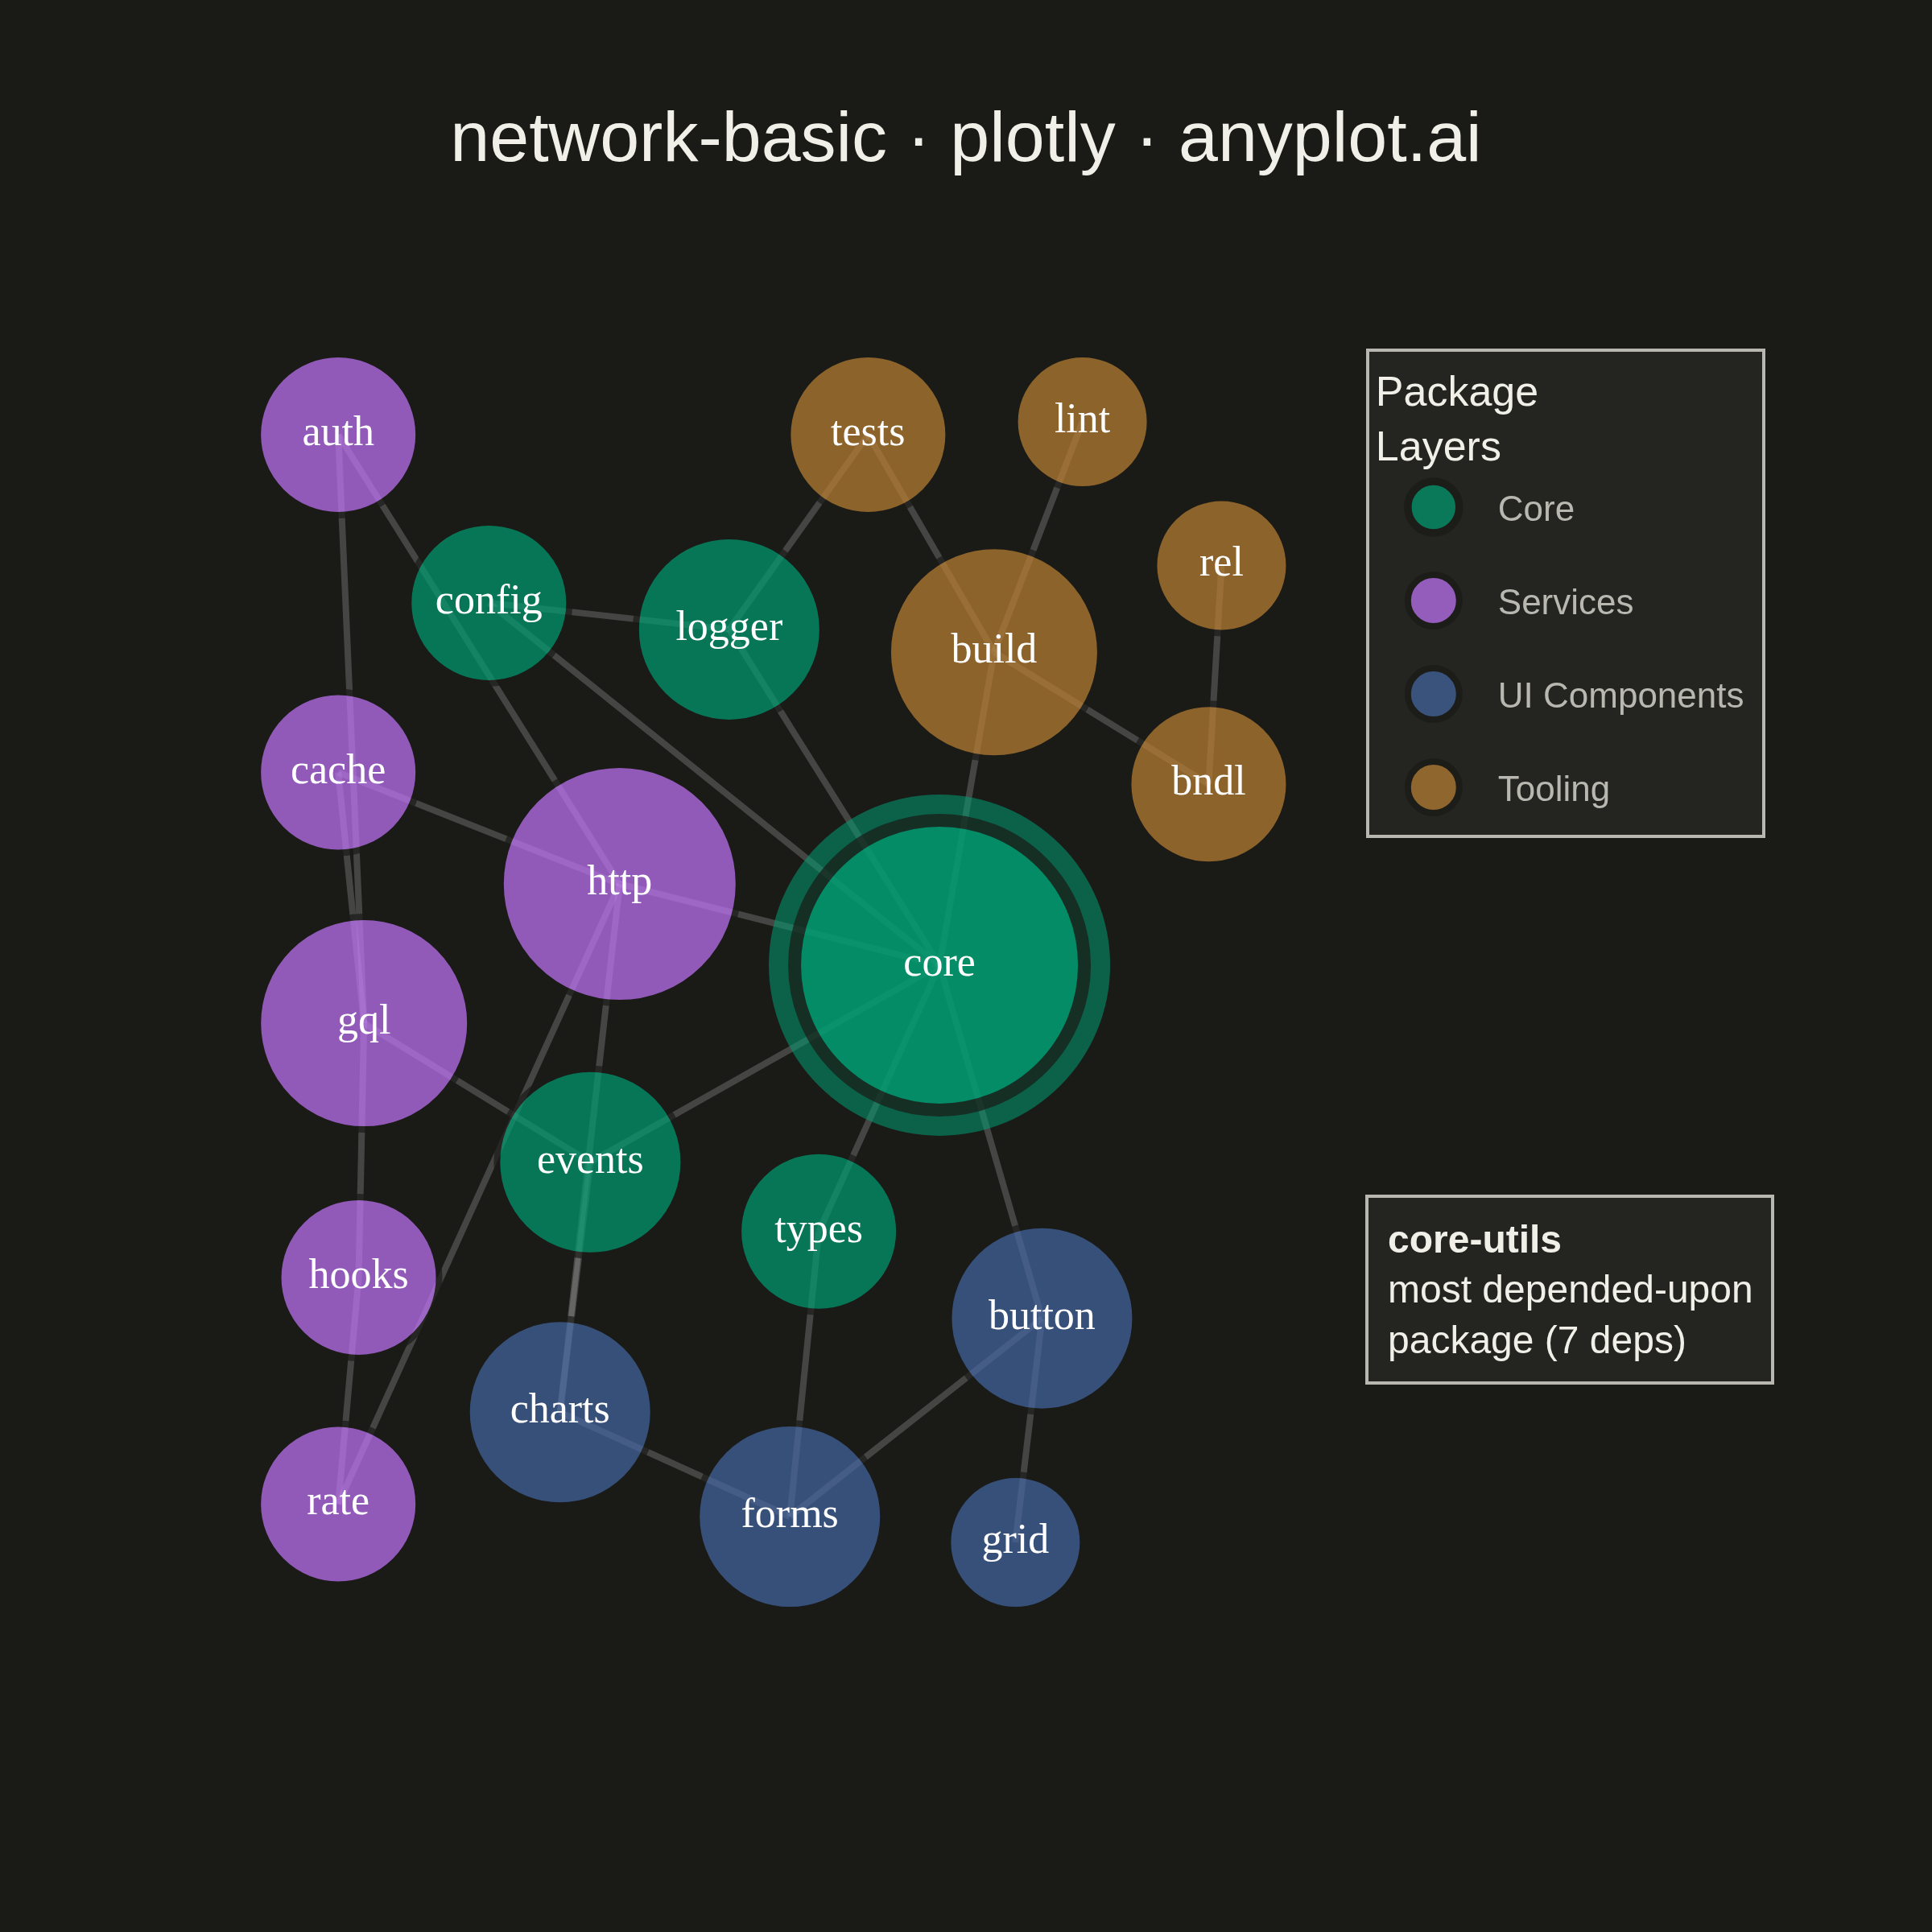
A network graph (node-link diagram) visualizes relationships between entities as nodes connected by edges. It reveals the structure of connections, clusters, and central nodes in relational data. Network graphs are essential for understanding complex systems where relationships matter as much as the entities themselves, making hidden patterns of connectivity visible at a glance.
""" anyplot.ai
network-basic: Basic Network Graph
Library: plotly 6.9.0 | Python 3.13.14
Quality: 94/100 | Updated: 2026-07-24
"""

import os
import sys


# Prevent this file from shadowing the installed plotly package
_here = os.path.dirname(os.path.abspath(__file__))
sys.path = [p for p in sys.path if os.path.abspath(p) != _here]
del _here

import numpy as np
import plotly.graph_objects as go


# Theme tokens
THEME = os.getenv("ANYPLOT_THEME", "light")
PAGE_BG = "#FAF8F1" if THEME == "light" else "#1A1A17"
ELEVATED_BG = "#FFFDF6" if THEME == "light" else "#242420"
INK = "#1A1A17" if THEME == "light" else "#F0EFE8"
INK_SOFT = "#4A4A44" if THEME == "light" else "#B8B7B0"

# Imprint palette — first series always #009E73
GROUP_COLORS = ["#009E73", "#C475FD", "#4467A3", "#BD8233"]
GROUP_NAMES = ["Core", "Services", "UI Components", "Tooling"]

# Data: software package dependency graph for a mid-sized monorepo,
# 20 packages across 4 architectural layers. The layout below (spring
# simulation + pixel declutter) is fully deterministic — no RNG involved.
# Each node carries both the full package name (used in the hover tooltip,
# the annotation, and the docs a reader would actually search for) and a
# short on-marker label — the full names run long enough (up to 18 chars)
# that fitting all 20 as external text without collisions isn't viable at
# this canvas size, so the marker itself shows a short mnemonic instead,
# matching how the original short-first-name design kept labels legible.
nodes = [
    # Core (5 packages — low-level, widely depended upon)
    {"id": 0, "label": "core-utils", "short": "core", "group": 0},
    {"id": 1, "label": "type-defs", "short": "types", "group": 0},
    {"id": 2, "label": "config-loader", "short": "config", "group": 0},
    {"id": 3, "label": "logger", "short": "logger", "group": 0},
    {"id": 4, "label": "event-bus", "short": "events", "group": 0},
    # Services (6 packages — API/backend layer)
    {"id": 5, "label": "http-client", "short": "http", "group": 1},
    {"id": 6, "label": "auth-service", "short": "auth", "group": 1},
    {"id": 7, "label": "cache-layer", "short": "cache", "group": 1},
    {"id": 8, "label": "rate-limiter", "short": "rate", "group": 1},
    {"id": 9, "label": "graphql-gateway", "short": "gql", "group": 1},
    {"id": 10, "label": "webhook-dispatcher", "short": "hooks", "group": 1},
    # UI Components (4 packages — frontend layer)
    {"id": 11, "label": "button-kit", "short": "button", "group": 2},
    {"id": 12, "label": "form-fields", "short": "forms", "group": 2},
    {"id": 13, "label": "chart-widgets", "short": "charts", "group": 2},
    {"id": 14, "label": "layout-grid", "short": "grid", "group": 2},
    # Tooling (5 packages — build/dev tooling)
    {"id": 15, "label": "build-cli", "short": "build", "group": 3},
    {"id": 16, "label": "lint-rules", "short": "lint", "group": 3},
    {"id": 17, "label": "test-runner", "short": "tests", "group": 3},
    {"id": 18, "label": "bundler-plugin", "short": "bndl", "group": 3},
    {"id": 19, "label": "release-bot", "short": "rel", "group": 3},
]

edges = [
    # Core — foundational packages depend on each other
    (0, 1),
    (0, 2),
    (0, 3),
    (0, 4),
    (3, 2),
    # Services — API layer internal dependencies
    (5, 6),
    (5, 7),
    (5, 8),
    (6, 9),
    (7, 9),
    (8, 10),
    (9, 10),
    # UI Components — frontend internal dependencies
    (11, 12),
    (11, 14),
    (12, 13),
    # Tooling — dev tooling internal dependencies
    (15, 16),
    (15, 17),
    (15, 18),
    (18, 19),
    # Cross-layer dependencies (core-utils is the most depended-upon package)
    (0, 5),  # Services depend on core-utils
    (0, 11),  # UI depends on core-utils
    (0, 15),  # Tooling depends on core-utils
    (4, 9),  # graphql-gateway subscribes to event-bus
    (4, 13),  # chart-widgets subscribes to event-bus
    (1, 12),  # form-fields depends on type-defs
    (3, 17),  # test-runner depends on logger
    (5, 13),  # chart-widgets fetches data via http-client
]

# Spring layout — nodes start clustered near their group's compass position
# so Fruchterman-Reingold only has to refine local structure, not untangle
# an interleaved ring. This keeps the 4 layers visually separated with the
# cross-layer bridges reading as clean long edges.
n = len(nodes)
n_groups = len(GROUP_NAMES)
group_sizes = {g: sum(1 for node in nodes if node["group"] == g) for g in range(n_groups)}
# Custom compass layout (not an even circle): Core top, Services left,
# UI bottom, Tooling lower-right — keeps the upper-right quadrant clear
# for the legend.
group_angles = np.radians([100, 190, 260, 335])
group_centers = np.column_stack([np.cos(group_angles), np.sin(group_angles)]) * 1.3

group_counts = dict.fromkeys(range(n_groups), 0)
positions = np.zeros((n, 2))
for i, node in enumerate(nodes):
    g = node["group"]
    seat = group_counts[g]
    group_counts[g] += 1
    seat_angle = 2 * np.pi * seat / group_sizes[g]
    positions[i] = group_centers[g] + np.array([np.cos(seat_angle), np.sin(seat_angle)]) * 0.34

k = 0.6
for iteration in range(400):
    displacement = np.zeros((n, 2))
    for i in range(n):
        for j in range(i + 1, n):
            diff = positions[i] - positions[j]
            dist = max(np.linalg.norm(diff), 0.01)
            force = (k * k / dist) * (diff / dist)
            displacement[i] += force
            displacement[j] -= force
    for src, tgt in edges:
        diff = positions[src] - positions[tgt]
        dist = max(np.linalg.norm(diff), 0.01)
        force = (dist * dist / k) * (diff / dist)
        displacement[src] -= force
        displacement[tgt] += force
    cooling = 1 - iteration / 400
    for i in range(n):
        disp_norm = np.linalg.norm(displacement[i])
        if disp_norm > 0:
            positions[i] += (displacement[i] / disp_norm) * min(disp_norm, 0.12 * cooling)

pos_min = positions.min(axis=0)
pos_max = positions.max(axis=0)
positions = (positions - pos_min) / (pos_max - pos_min + 1e-6)

# Node degrees (needed for both marker sizing and the declutter pass below)
degrees = {node["id"]: 0 for node in nodes}
for src, tgt in edges:
    degrees[src] += 1
    degrees[tgt] += 1

# Pixel-space declutter — the compass force-directed layout above gets the
# topology and cluster separation right but a tightly interconnected group
# (e.g. Services) can still leave node circles touching. Resolve that
# directly against the plot's actual pixel geometry before saving. Labels
# live *inside* the markers (see the node trace below), so the footprint
# here is just the marker circle — no separate label-width bookkeeping,
# and no need to ever rescale the layout afterward (a rescale would shrink
# node spacing without shrinking the fixed-px marker circles, silently
# reintroducing the exact overlap the declutter just resolved).
# Canvas is square (2400x2400 final) — a network graph has no preferred
# horizontal axis.
PLOT_W_PX, PLOT_H_PX = 340, 410  # xaxis domain=[0, 0.74] of the 460x410 plot area

# Data coordinates ARE pixel coordinates in this plot area (1 data unit =
# 1 output px at width=600/height=600 before the final scale=4 upsample).
positions[:, 0] *= PLOT_W_PX
positions[:, 1] *= PLOT_H_PX
px_positions = positions

# Single source of truth for marker sizes — degree 1 gets a slightly larger
# floor (was 30) so longer mnemonics on small-degree nodes ('rate', 'bndl')
# have enough room inside the circle.
marker_sizes = {node["id"]: 34 + degrees[node["id"]] * 8 for node in nodes}
marker_r_px = np.array([marker_sizes[node["id"]] for node in nodes], dtype=float) / 2
footprint_px = marker_r_px + 10  # small gap so circles never touch edge-to-edge

for _ in range(600):
    moved = False
    for i in range(n):
        for j in range(i + 1, n):
            diff = px_positions[i] - px_positions[j]
            dist = np.linalg.norm(diff)
            min_dist = footprint_px[i] + footprint_px[j]
            if dist < min_dist:
                moved = True
                direction = diff / dist if dist > 1e-6 else np.array([1.0, 0.0])
                push = (min_dist - dist) / 2 + 0.5
                px_positions[i] += direction * push
                px_positions[j] -= direction * push
    # Keep every node's own circle fully inside the plot box — clamp, don't
    # rescale, so marker radii stay valid.
    for i in range(n):
        px_positions[i, 0] = np.clip(px_positions[i, 0], footprint_px[i], PLOT_W_PX - footprint_px[i])
        px_positions[i, 1] = np.clip(px_positions[i, 1], footprint_px[i], PLOT_H_PX - footprint_px[i])
    if not moved:
        break

# Recenter the bounding box vertically within the plot area — the compass
# layout clusters most nodes above center (only the small UI group reaches
# the bottom extreme), which otherwise leaves the bottom quarter of the
# square empty. Translating (not rescaling) preserves the exact spacing the
# declutter pass just resolved, so no collisions are reintroduced.
top_extent = (px_positions[:, 1] + marker_r_px).max()
bottom_extent = (px_positions[:, 1] - marker_r_px).min()
px_positions[:, 1] += (PLOT_H_PX - top_extent - bottom_extent) / 2

positions = px_positions
pos = {node["id"]: positions[i] for i, node in enumerate(nodes)}

# The single most-connected package is the visual focal point of the graph
hub_id = max(degrees, key=degrees.get)
hub_node = next(node for node in nodes if node["id"] == hub_id)

# Edge trace
edge_x, edge_y = [], []
for src, tgt in edges:
    x0, y0 = pos[src]
    x1, y1 = pos[tgt]
    edge_x.extend([x0, x1, None])
    edge_y.extend([y0, y1, None])

edge_color = "rgba(80,80,80,0.30)" if THEME == "light" else "rgba(200,200,200,0.25)"
edge_trace = go.Scatter(
    x=edge_x, y=edge_y, mode="lines", line={"width": 2, "color": edge_color}, hoverinfo="none", showlegend=False
)


# Halo trace — a soft glow behind the hub node draws the eye to the
# single most-depended-upon package before any label is read. Dark theme
# needs a higher opacity than light theme: the same 25%-opacity brand-green
# over near-black stays visually dark, while over the warm off-white it
# already reads as a clear pale ring.
hub_x, hub_y = pos[hub_id]
halo_opacity = 0.25 if THEME == "light" else 0.55
halo_trace = go.Scatter(
    x=[hub_x],
    y=[hub_y],
    mode="markers",
    marker={
        "size": marker_sizes[hub_id] + 16,
        "color": GROUP_COLORS[hub_node["group"]],
        "opacity": halo_opacity,
        "line": {"width": 0},
    },
    hoverinfo="none",
    showlegend=False,
)

# Node traces — one per group so the legend shows architectural layers.
# The marker text shows a short mnemonic; the hover tooltip and the
# focal-point annotation carry the full package name.
node_traces = []
for group_id, (color, name) in enumerate(zip(GROUP_COLORS, GROUP_NAMES, strict=False)):
    group_nodes = [node for node in nodes if node["group"] == group_id]
    node_x = [pos[node["id"]][0] for node in group_nodes]
    node_y = [pos[node["id"]][1] for node in group_nodes]
    node_sizes = [marker_sizes[node["id"]] for node in group_nodes]
    node_short_labels = [node["short"] for node in group_nodes]
    node_line_widths = [4 if node["id"] == hub_id else 2 for node in group_nodes]

    # Build dependent list for rich hover tooltips (Plotly hovertemplate + customdata)
    customdata = []
    for node in group_nodes:
        nid = node["id"]
        nbrs = []
        for src, tgt in edges:
            if src == nid:
                nbrs.append(nodes[tgt]["label"])
            elif tgt == nid:
                nbrs.append(nodes[src]["label"])
        customdata.append([node["label"], degrees[nid], ", ".join(nbrs) if nbrs else "—"])

    node_traces.append(
        go.Scatter(
            x=node_x,
            y=node_y,
            mode="markers+text",
            marker={"size": node_sizes, "color": color, "line": {"width": node_line_widths, "color": PAGE_BG}},
            text=node_short_labels,
            textposition="middle center",
            textfont={"size": 13, "color": "#FFFFFF", "family": "Arial Black"},
            customdata=customdata,
            hovertemplate=(
                "<b>%{customdata[0]}</b><br>"
                f"Layer: {name}<br>"
                "Connections: %{customdata[1]}<br>"
                "Connected to: %{customdata[2]}"
                "<extra></extra>"
            ),
            name=name,
            legendgroup=name,
        )
    )

# Figure
fig = go.Figure(data=[edge_trace, halo_trace] + node_traces)

fig.update_layout(
    autosize=False,
    title={
        "text": "network-basic · plotly · anyplot.ai",
        "font": {"size": 22, "color": INK},
        "x": 0.5,
        "xanchor": "center",
    },
    showlegend=True,
    legend={
        "title": {"text": "Package<br>Layers", "font": {"size": 13, "color": INK}},
        "font": {"size": 11, "color": INK_SOFT},
        "bgcolor": ELEVATED_BG,
        "bordercolor": INK_SOFT,
        "borderwidth": 1,
        "x": 0.77,
        "y": 0.98,
        "xanchor": "left",
        "yanchor": "top",
    },
    paper_bgcolor=PAGE_BG,
    plot_bgcolor=PAGE_BG,
    font={"color": INK},
    # The plot area is restricted to the left 74% of the canvas — the
    # remaining right-hand gutter is a dedicated, guaranteed-empty lane for
    # the legend, so it can never overlap a node regardless of layout.
    # Data coordinates equal output px 1:1 in this plot area (see the
    # declutter pass above), so the range is exactly [0, PLOT_*_PX] — no
    # padding needed, since the clamp step already keeps every node's own
    # circle fully inside that box.
    xaxis={"showgrid": False, "zeroline": False, "showticklabels": False, "range": [0, PLOT_W_PX], "domain": [0, 0.74]},
    yaxis={"showgrid": False, "zeroline": False, "showticklabels": False, "range": [0, PLOT_H_PX]},
    margin={"l": 70, "r": 70, "t": 100, "b": 90},
    annotations=[
        {
            # Lives in the same right-hand gutter as the legend (x >= 0.77),
            # which the xaxis domain restriction guarantees stays empty of
            # nodes — safer than a plot-area corner, which a dense layout
            # can still reach despite the margin.
            "x": 0.77,
            "y": 0.34,
            "xref": "paper",
            "yref": "paper",
            "text": (f"<b>{hub_node['label']}</b><br>most depended-upon<br>package ({degrees[hub_id]} deps)"),
            "showarrow": False,
            "font": {"size": 12, "color": INK},
            "bgcolor": ELEVATED_BG,
            "bordercolor": INK_SOFT,
            "borderwidth": 1,
            "borderpad": 6,
            "align": "left",
            "xanchor": "left",
            "yanchor": "top",
        }
    ],
)

# Save
# Hard target: 2400 x 2400 (square — a network graph has no preferred
# horizontal axis). See prompts/library/plotly.md "Canvas — hard rule".
fig.write_image(f"plot-{THEME}.png", width=600, height=600, scale=4)
fig.write_html(f"plot-{THEME}.html", include_plotlyjs="cdn")
Runnable source as JSON, for any HTTP client: https://api.anyplot.ai/specs/network-basic/plotly/code. Any spec id and library id listed in llms-full.txt fit the same URL shape; every URL below is complete and callable.
{
  "spec_id": "network-basic",
  "language": "python",
  "library": "plotly",
  "page": "https://anyplot.ai/network-basic/python/plotly",
  "hub": "https://anyplot.ai/network-basic",
  "code_json": "https://api.anyplot.ai/specs/network-basic/plotly/code",
  "spec_json": "https://api.anyplot.ai/specs/network-basic",
  "render_light_png": "https://storage.googleapis.com/anyplot-images/plots/network-basic/python/plotly/plot-light.png",
  "render_dark_png": "https://storage.googleapis.com/anyplot-images/plots/network-basic/python/plotly/plot-dark.png",
  "interactive_light_html": "https://storage.googleapis.com/anyplot-images/plots/network-basic/python/plotly/plot-light.html",
  "interactive_dark_html": "https://storage.googleapis.com/anyplot-images/plots/network-basic/python/plotly/plot-dark.html",
  "quality_score": 94.0,
  "license": "MIT",
  "guide": "https://anyplot.ai/llms.txt"
}
Part of Basic Network Graph on anyplot.ai.