The same plot in 14 other libraries — Python: Altair, Bokeh, lets-plot, Matplotlib, Plotly, plotnine, Pygal, Seaborn; R: ggplot2; JavaScript: Chart.js, D3.js, Apache ECharts, Highcharts, MUI X Charts. Compare all 15 side by side: Basic Network Graph in Python, R, Julia and JavaScript.
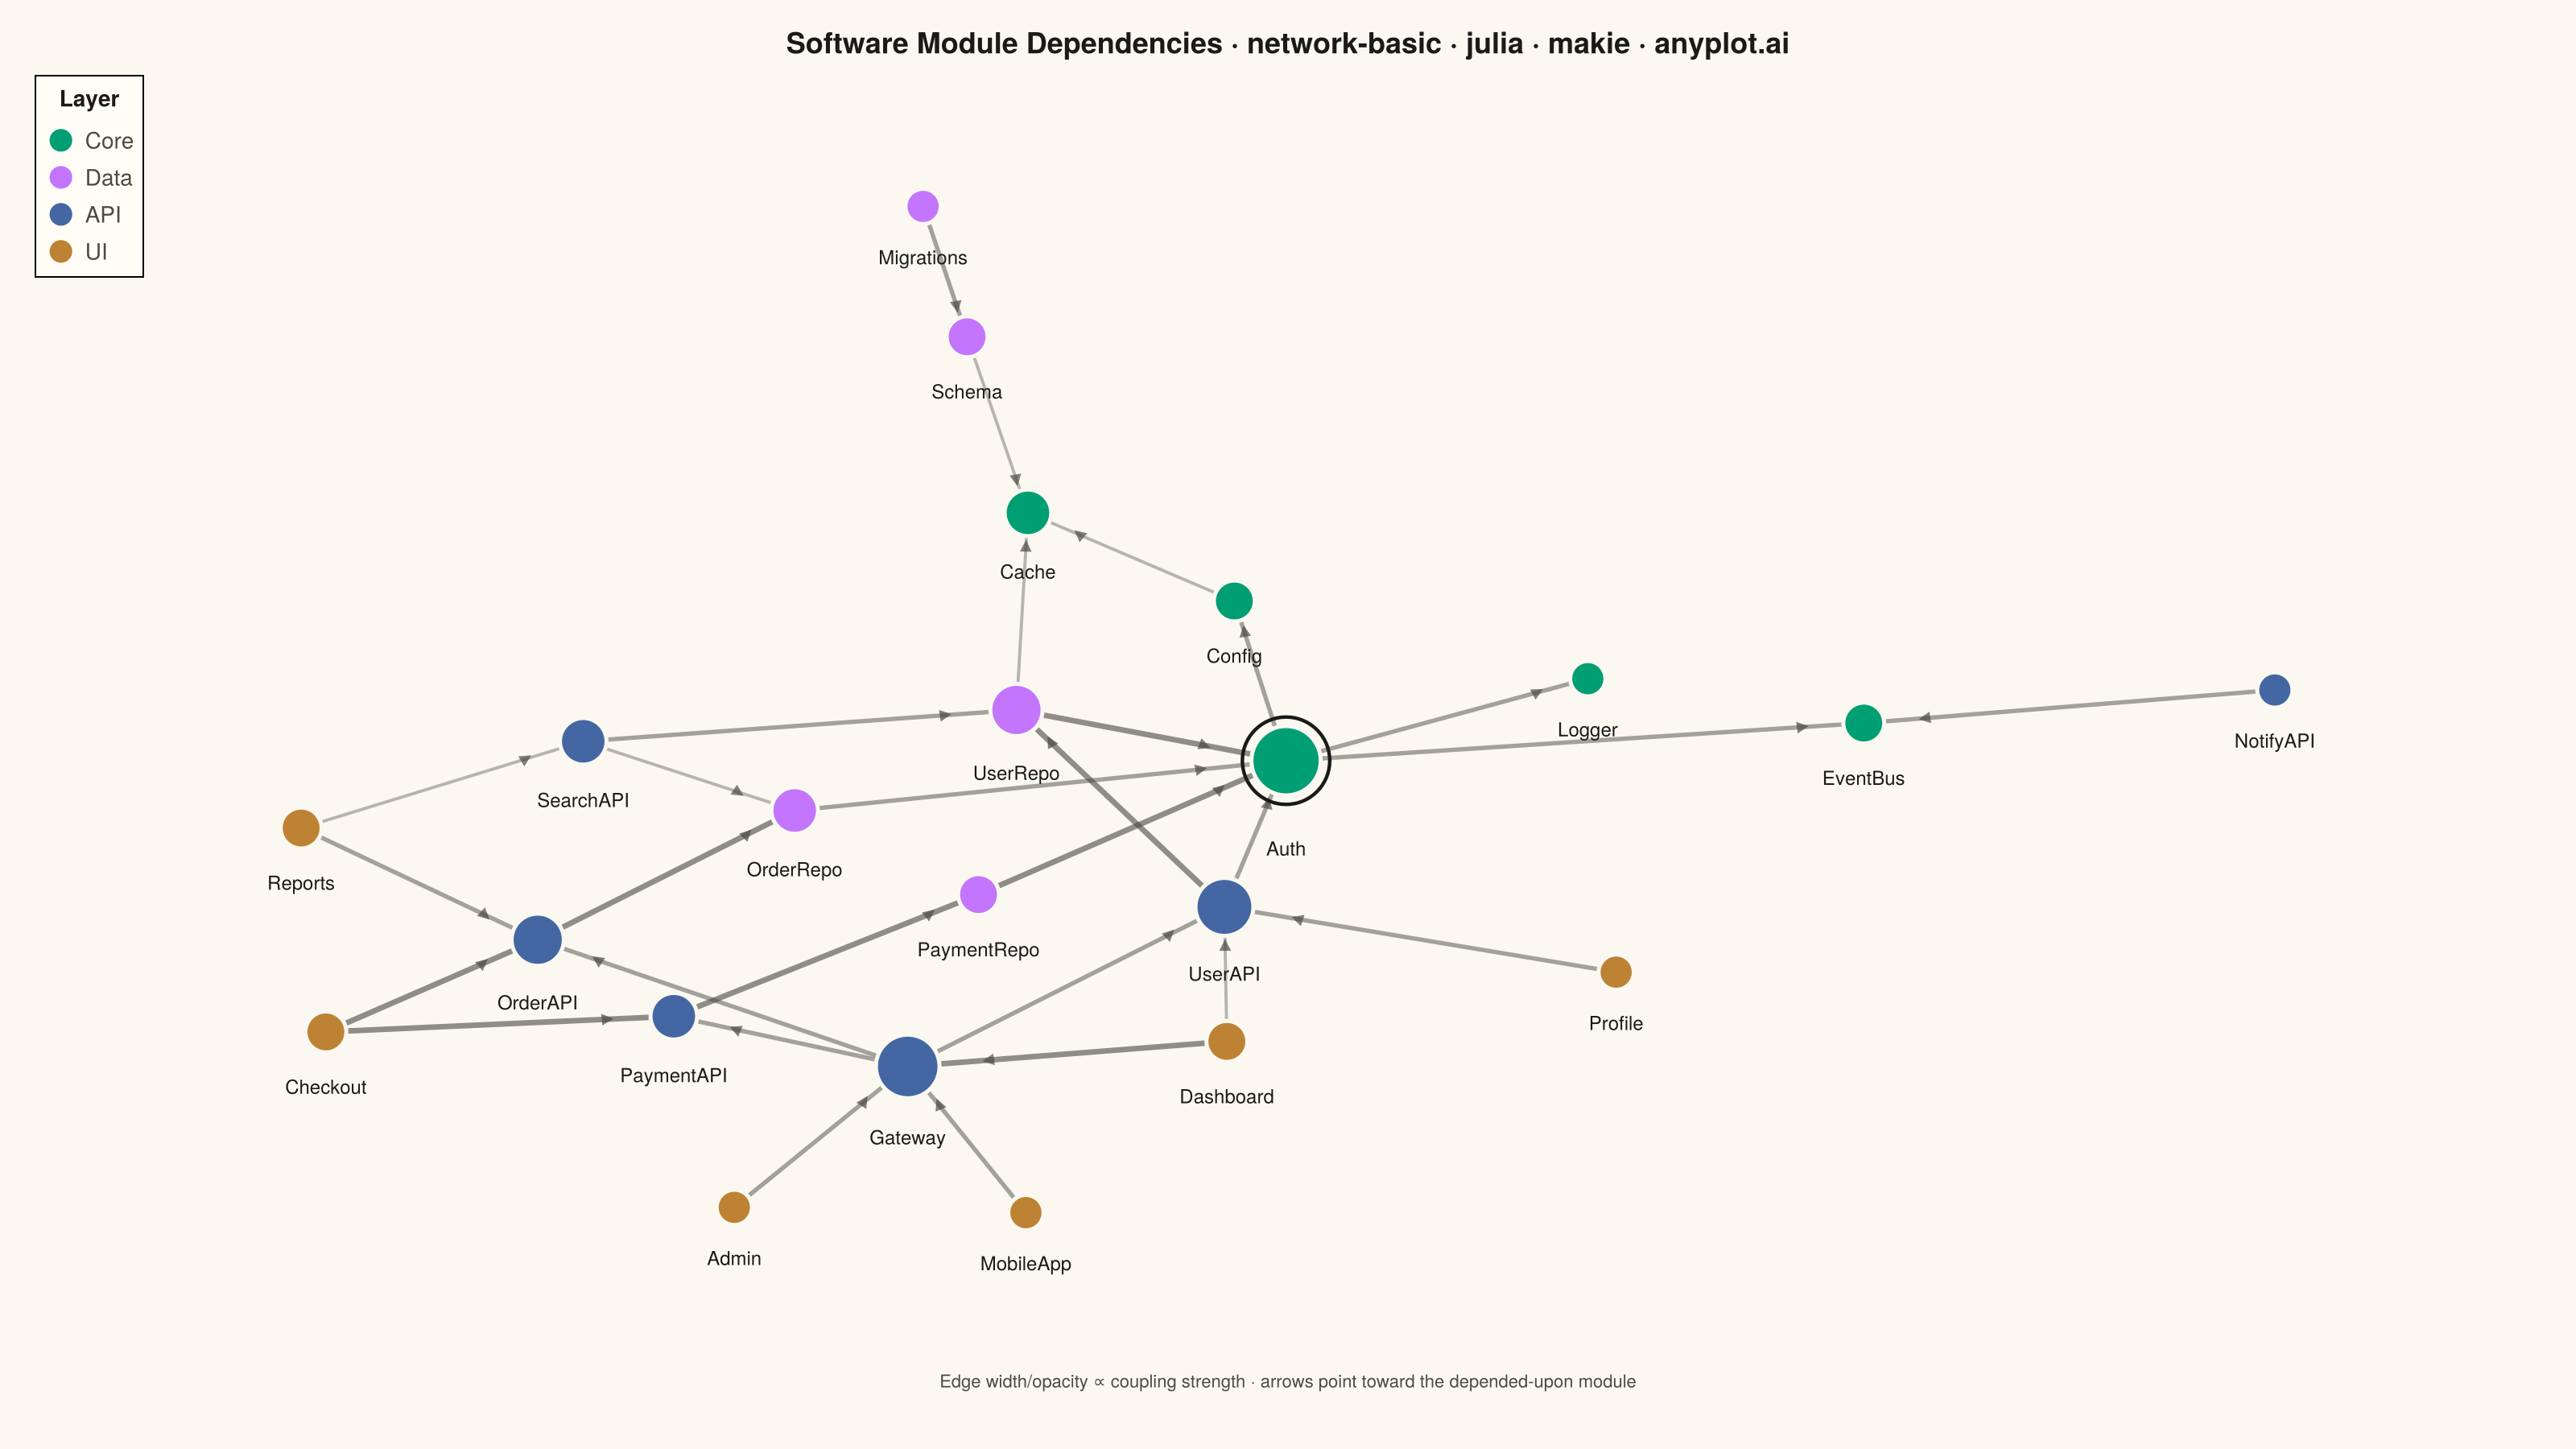
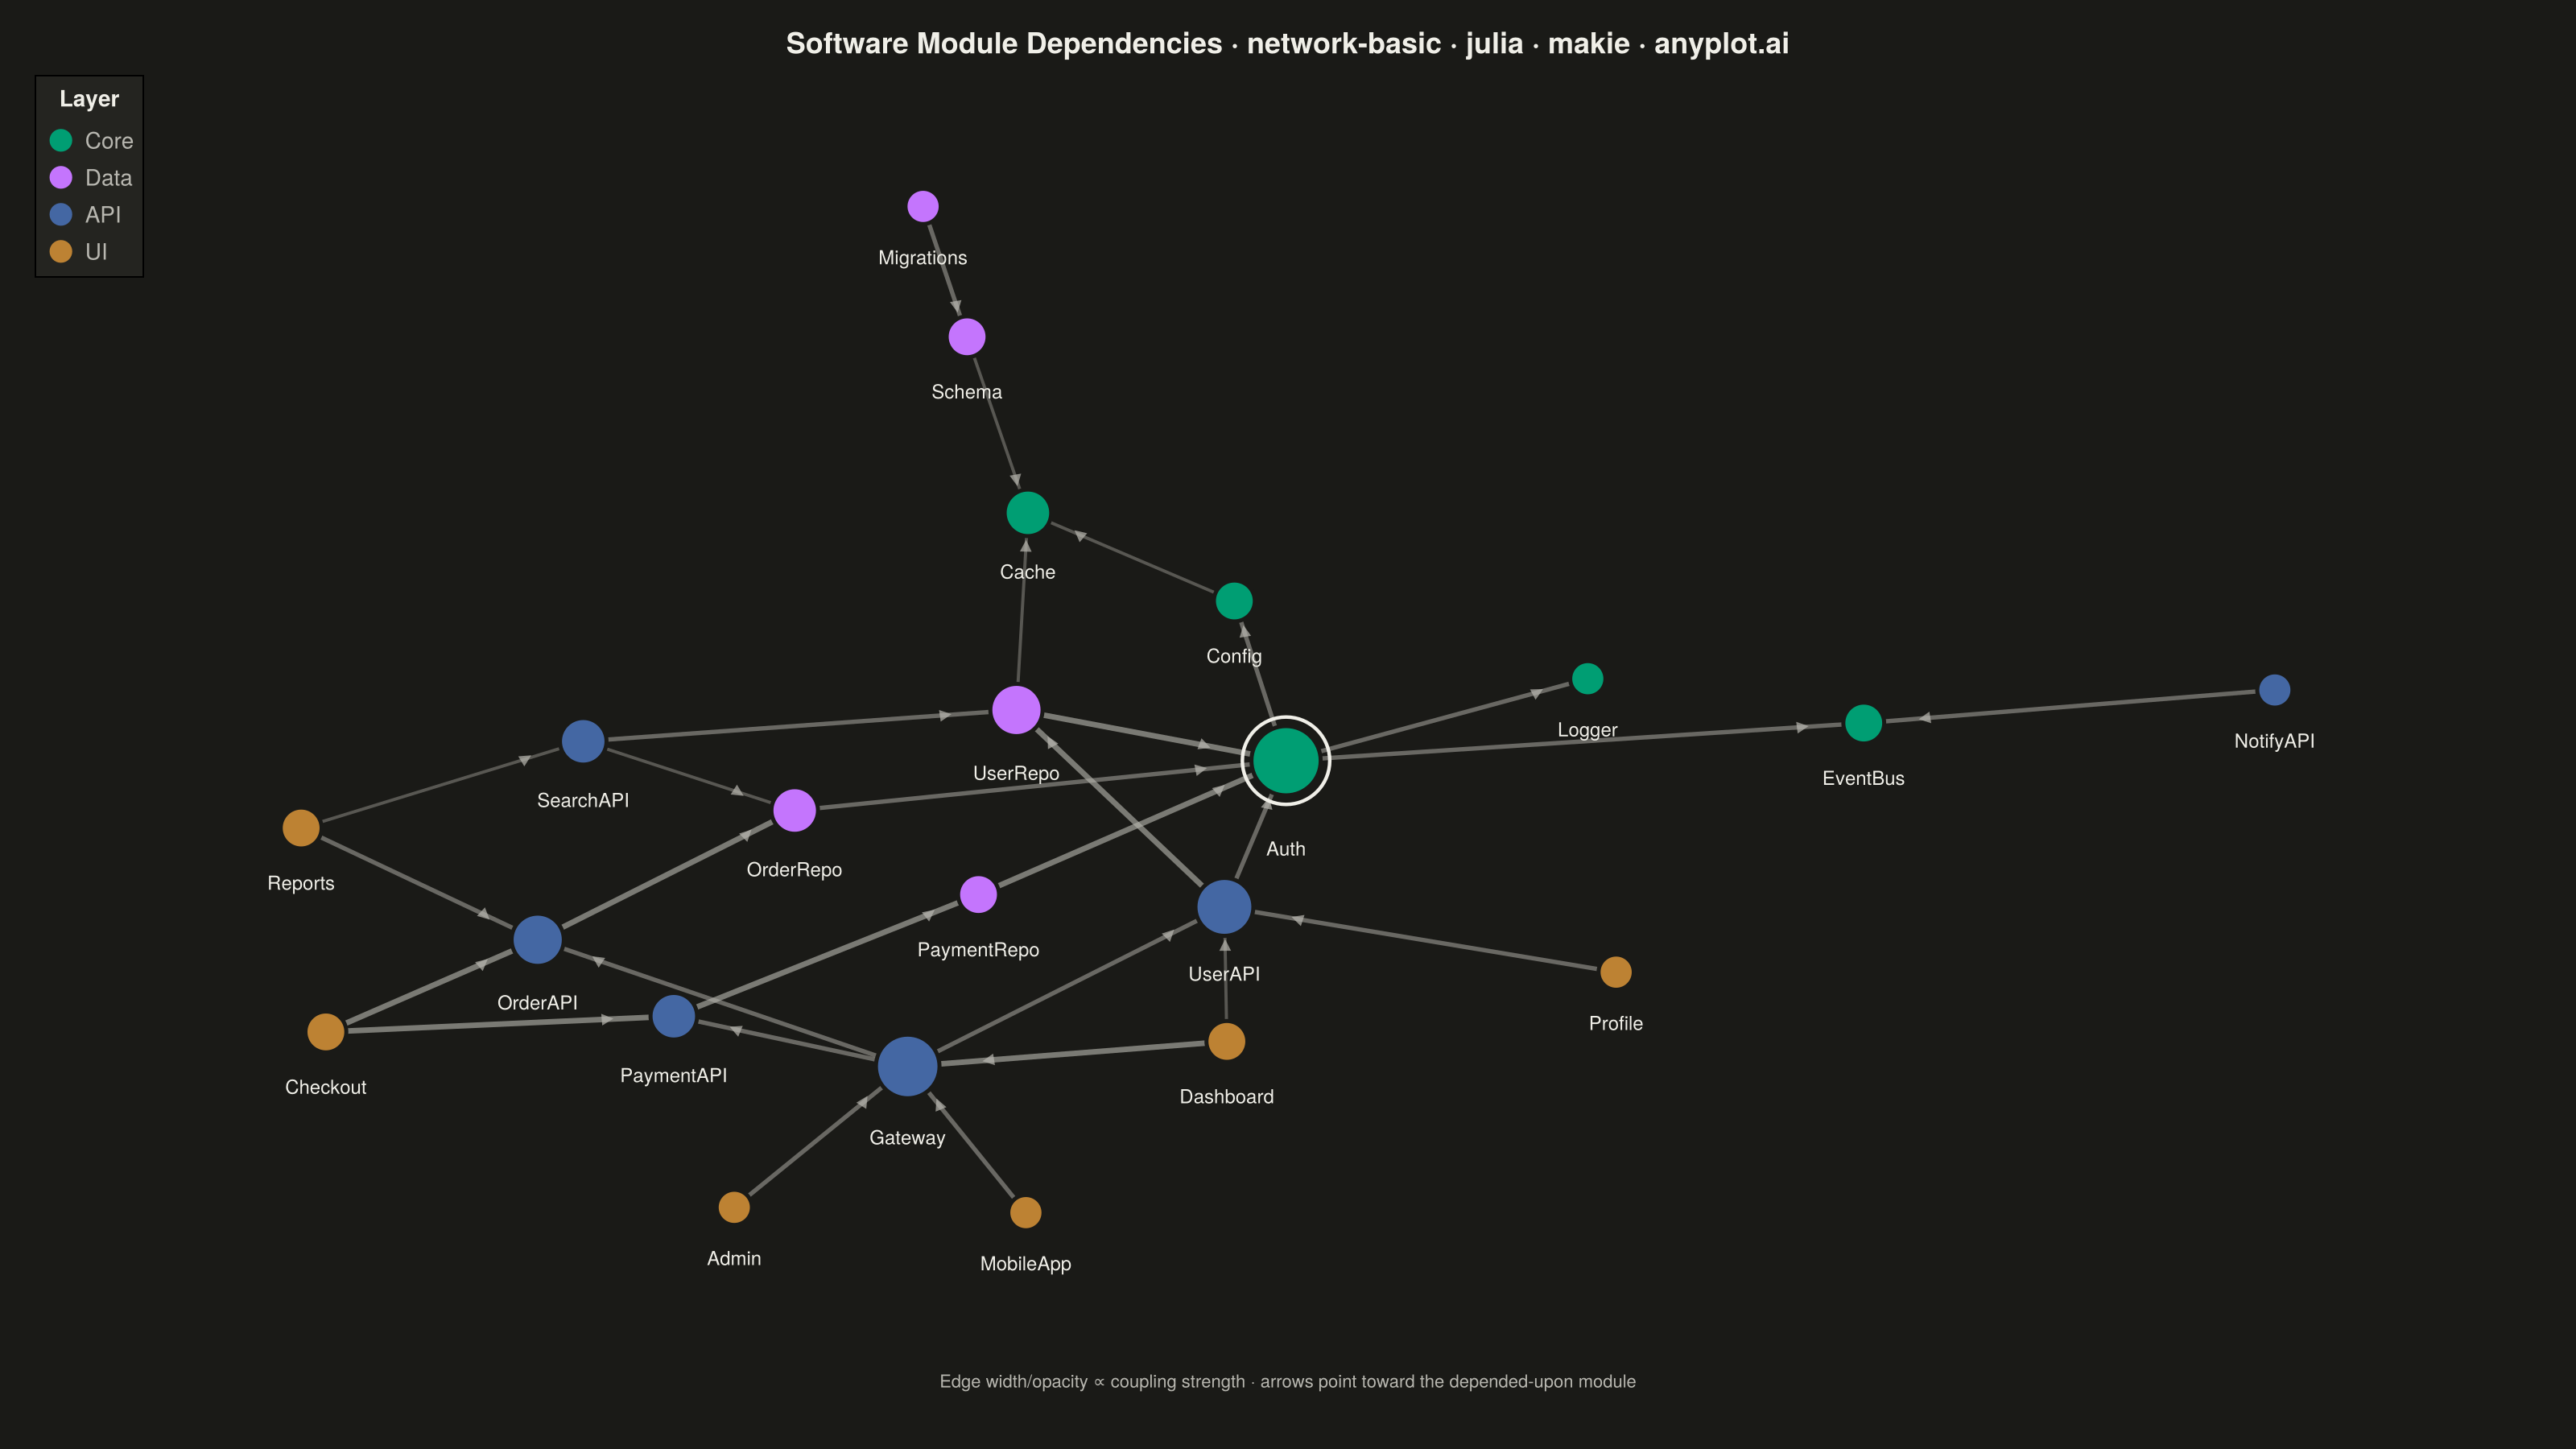
A network graph (node-link diagram) visualizes relationships between entities as nodes connected by edges. It reveals the structure of connections, clusters, and central nodes in relational data. Network graphs are essential for understanding complex systems where relationships matter as much as the entities themselves, making hidden patterns of connectivity visible at a glance.
# anyplot.ai
# network-basic: Basic Network Graph
# Library: makie 0.21.9 | Julia 1.11.9
# Quality: 95/100 | Created: 2026-07-24

using CairoMakie
using Colors
using Random

Random.seed!(42)

# --- Theme tokens -----------------------------------------------------------
const THEME       = get(ENV, "ANYPLOT_THEME", "light")
const PAGE_BG     = THEME == "light" ? colorant"#FAF8F1" : colorant"#1A1A17"
const ELEVATED_BG = THEME == "light" ? colorant"#FFFDF6" : colorant"#242420"
const INK         = THEME == "light" ? colorant"#1A1A17" : colorant"#F0EFE8"
const INK_SOFT    = THEME == "light" ? colorant"#4A4A44" : colorant"#B8B7B0"

# Imprint categorical palette (first 4 positions — module layers)
const IMPRINT_PALETTE = [
    colorant"#009E73",  # 1 — Core
    colorant"#C475FD",  # 2 — Data
    colorant"#4467A3",  # 3 — API
    colorant"#BD8233",  # 4 — UI
]
const LAYER_NAMES = ["Core", "Data", "API", "UI"]

# --- Data: software module dependency graph ---------------------------------
module_names = [
    "Auth", "Config", "Logger", "Cache", "EventBus",
    "UserRepo", "OrderRepo", "PaymentRepo", "Schema", "Migrations",
    "UserAPI", "OrderAPI", "PaymentAPI", "SearchAPI", "NotifyAPI", "Gateway",
    "Dashboard", "Checkout", "Profile", "Admin", "Reports", "MobileApp",
]
layer = [
    1, 1, 1, 1, 1,
    2, 2, 2, 2, 2,
    3, 3, 3, 3, 3, 3,
    4, 4, 4, 4, 4, 4,
]
n = length(module_names)

# Third element is coupling strength: 1=light, 2=normal, 3=critical dependency
edges = [
    # Core internals
    (1, 2, 2), (1, 3, 2), (2, 4, 1), (1, 5, 2),
    # Data depends on Core
    (6, 1, 3), (6, 4, 1), (7, 1, 2), (8, 1, 3), (9, 4, 1), (10, 9, 2),
    # API depends on Data + Core
    (11, 6, 3), (11, 1, 2), (12, 7, 3), (13, 8, 3), (14, 6, 2), (14, 7, 1), (15, 5, 2),
    (16, 11, 2), (16, 12, 2), (16, 13, 2),
    # UI depends on API
    (17, 16, 3), (17, 11, 1), (18, 12, 3), (18, 13, 3), (19, 11, 2),
    (20, 16, 2), (21, 14, 1), (21, 12, 2), (22, 16, 2),
]

degrees = zeros(Int, n)
for (a, b, _) in edges
    degrees[a] += 1
    degrees[b] += 1
end

# --- Force-directed layout (Fruchterman-Reingold, hand-rolled — no
#     NetworkLayout.jl, which is not installed in the CI runtime) -----------
angles = range(0, 2π; length = n + 1)[1:n] .+ randn(n) .* 0.15
radius = 0.4
positions = hcat(0.5 .+ radius .* cos.(angles), 0.5 .+ radius .* sin.(angles))

k = sqrt(1.0 / n)
iterations = 200
for iter in 1:iterations
    disp = zeros(n, 2)
    for i in 1:n, j in 1:n
        i == j && continue
        dx, dy = positions[i, 1] - positions[j, 1], positions[i, 2] - positions[j, 2]
        dist = max(hypot(dx, dy), 0.01)
        force = k^2 / dist
        disp[i, 1] += (dx / dist) * force
        disp[i, 2] += (dy / dist) * force
    end
    for (a, b, _) in edges
        dx, dy = positions[a, 1] - positions[b, 1], positions[a, 2] - positions[b, 2]
        dist = max(hypot(dx, dy), 0.01)
        force = dist^2 / k
        disp[a, 1] -= (dx / dist) * force
        disp[a, 2] -= (dy / dist) * force
        disp[b, 1] += (dx / dist) * force
        disp[b, 2] += (dy / dist) * force
    end
    temperature = 0.1 * (1 - iter / iterations)
    for i in 1:n
        dn = hypot(disp[i, 1], disp[i, 2])
        if dn > 0
            step = min(dn, temperature) / dn
            positions[i, 1] += disp[i, 1] * step
            positions[i, 2] += disp[i, 2] * step
        end
    end
end

pos_min = vec(minimum(positions; dims = 1))
pos_max = vec(maximum(positions; dims = 1))
positions = (positions .- pos_min') ./ (pos_max' .- pos_min') .* 0.86 .+ 0.07

# --- Plot ---------------------------------------------------------------
title_text = "Software Module Dependencies · network-basic · julia · makie · anyplot.ai"

fig = Figure(
    resolution      = (1600, 900),
    fontsize        = 14,
    backgroundcolor = PAGE_BG,
)

ax = Axis(
    fig[1, 1];
    title            = title_text,
    titlesize        = 18,
    titlecolor       = INK,
    backgroundcolor  = PAGE_BG,
)
hidedecorations!(ax)
hidespines!(ax)
xlims!(ax, -0.05, 1.05)
ylims!(ax, -0.11, 1.05)

node_colors = [IMPRINT_PALETTE[layer[i]] for i in 1:n]
node_sizes = [26.0 + degrees[i] * 5.0 for i in 1:n]

# Edges drawn per-segment so linewidth/alpha can be keyed to coupling strength
# (weight 1=light, 2=normal, 3=critical) — a Makie-distinctive per-edge encoding
# rather than a single batched style for every dependency.
edge_points = Vector{Point2f}(undef, 2 * length(edges))
edge_widths = Vector{Float32}(undef, 2 * length(edges))
edge_colors = Vector{RGBAf}(undef, 2 * length(edges))
for (idx, (a, b, w)) in enumerate(edges)
    edge_points[2idx - 1] = Point2f(positions[a, 1], positions[a, 2])
    edge_points[2idx]     = Point2f(positions[b, 1], positions[b, 2])
    width = 1.2 + w * 0.75
    alpha = 0.28 + w * 0.11
    edge_widths[2idx - 1] = width
    edge_widths[2idx]     = width
    edge_colors[2idx - 1] = RGBAf(INK_SOFT.r, INK_SOFT.g, INK_SOFT.b, alpha)
    edge_colors[2idx]     = RGBAf(INK_SOFT.r, INK_SOFT.g, INK_SOFT.b, alpha)
end
linesegments!(ax, edge_points; color = edge_colors, linewidth = edge_widths)

# Small arrowhead per edge, pulled back from the target node's rim, so the
# undirected line segments above read as directed "depends on" relationships.
px_per_data_unit = 1150.0
arrow_positions = Vector{Point2f}(undef, length(edges))
arrow_rotations = Vector{Float32}(undef, length(edges))
for (idx, (a, b, _)) in enumerate(edges)
    pa, pb = positions[a, :], positions[b, :]
    dvec = pb .- pa
    dist = max(hypot(dvec[1], dvec[2]), 1e-6)
    dir = dvec ./ dist
    pullback = node_sizes[b] / 2 / px_per_data_unit + 0.012
    arrow_positions[idx] = Point2f((pb .- dir .* pullback)...)
    arrow_rotations[idx] = atan(dir[2], dir[1]) - Float32(pi / 2)
end
scatter!(
    ax, arrow_positions;
    marker      = :utriangle,
    markersize  = 10,
    rotation    = arrow_rotations,
    color       = RGBAf(INK_SOFT.r, INK_SOFT.g, INK_SOFT.b, 0.7),
    strokewidth = 0,
)

scatter!(
    ax, positions[:, 1], positions[:, 2];
    color       = node_colors,
    markersize  = node_sizes,
    strokecolor = PAGE_BG,
    strokewidth = 2.5,
)

# Emphasize the top hub module(s) with an outer ring beyond size alone, giving
# the layout a clear architectural-bottleneck focal point.
max_degree = maximum(degrees)
hub_indices = findall(==(max_degree), degrees)
length(hub_indices) > 2 && (hub_indices = hub_indices[1:2])
scatter!(
    ax, positions[hub_indices, 1], positions[hub_indices, 2];
    marker      = :circle,
    markersize  = [node_sizes[i] + 16.0 for i in hub_indices],
    color       = :transparent,
    strokecolor = INK,
    strokewidth = 2.2,
)

hub_set = Set(hub_indices)
label_offsets = [(0.0f0, -(node_sizes[i] / 2 + (i in hub_set ? 8.0 : 0.0) + 9)) for i in 1:n]
text!(
    ax, positions[:, 1], positions[:, 2];
    text      = module_names,
    align     = (:center, :top),
    fontsize  = 12,
    color     = INK,
    offset    = label_offsets,
)

for (i, name) in enumerate(LAYER_NAMES)
    scatter!(ax, [NaN], [NaN]; color = IMPRINT_PALETTE[i], markersize = 20, label = name)
end
axislegend(ax, "Layer"; position = :lt, backgroundcolor = ELEVATED_BG, labelcolor = INK_SOFT, titlecolor = INK)

text!(
    ax, 0.5, -0.065;
    text     = "Edge width/opacity ∝ coupling strength · arrows point toward the depended-upon module",
    align    = (:center, :top),
    fontsize = 11,
    color    = INK_SOFT,
)

# --- Save -------------------------------------------------------------------
save("plot-$(THEME).png", fig; px_per_unit = 2)
Runnable source as JSON, for any HTTP client: https://api.anyplot.ai/specs/network-basic/makie/code. Any spec id and library id listed in llms-full.txt fit the same URL shape; every URL below is complete and callable.
{
  "spec_id": "network-basic",
  "language": "julia",
  "library": "makie",
  "page": "https://anyplot.ai/network-basic/julia/makie",
  "hub": "https://anyplot.ai/network-basic",
  "code_json": "https://api.anyplot.ai/specs/network-basic/makie/code",
  "spec_json": "https://api.anyplot.ai/specs/network-basic",
  "render_light_png": "https://storage.googleapis.com/anyplot-images/plots/network-basic/julia/makie/plot-light.png",
  "render_dark_png": "https://storage.googleapis.com/anyplot-images/plots/network-basic/julia/makie/plot-dark.png",
  "quality_score": 95.0,
  "license": "MIT",
  "guide": "https://anyplot.ai/llms.txt"
}
Part of Basic Network Graph on anyplot.ai.