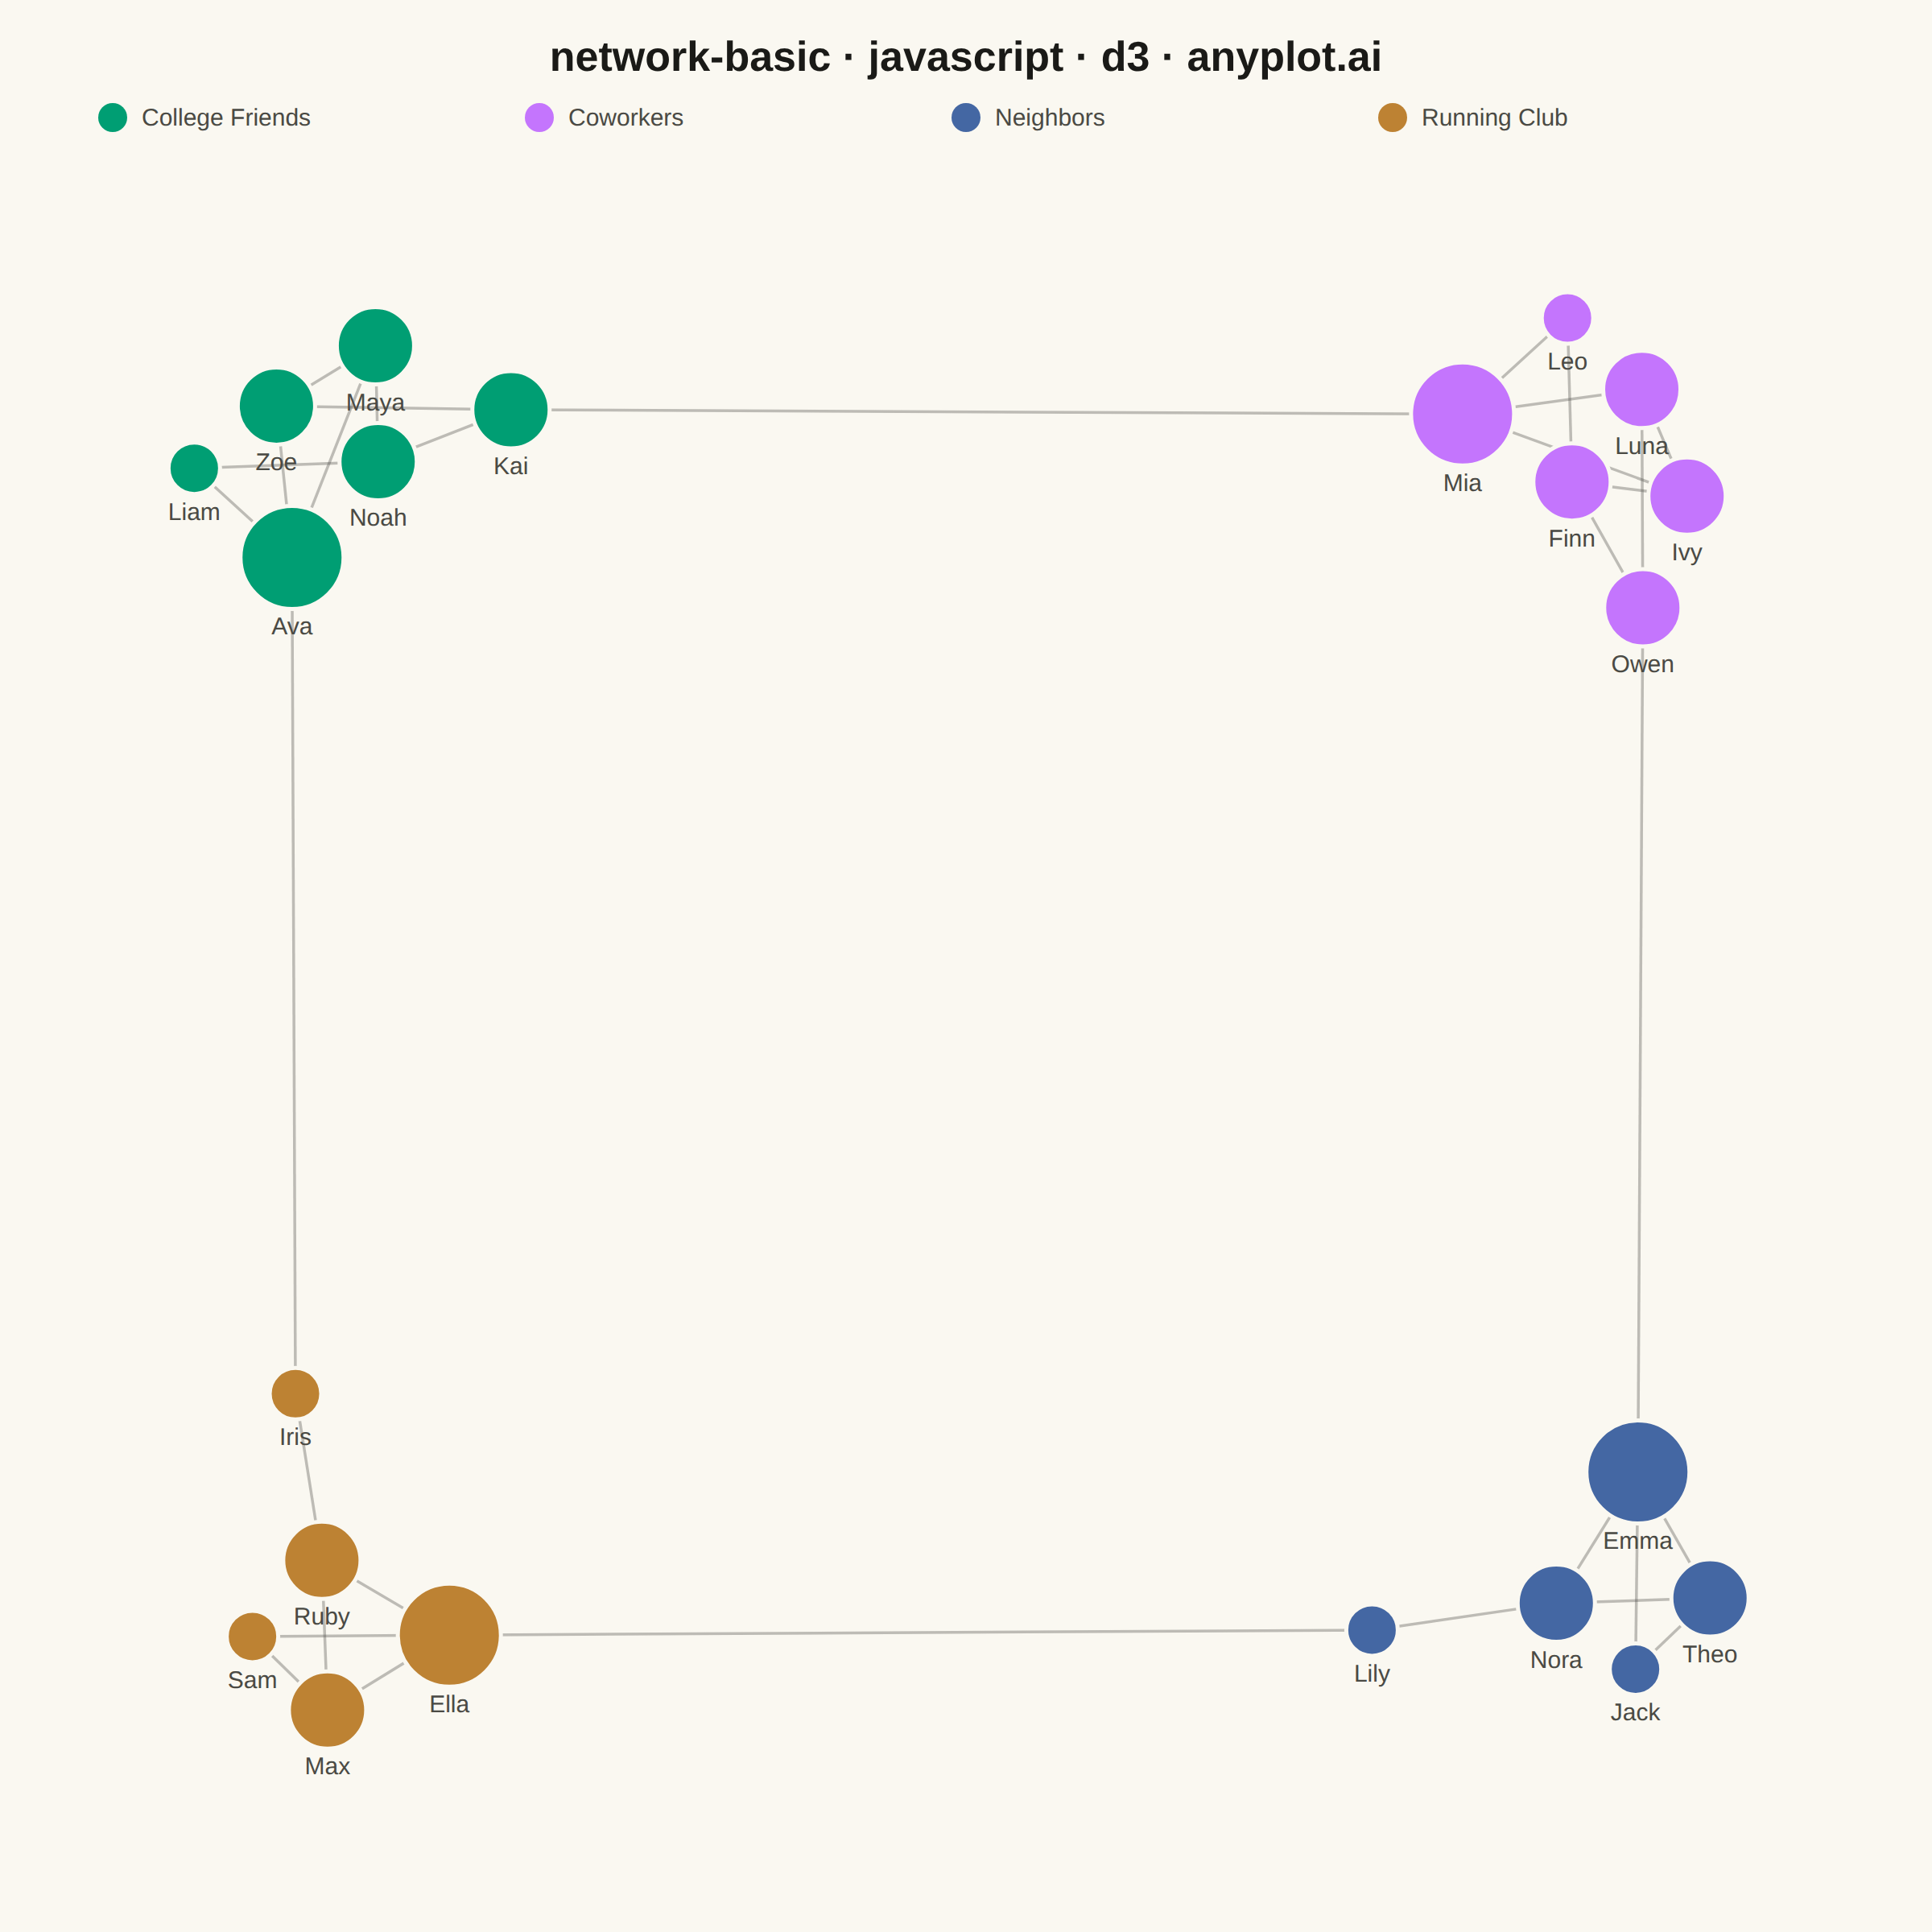
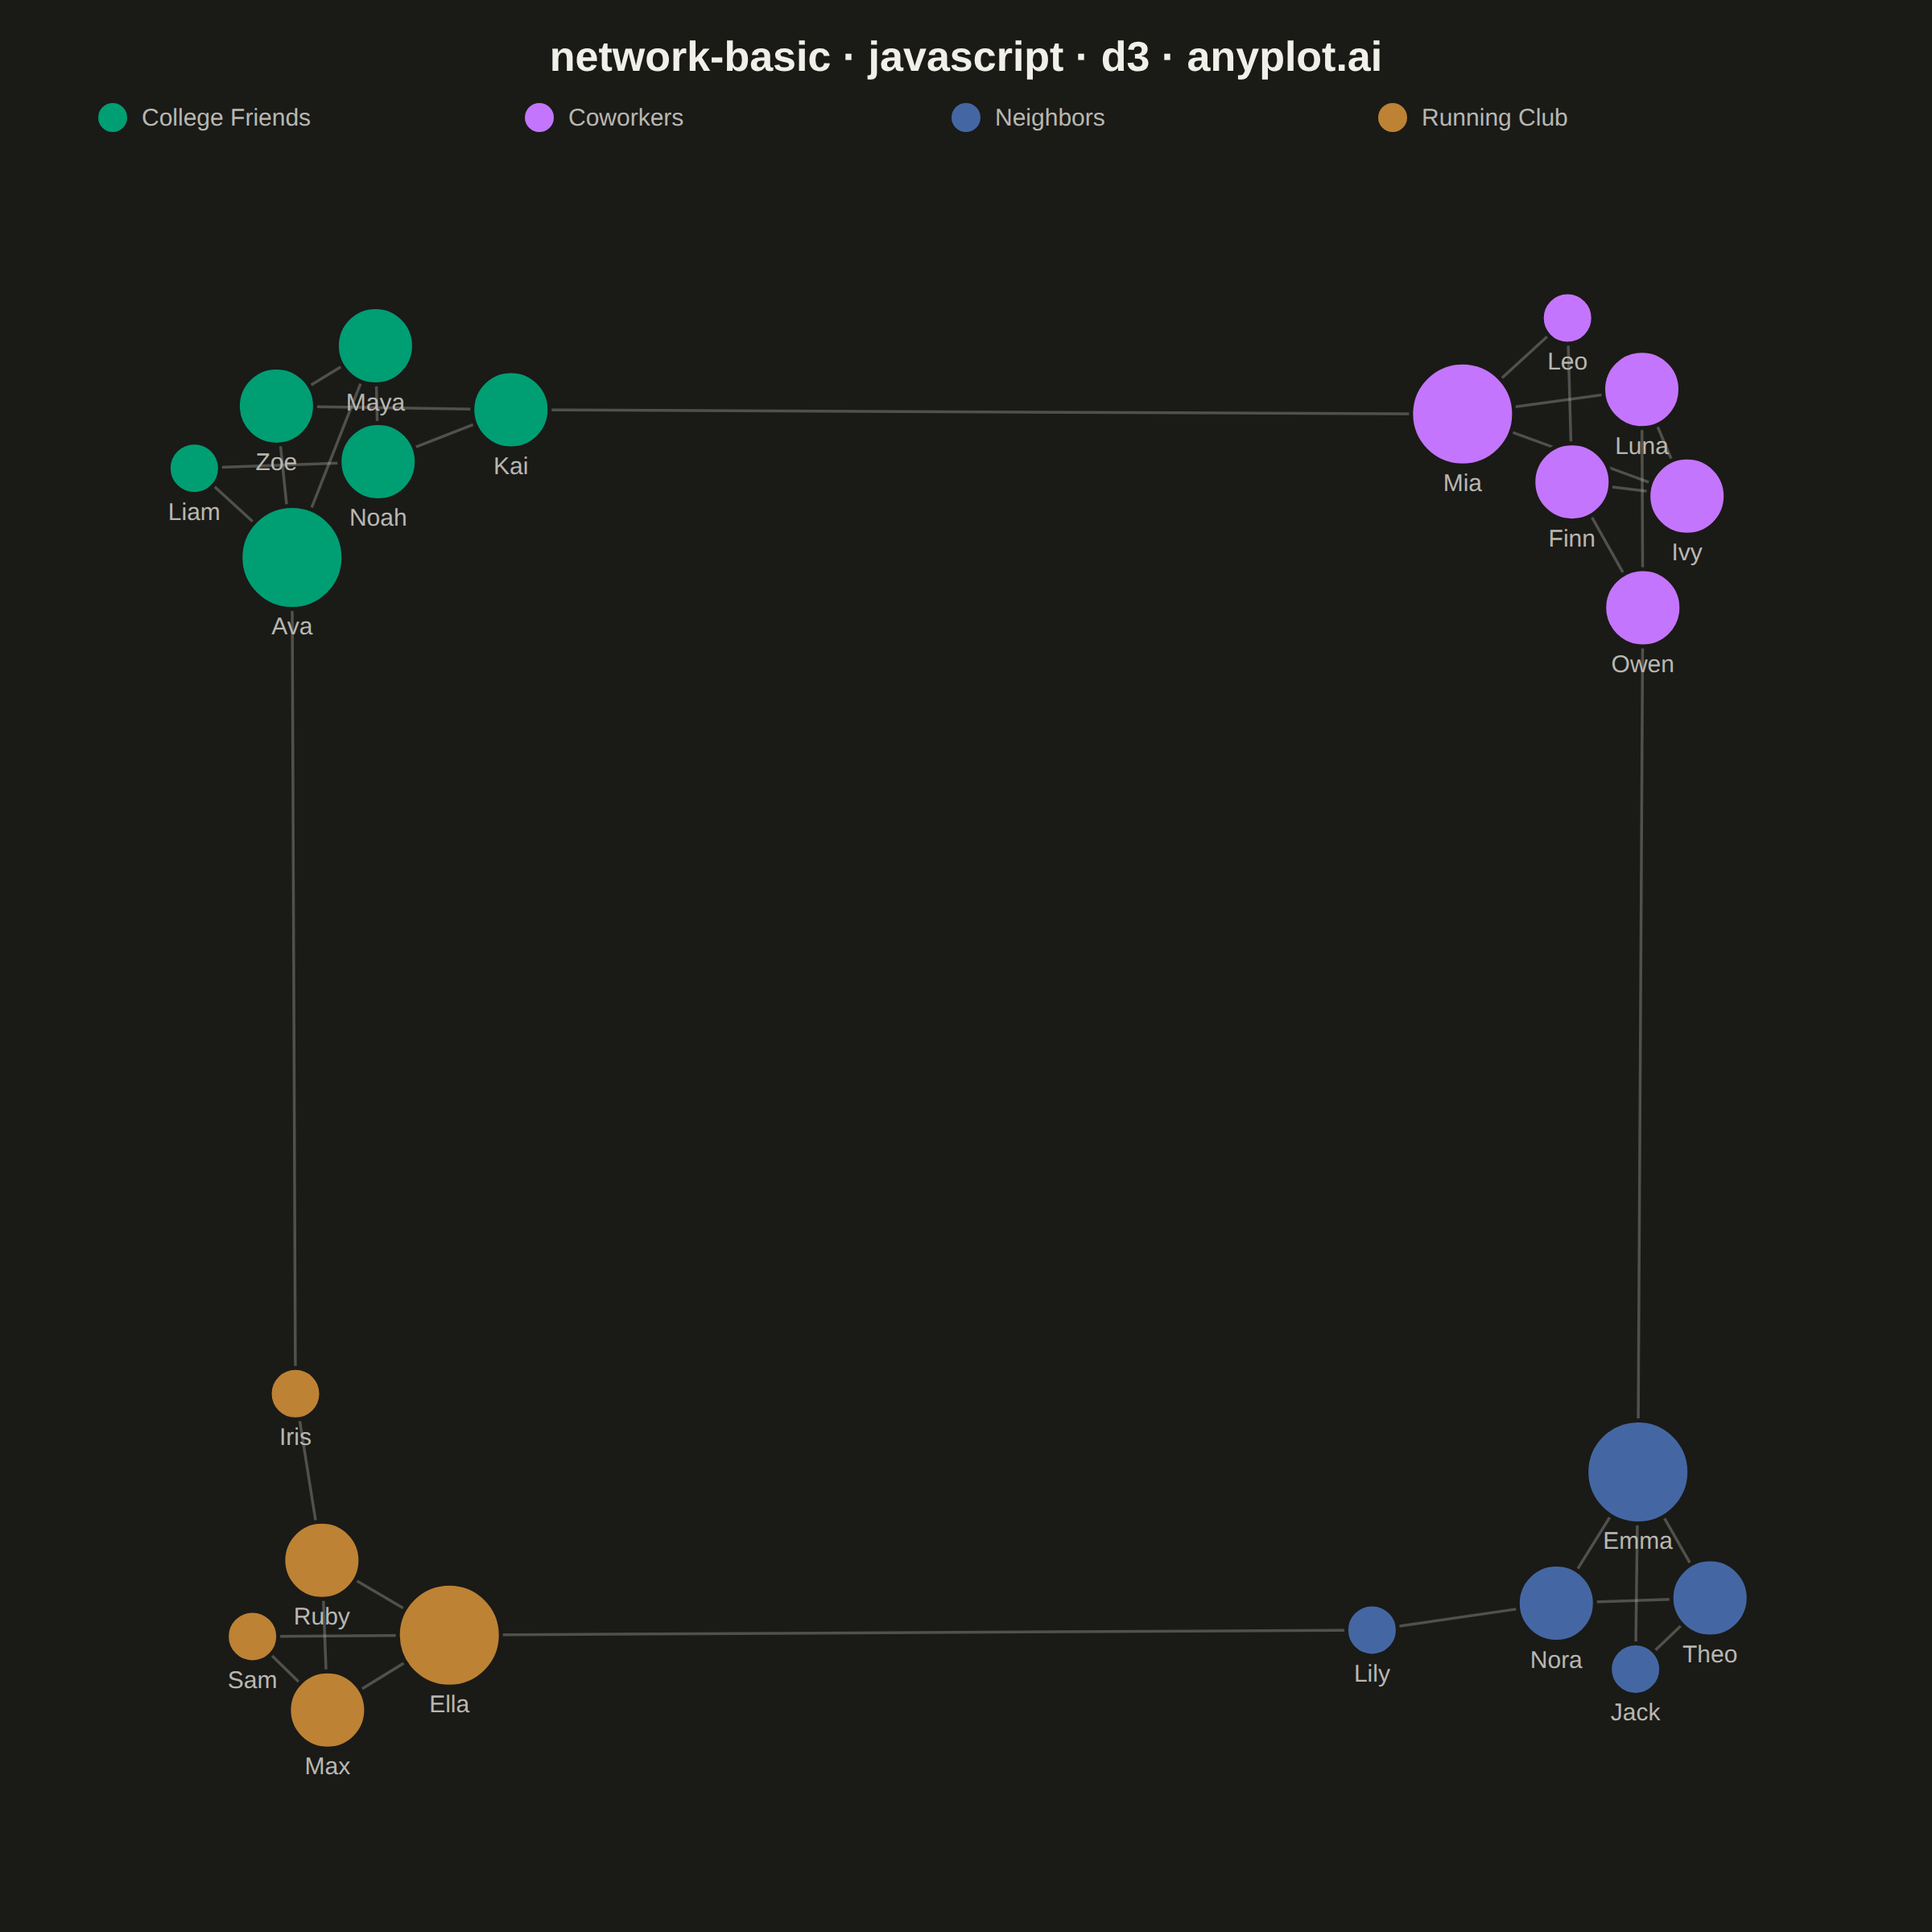
The same plot in 14 other libraries — JavaScript: Chart.js, Apache ECharts, Highcharts, MUI X Charts; Python: Altair, Bokeh, lets-plot, Matplotlib, Plotly, plotnine, Pygal, Seaborn; R: ggplot2; Julia: Makie.jl. Compare all 15 side by side: Basic Network Graph in Python, R, Julia and JavaScript.
A network graph (node-link diagram) visualizes relationships between entities as nodes connected by edges. It reveals the structure of connections, clusters, and central nodes in relational data. Network graphs are essential for understanding complex systems where relationships matter as much as the entities themselves, making hidden patterns of connectivity visible at a glance.
// anyplot.ai
// network-basic: Basic Network Graph
// Library: d3 7.9.0 | JavaScript 22.23.1
// Quality: 93/100 | Created: 2026-07-24

//# anyplot-orientation: square
const t = window.ANYPLOT_TOKENS;
const { width, height } = window.ANYPLOT_SIZE;
const margin = { top: 130, right: 70, bottom: 60, left: 70 };
const iw = width - margin.left - margin.right;
const ih = height - margin.top - margin.bottom;

// --- Data: a small friendship network across four social circles ----------
const circles = ["College Friends", "Coworkers", "Neighbors", "Running Club"];

const nodes = [
  { id: "Ava", group: 0 }, { id: "Liam", group: 0 }, { id: "Maya", group: 0 },
  { id: "Noah", group: 0 }, { id: "Zoe", group: 0 }, { id: "Kai", group: 0 },
  { id: "Mia", group: 1 }, { id: "Leo", group: 1 }, { id: "Ivy", group: 1 },
  { id: "Finn", group: 1 }, { id: "Luna", group: 1 }, { id: "Owen", group: 1 },
  { id: "Emma", group: 2 }, { id: "Jack", group: 2 }, { id: "Nora", group: 2 },
  { id: "Theo", group: 2 }, { id: "Lily", group: 2 },
  { id: "Ella", group: 3 }, { id: "Sam", group: 3 }, { id: "Ruby", group: 3 },
  { id: "Max", group: 3 }, { id: "Iris", group: 3 },
];

const links = [
  // College Friends
  { source: "Ava", target: "Liam" }, { source: "Ava", target: "Maya" },
  { source: "Liam", target: "Noah" }, { source: "Maya", target: "Noah" },
  { source: "Maya", target: "Zoe" }, { source: "Noah", target: "Kai" },
  { source: "Zoe", target: "Kai" }, { source: "Ava", target: "Zoe" },
  // Coworkers
  { source: "Mia", target: "Leo" }, { source: "Mia", target: "Ivy" },
  { source: "Leo", target: "Finn" }, { source: "Ivy", target: "Finn" },
  { source: "Ivy", target: "Luna" }, { source: "Finn", target: "Owen" },
  { source: "Luna", target: "Owen" }, { source: "Mia", target: "Luna" },
  // Neighbors
  { source: "Emma", target: "Jack" }, { source: "Emma", target: "Nora" },
  { source: "Jack", target: "Theo" }, { source: "Nora", target: "Theo" },
  { source: "Nora", target: "Lily" }, { source: "Theo", target: "Emma" },
  // Running Club
  { source: "Ella", target: "Sam" }, { source: "Ella", target: "Ruby" },
  { source: "Sam", target: "Max" }, { source: "Ruby", target: "Max" },
  { source: "Ruby", target: "Iris" }, { source: "Max", target: "Ella" },
  // Bridges between circles
  { source: "Kai", target: "Mia" }, { source: "Owen", target: "Emma" },
  { source: "Lily", target: "Ella" }, { source: "Iris", target: "Ava" },
];

// --- Degree -> node radius (encodes number of connections) -----------------
const degree = new Map(nodes.map((d) => [d.id, 0]));
for (const l of links) {
  degree.set(l.source, degree.get(l.source) + 1);
  degree.set(l.target, degree.get(l.target) + 1);
}
const radiusScale = d3
  .scaleLinear()
  .domain([d3.min(degree.values()), d3.max(degree.values())])
  .range([16, 32]);
for (const d of nodes) d.radius = radiusScale(degree.get(d.id));

// --- Layout: force simulation, ticked to convergence (no animation) --------
// The four social circles are bridged in a ring (0-1, 1-2, 2-3, 3-0). Anchoring
// each group near its own canvas corner (with a strong pull) and stretching the
// bridge links (longer distance, weaker strength than intra-group links) lets
// that ring stretch out to the full square instead of collapsing into a tight
// diagonal band through the center.
const groupAnchor = [
  { x: iw * 0.12, y: ih * 0.14 },
  { x: iw * 0.88, y: ih * 0.14 },
  { x: iw * 0.88, y: ih * 0.86 },
  { x: iw * 0.12, y: ih * 0.86 },
];
const groupById = new Map(nodes.map((d) => [d.id, d.group]));
const sameGroup = (d) => {
  const s = typeof d.source === "object" ? d.source.group : groupById.get(d.source);
  const target = typeof d.target === "object" ? d.target.group : groupById.get(d.target);
  return s === target;
};
const simulation = d3
  .forceSimulation(nodes)
  .force(
    "link",
    d3
      .forceLink(links)
      .id((d) => d.id)
      .distance((d) => (sameGroup(d) ? 90 : 280))
      .strength((d) => (sameGroup(d) ? 0.6 : 0.22)),
  )
  .force("charge", d3.forceManyBody().strength(-280))
  .force("x", d3.forceX((d) => groupAnchor[d.group].x).strength(0.25))
  .force("y", d3.forceY((d) => groupAnchor[d.group].y).strength(0.25))
  .force("collide", d3.forceCollide((d) => d.radius + 12))
  .stop();
for (let i = 0; i < 400; i++) simulation.tick();

const labelPad = 46; // room for the node label drawn beneath each circle
for (const d of nodes) {
  d.x = Math.max(d.radius, Math.min(iw - d.radius, d.x));
  d.y = Math.max(d.radius, Math.min(ih - d.radius - labelPad, d.y));
}

// --- Color: one hue per social circle (abstract groups -> canonical order) -
const color = d3.scaleOrdinal().domain(d3.range(circles.length)).range(t.palette);

// --- SVG mount ---------------------------------------------------------------
const svg = d3.select("#container").append("svg").attr("width", width).attr("height", height);
const g = svg.append("g").attr("transform", `translate(${margin.left},${margin.top})`);

// --- Edges (drawn first, beneath nodes) --------------------------------------
// forceLink().id() resolves link.source/target from ids into node object
// references once the simulation runs, so they carry .x/.y directly here.
g.selectAll("line")
  .data(links)
  .join("line")
  .attr("x1", (d) => d.source.x)
  .attr("y1", (d) => d.source.y)
  .attr("x2", (d) => d.target.x)
  .attr("y2", (d) => d.target.y)
  .attr("stroke", t.inkSoft)
  .attr("stroke-opacity", 0.35)
  .attr("stroke-width", 1.75);

// --- Nodes --------------------------------------------------------------------
g.selectAll("circle")
  .data(nodes)
  .join("circle")
  .attr("cx", (d) => d.x)
  .attr("cy", (d) => d.y)
  .attr("r", (d) => d.radius)
  .attr("fill", (d) => color(d.group))
  .attr("stroke", t.pageBg)
  .attr("stroke-width", 2.5);

// --- Labels ---------------------------------------------------------------
g.selectAll("text.node-label")
  .data(nodes)
  .join("text")
  .attr("class", "node-label")
  .attr("x", (d) => d.x)
  .attr("y", (d) => d.y + d.radius + 16)
  .attr("text-anchor", "middle")
  .attr("fill", t.inkSoft)
  .style("font-size", "15px")
  .text((d) => d.id);

// --- Legend (social circles) -----------------------------------------------
const legend = svg.append("g").attr("transform", `translate(${margin.left}, 78)`);
const legendItem = legend
  .selectAll("g")
  .data(circles)
  .join("g")
  .attr("transform", (d, i) => `translate(${i * (iw / circles.length)}, 0)`);
legendItem
  .append("circle")
  .attr("r", 9)
  .attr("cy", -5)
  .attr("fill", (d, i) => color(i));
legendItem
  .append("text")
  .attr("x", 18)
  .attr("y", 0)
  .attr("fill", t.inkSoft)
  .style("font-size", "15px")
  .text((d) => d);

// --- Title --------------------------------------------------------------------
svg
  .append("text")
  .attr("x", width / 2)
  .attr("y", 44)
  .attr("text-anchor", "middle")
  .attr("fill", t.ink)
  .style("font-size", "26px")
  .style("font-weight", "600")
  .text("network-basic · javascript · d3 · anyplot.ai");
Runnable source as JSON, for any HTTP client: https://api.anyplot.ai/specs/network-basic/d3/code. Any spec id and library id listed in llms-full.txt fit the same URL shape; every URL below is complete and callable.
{
  "spec_id": "network-basic",
  "language": "javascript",
  "library": "d3",
  "page": "https://anyplot.ai/network-basic/javascript/d3",
  "hub": "https://anyplot.ai/network-basic",
  "code_json": "https://api.anyplot.ai/specs/network-basic/d3/code",
  "spec_json": "https://api.anyplot.ai/specs/network-basic",
  "render_light_png": "https://storage.googleapis.com/anyplot-images/plots/network-basic/javascript/d3/plot-light.png",
  "render_dark_png": "https://storage.googleapis.com/anyplot-images/plots/network-basic/javascript/d3/plot-dark.png",
  "interactive_light_html": "https://storage.googleapis.com/anyplot-images/plots/network-basic/javascript/d3/plot-light.html",
  "interactive_dark_html": "https://storage.googleapis.com/anyplot-images/plots/network-basic/javascript/d3/plot-dark.html",
  "quality_score": 93.0,
  "license": "MIT",
  "guide": "https://anyplot.ai/llms.txt"
}
Part of Basic Network Graph on anyplot.ai.