The same plot in 14 other libraries — JavaScript: D3.js, Apache ECharts, Highcharts, MUI X Charts; Python: Altair, Bokeh, lets-plot, Matplotlib, Plotly, plotnine, Pygal, Seaborn; R: ggplot2; Julia: Makie.jl. Compare all 15 side by side: Static Transport Network Diagram in Python, R, Julia and JavaScript.
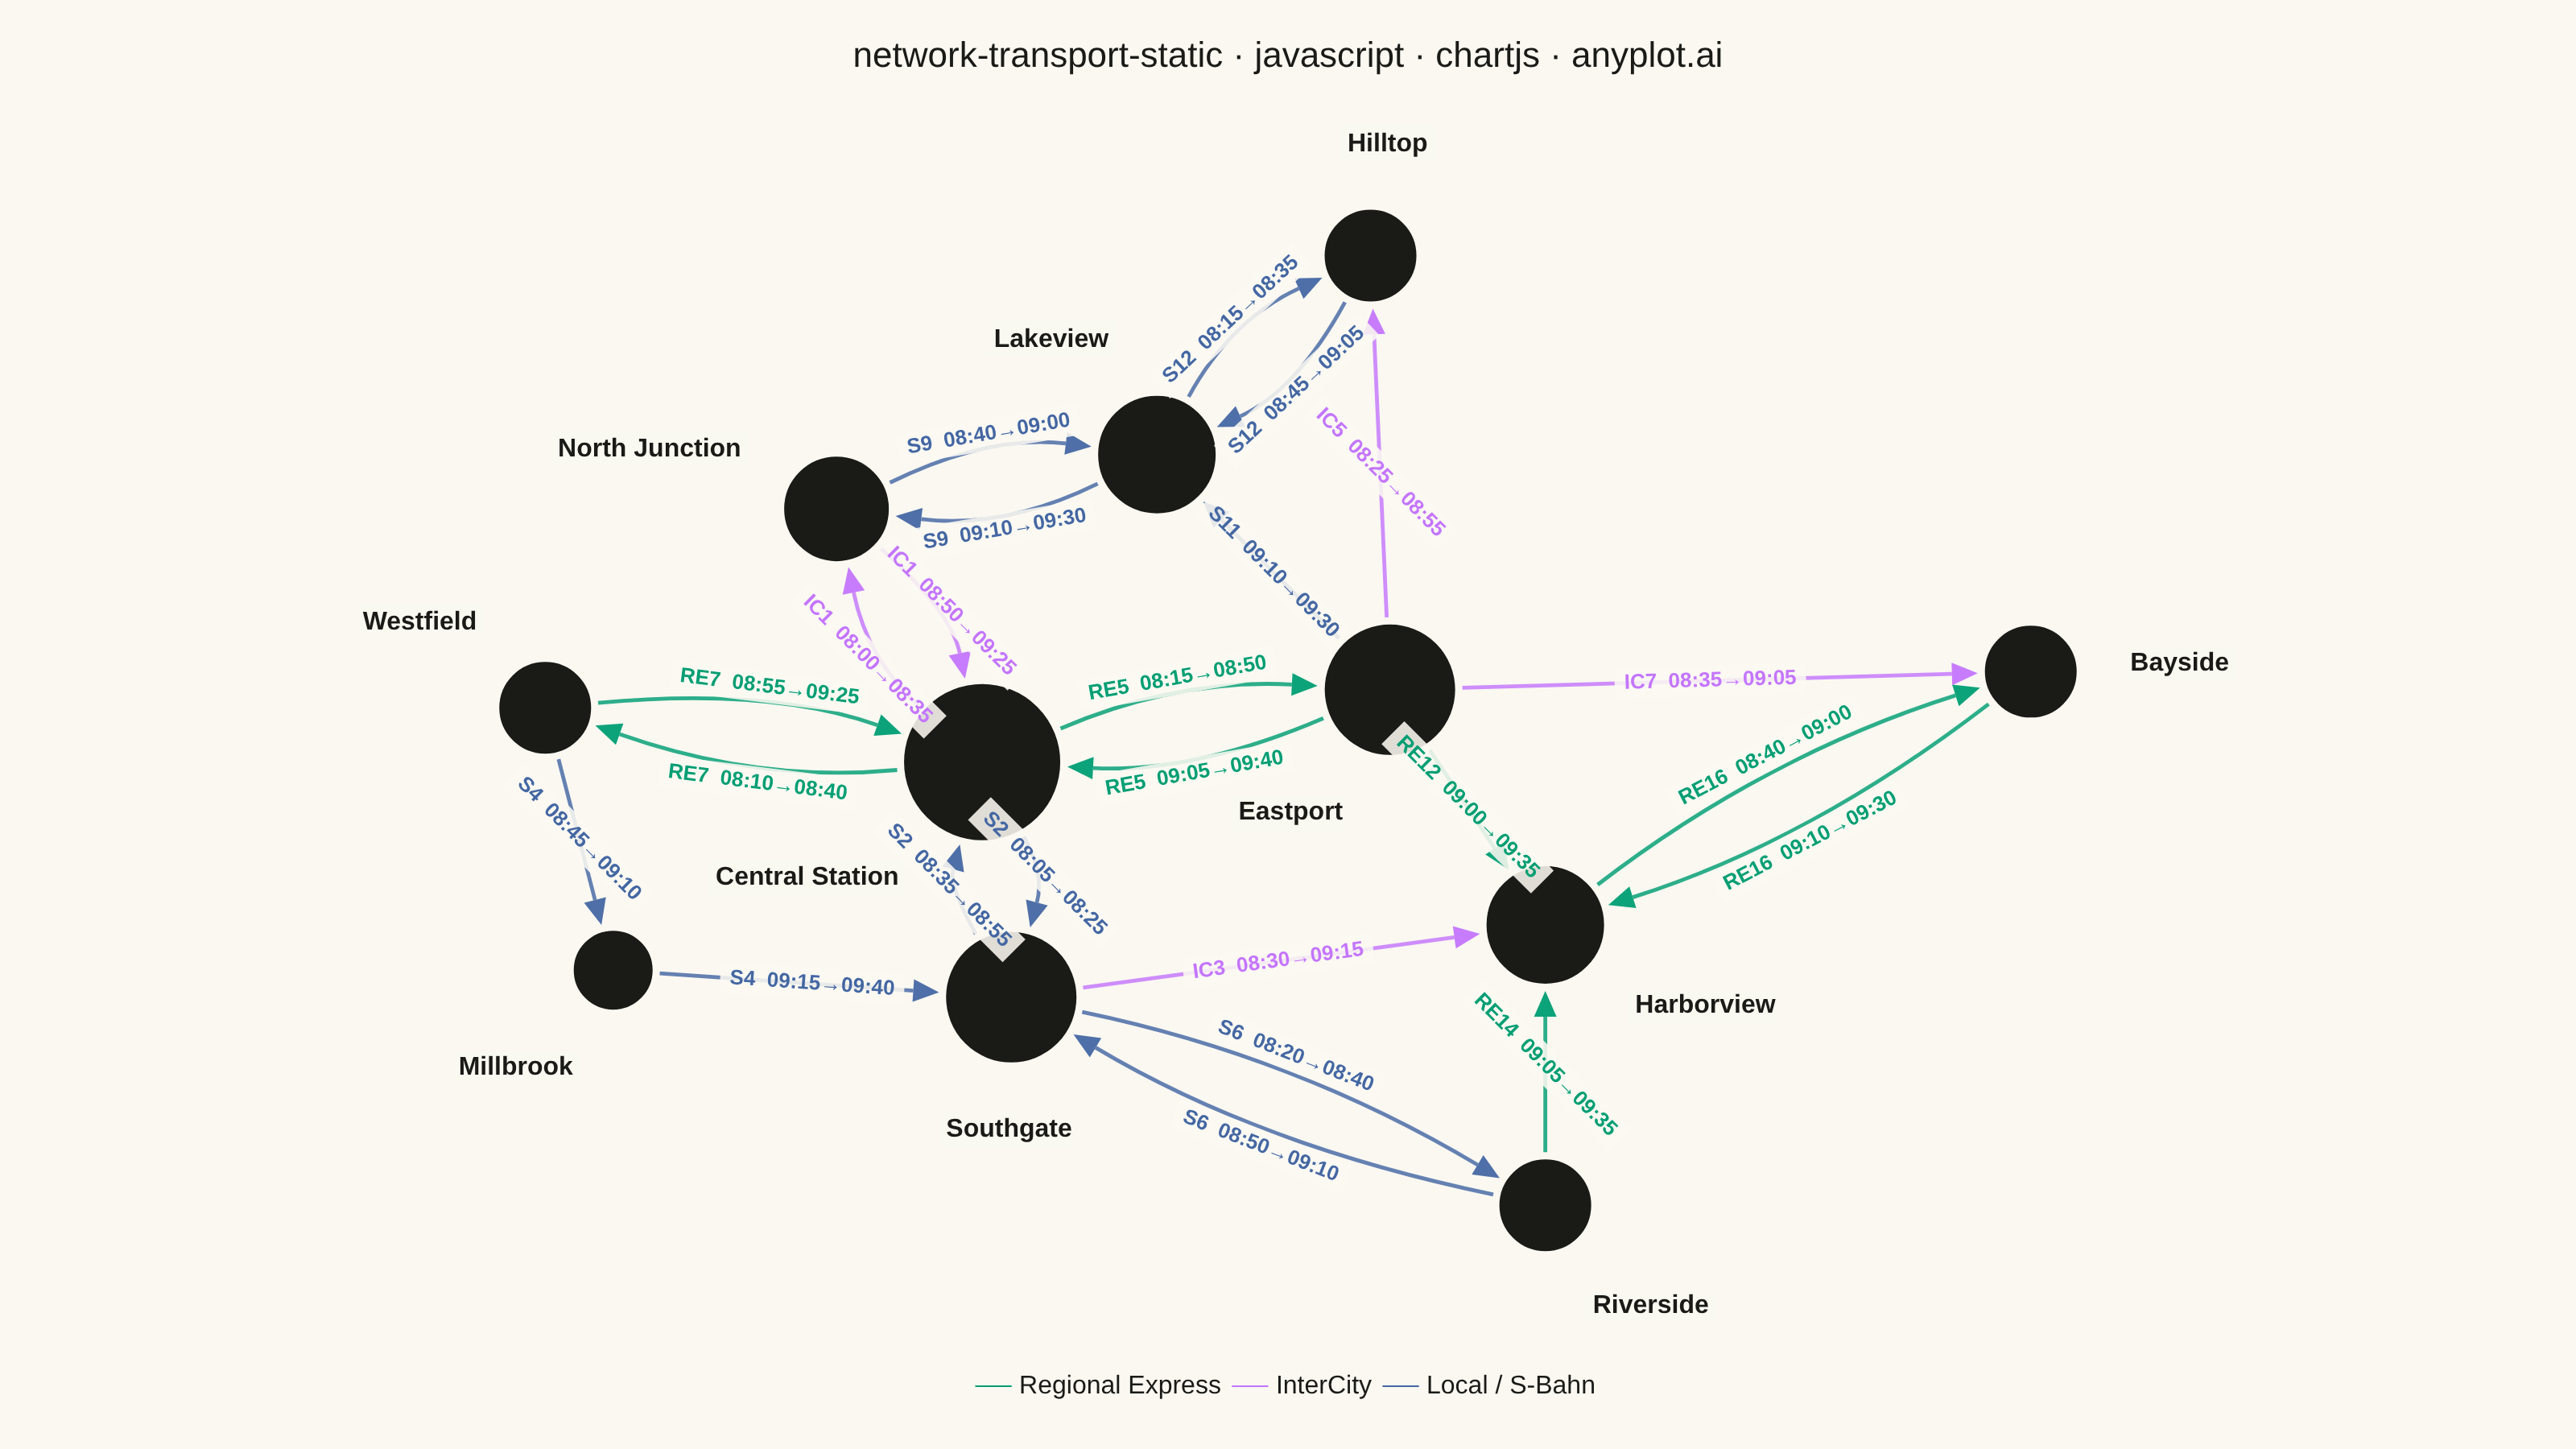
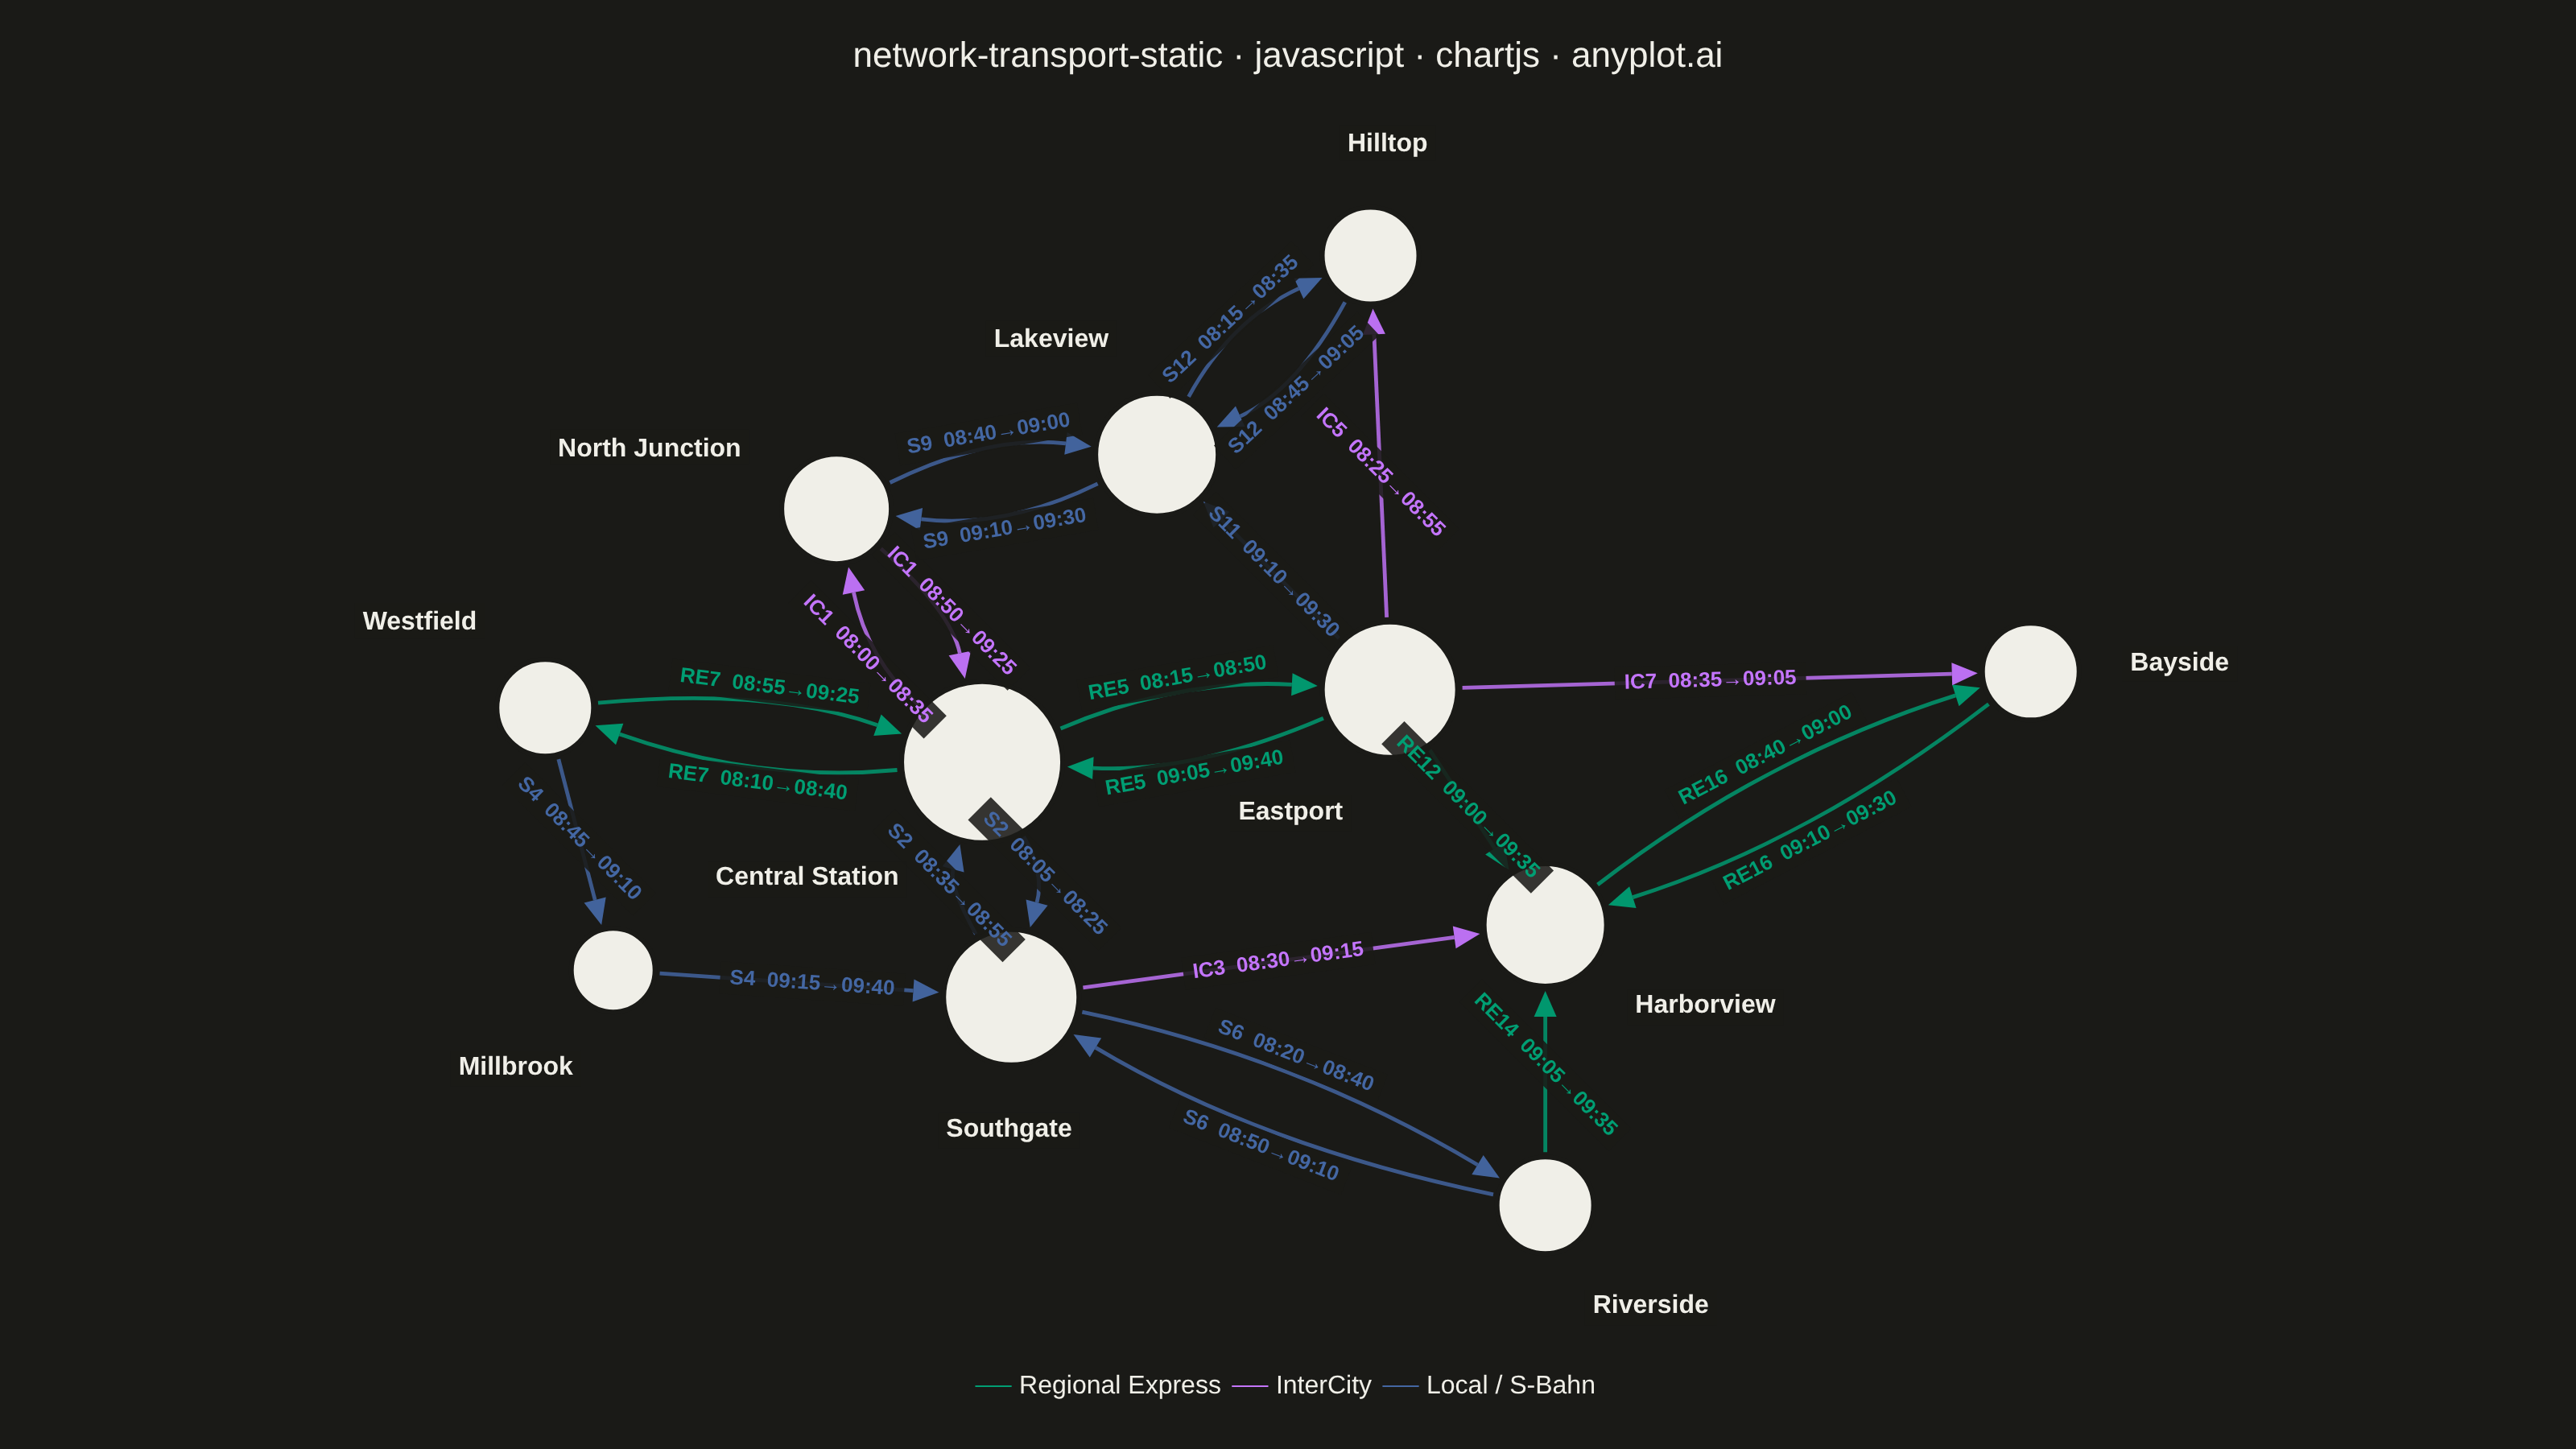
A directed network visualization for transportation systems where stations are displayed as labeled nodes and train/bus routes as directed edges. Edges display departure times, arrival times, and route identifiers. Designed for visualizing timetables, route maps, and connection patterns in rail, bus, or flight networks. This static version focuses on clear, readable presentation without interactive repositioning.
// anyplot.ai
// network-transport-static: Static Transport Network Diagram
// Library: chartjs 4.4.7 | JavaScript 22.23.2
// Quality: 88/100 | Created: 2026-09-02
//# anyplot-orientation: landscape

const t = window.ANYPLOT_TOKENS;

// --- Data: a regional rail network — stations keep their fixed x/y map
// coordinates (no force-directed layout), routes are directed timetabled
// services between them ------------------------------------------------------
const stations = [
  { id: 0, label: "Central Station", x: 0, y: 0 },
  { id: 1, label: "North Junction", x: -1.5, y: 2.8 },
  { id: 2, label: "Eastport", x: 4.2, y: 0.8 },
  { id: 3, label: "Westfield", x: -4.5, y: 0.6 },
  { id: 4, label: "Southgate", x: 0.3, y: -2.6 },
  { id: 5, label: "Lakeview", x: 1.8, y: 3.4 },
  { id: 6, label: "Millbrook", x: -3.8, y: -2.3 },
  { id: 7, label: "Harborview", x: 5.8, y: -1.8 },
  { id: 8, label: "Riverside", x: 5.8, y: -4.9 },
  { id: 9, label: "Hilltop", x: 4.0, y: 5.6 },
  { id: 10, label: "Bayside", x: 10.8, y: 1.0 },
];

// Each entry is one directed, timetabled service. Station pairs served in
// both directions (e.g. 0<->1) are deliberately duplicated with independent
// times, since real timetables run separate outbound/return trains.
const routes = [
  { source: 0, target: 1, routeId: "IC1", departure: "08:00", arrival: "08:35", type: "intercity" },
  { source: 1, target: 0, routeId: "IC1", departure: "08:50", arrival: "09:25", type: "intercity" },
  { source: 0, target: 2, routeId: "RE5", departure: "08:15", arrival: "08:50", type: "express" },
  { source: 2, target: 0, routeId: "RE5", departure: "09:05", arrival: "09:40", type: "express" },
  { source: 0, target: 3, routeId: "RE7", departure: "08:10", arrival: "08:40", type: "express" },
  { source: 3, target: 0, routeId: "RE7", departure: "08:55", arrival: "09:25", type: "express" },
  { source: 0, target: 4, routeId: "S2", departure: "08:05", arrival: "08:25", type: "local" },
  { source: 4, target: 0, routeId: "S2", departure: "08:35", arrival: "08:55", type: "local" },
  { source: 1, target: 5, routeId: "S9", departure: "08:40", arrival: "09:00", type: "local" },
  { source: 5, target: 1, routeId: "S9", departure: "09:10", arrival: "09:30", type: "local" },
  { source: 2, target: 7, routeId: "RE12", departure: "09:00", arrival: "09:35", type: "express" },
  { source: 3, target: 6, routeId: "S4", departure: "08:45", arrival: "09:10", type: "local" },
  { source: 4, target: 7, routeId: "IC3", departure: "08:30", arrival: "09:15", type: "intercity" },
  { source: 6, target: 4, routeId: "S4", departure: "09:15", arrival: "09:40", type: "local" },
  { source: 2, target: 5, routeId: "S11", departure: "09:10", arrival: "09:30", type: "local" },
  { source: 4, target: 8, routeId: "S6", departure: "08:20", arrival: "08:40", type: "local" },
  { source: 8, target: 4, routeId: "S6", departure: "08:50", arrival: "09:10", type: "local" },
  { source: 8, target: 7, routeId: "RE14", departure: "09:05", arrival: "09:35", type: "express" },
  { source: 5, target: 9, routeId: "S12", departure: "08:15", arrival: "08:35", type: "local" },
  { source: 9, target: 5, routeId: "S12", departure: "08:45", arrival: "09:05", type: "local" },
  { source: 2, target: 9, routeId: "IC5", departure: "08:25", arrival: "08:55", type: "intercity" },
  { source: 7, target: 10, routeId: "RE16", departure: "08:40", arrival: "09:00", type: "express" },
  { source: 10, target: 7, routeId: "RE16", departure: "09:10", arrival: "09:30", type: "express" },
  { source: 2, target: 10, routeId: "IC7", departure: "08:35", arrival: "09:05", type: "intercity" },
];

const ROUTE_TYPES = ["express", "intercity", "local"];
const ROUTE_TYPE_LABELS = { express: "Regional Express", intercity: "InterCity", local: "Local / S-Bahn" };
const ROUTE_COLORS = { express: t.palette[0], intercity: t.palette[1], local: t.palette[2] };

// Degree (routes touching a station, either direction) drives node size so
// interchange hubs read as visually larger.
const degree = new Array(stations.length).fill(0);
routes.forEach((route) => {
  degree[route.source] += 1;
  degree[route.target] += 1;
});
const nodeRadius = (id) => 18 + degree[id] * 4;

// Station-pair "lanes": when two or more routes connect the same pair of
// stations, each gets its own curve offset so they never overlap on screen.
const pairGroups = new Map();
routes.forEach((route, idx) => {
  const key = [route.source, route.target].sort((a, b) => a - b).join("-");
  if (!pairGroups.has(key)) pairGroups.set(key, []);
  pairGroups.get(key).push(idx);
});
const laneInfo = new Map();
pairGroups.forEach((idxs) => {
  idxs.forEach((idx, lane) => laneInfo.set(idx, { lane, count: idxs.length }));
});

// --- Data-space scale, expanded to the mount's 16:9 aspect so pixel-per-unit
// is identical on both axes (keeps circles round and arrow angles true) ------
const xs = stations.map((s) => s.x);
const ys = stations.map((s) => s.y);
const xMin = Math.min(...xs);
const xMax = Math.max(...xs);
const yMin = Math.min(...ys);
const yMax = Math.max(...ys);
const centroid = { x: (xMin + xMax) / 2, y: (yMin + yMax) / 2 };
const padFrac = 1.32;
let xRange = (xMax - xMin) * padFrac;
let yRange = (yMax - yMin) * padFrac;
const targetAspect = 16 / 9;
if (xRange / yRange < targetAspect) {
  xRange = yRange * targetAspect;
} else {
  yRange = xRange / targetAspect;
}
const xScaleMin = centroid.x - xRange / 2;
const xScaleMax = centroid.x + xRange / 2;
const yScaleMin = centroid.y - yRange / 2;
const yScaleMax = centroid.y + yRange / 2;

// Perpendicular offset (CSS px) applied per lane when 2+ routes share a
// station pair, so their curves and labels stay clear of each other.
const LANE_OFFSET_PX = 60;
const MOUNT_CSS_WIDTH = 1600;

// Data-space equivalent of LANE_OFFSET_PX (ppu is identical on both axes
// since xRange/yRange are aspect-matched), used to place the invisible
// route hit-points near each curve's real midpoint.
const dataOffsetUnit = xRange * (LANE_OFFSET_PX / MOUNT_CSS_WIDTH);

// --- Mount -------------------------------------------------------------------
const canvas = document.createElement("canvas");
document.getElementById("container").appendChild(canvas);

// --- Edges: curved, arrowed, colored by route type. Drawn under the node
// markers via a lightweight inline plugin (Chart.js's own extension point —
// not a community chartjs-chart-* plugin) ------------------------------------
const routeEdgePlugin = {
  id: "transportEdges",
  beforeDatasetsDraw(chart) {
    const { ctx, scales } = chart;
    const toPx = (x, y) => ({ x: scales.x.getPixelForValue(x), y: scales.y.getPixelForValue(y) });
    ctx.save();
    ctx.lineWidth = 2.4;

    routes.forEach((route, idx) => {
      const from = stations[route.source];
      const to = stations[route.target];
      const S = toPx(from.x, from.y);
      const T = toPx(to.x, to.y);

      // Perpendicular direction from the canonical (low-id -> high-id) axis of
      // this station pair, so both directions of a bidirectional pair curve
      // to two consistent, opposite sides.
      const lo = stations[Math.min(route.source, route.target)];
      const hi = stations[Math.max(route.source, route.target)];
      const loPx = toPx(lo.x, lo.y);
      const hiPx = toPx(hi.x, hi.y);
      const canonLen = Math.max(Math.hypot(hiPx.x - loPx.x, hiPx.y - loPx.y), 1e-6);
      const perpX = -(hiPx.y - loPx.y) / canonLen;
      const perpY = (hiPx.x - loPx.x) / canonLen;
      // Shared chord angle for the whole station pair (not the per-direction
      // curve tangent) so both lanes of a bidirectional pair always render
      // their labels at the same rotation, never fighting each other.
      route._pairAngle = Math.atan2(hiPx.y - loPx.y, hiPx.x - loPx.x);

      const { lane, count } = laneInfo.get(idx);
      const offset = count > 1 ? (lane - (count - 1) / 2) * LANE_OFFSET_PX : 0;
      const midX = (S.x + T.x) / 2 + perpX * offset;
      const midY = (S.y + T.y) / 2 + perpY * offset;

      const startLen = Math.max(Math.hypot(midX - S.x, midY - S.y), 1e-6);
      const startDirX = (midX - S.x) / startLen;
      const startDirY = (midY - S.y) / startLen;
      const endLen = Math.max(Math.hypot(T.x - midX, T.y - midY), 1e-6);
      const endDirX = (T.x - midX) / endLen;
      const endDirY = (T.y - midY) / endLen;

      const startX = S.x + startDirX * (nodeRadius(route.source) + 3);
      const startY = S.y + startDirY * (nodeRadius(route.source) + 3);
      const arrowLen = 16;
      const tipX = T.x - endDirX * (nodeRadius(route.target) + 3);
      const tipY = T.y - endDirY * (nodeRadius(route.target) + 3);
      const baseX = tipX - endDirX * arrowLen;
      const baseY = tipY - endDirY * arrowLen;

      const color = ROUTE_COLORS[route.type];
      ctx.strokeStyle = color;
      ctx.globalAlpha = 0.82;
      ctx.beginPath();
      ctx.moveTo(startX, startY);
      ctx.quadraticCurveTo(midX, midY, baseX, baseY);
      ctx.stroke();

      // Arrowhead — a filled triangle pointing along the curve's end tangent.
      const arrowHalfWidth = 7;
      const perpArrowX = -endDirY;
      const perpArrowY = endDirX;
      ctx.fillStyle = color;
      ctx.globalAlpha = 0.95;
      ctx.beginPath();
      ctx.moveTo(tipX, tipY);
      ctx.lineTo(baseX + perpArrowX * arrowHalfWidth, baseY + perpArrowY * arrowHalfWidth);
      ctx.lineTo(baseX - perpArrowX * arrowHalfWidth, baseY - perpArrowY * arrowHalfWidth);
      ctx.closePath();
      ctx.fill();

      // Cache the curve midpoint for the label plugin below (rotation uses
      // the shared _pairAngle set above, not this curve's own tangent).
      route._mid = { x: midX, y: midY };
    });
    ctx.restore();
  },
};

// --- Labels: route id + departure/arrival on every edge, station names
// anchored outward from the network's centroid so text doesn't sit on top of
// the lines converging on a hub. Drawn on top of everything. ------------------
const labelPlugin = {
  id: "transportLabels",
  afterDatasetsDraw(chart) {
    const { ctx, scales } = chart;
    const toPx = (x, y) => ({ x: scales.x.getPixelForValue(x), y: scales.y.getPixelForValue(y) });
    ctx.save();

    ctx.font = "600 13px sans-serif";
    ctx.textBaseline = "middle";
    ctx.textAlign = "center";
    routes.forEach((route) => {
      const { x, y } = route._mid;
      let angle = route._pairAngle;
      if (angle > Math.PI / 2 || angle < -Math.PI / 2) angle += Math.PI;
      // Clamp near-vertical labels to a readable max tilt instead of following
      // the chord exactly (a steep edge would otherwise force a head-tilt).
      const maxLabelAngle = Math.PI / 4;
      if (angle > maxLabelAngle) angle = maxLabelAngle;
      if (angle < -maxLabelAngle) angle = -maxLabelAngle;
      const text = `${route.routeId}  ${route.departure}→${route.arrival}`;
      const { width } = ctx.measureText(text);
      const boxW = width + 12;
      const boxH = 20;

      ctx.save();
      ctx.translate(x, y);
      ctx.rotate(angle);
      ctx.fillStyle = t.pageBg;
      ctx.globalAlpha = 0.88;
      ctx.fillRect(-boxW / 2, -boxH / 2, boxW, boxH);
      ctx.globalAlpha = 1;
      ctx.fillStyle = ROUTE_COLORS[route.type];
      ctx.fillText(text, 0, 0);
      ctx.restore();
    });

    // Direction each station's own routes leave it in (pixel space), so the
    // outward label can steer clear of them instead of blindly following the
    // centroid direction (which can coincide exactly with an incident edge,
    // e.g. a hub station whose only westward neighbor is also due west of it).
    const incidentDirs = new Map(stations.map((s) => [s.id, []]));
    routes.forEach((route) => {
      const a = toPx(stations[route.source].x, stations[route.source].y);
      const b = toPx(stations[route.target].x, stations[route.target].y);
      const abLen = Math.max(Math.hypot(b.x - a.x, b.y - a.y), 1e-6);
      incidentDirs.get(route.source).push({ x: (b.x - a.x) / abLen, y: (b.y - a.y) / abLen });
      incidentDirs.get(route.target).push({ x: (a.x - b.x) / abLen, y: (a.y - b.y) / abLen });
    });

    const centroidPx = toPx(centroid.x, centroid.y);
    ctx.font = "700 16px sans-serif";
    stations.forEach((station) => {
      const p = toPx(station.x, station.y);
      let dx = p.x - centroidPx.x;
      let dy = p.y - centroidPx.y;
      const len = Math.hypot(dx, dy);
      if (len < 8) {
        dx = 0;
        dy = -1;
      } else {
        dx /= len;
        dy /= len;
        // Among 8 candidate directions (the centroid-outward direction plus
        // 45-degree rotations of it), pick whichever stays furthest from
        // every route leaving this station (lowest worst-case alignment with
        // an incident edge) — a hub can easily have 4+ edges roughly 90
        // degrees apart, so only sampling 90-degree rotations can leave every
        // candidate pinned to an edge; 45-degree steps find the gap between.
        const candidates = Array.from({ length: 8 }, (_, k) => {
          const theta = (k * Math.PI) / 4;
          const cos = Math.cos(theta);
          const sin = Math.sin(theta);
          return { x: dx * cos - dy * sin, y: dx * sin + dy * cos };
        });
        const neighborDirs = incidentDirs.get(station.id);
        let best = candidates[0];
        let bestWorstAlignment = Infinity;
        candidates.forEach((c) => {
          const worstAlignment = neighborDirs.reduce((m, n) => Math.max(m, c.x * n.x + c.y * n.y), -Infinity);
          if (worstAlignment < bestWorstAlignment) {
            bestWorstAlignment = worstAlignment;
            best = c;
          }
        });
        dx = best.x;
        dy = best.y;
      }
      const offset = nodeRadius(station.id) + 32;
      const labelX = p.x + dx * offset;
      const labelY = p.y + dy * offset;

      ctx.textAlign = Math.abs(dx) < 0.35 ? "center" : dx > 0 ? "left" : "right";
      ctx.textBaseline = Math.abs(dy) < 0.35 ? "middle" : dy > 0 ? "top" : "bottom";
      const { width } = ctx.measureText(station.label);
      const padX = 5;
      let boxX = labelX - padX;
      if (ctx.textAlign === "center") boxX = labelX - width / 2 - padX;
      if (ctx.textAlign === "right") boxX = labelX - width - padX;
      let boxY = labelY - 11;
      if (ctx.textBaseline === "top") boxY = labelY - 2;
      if (ctx.textBaseline === "bottom") boxY = labelY - 20;

      ctx.fillStyle = t.pageBg;
      ctx.globalAlpha = 0.92;
      ctx.fillRect(boxX, boxY, width + padX * 2, 22);
      ctx.globalAlpha = 1;
      ctx.fillStyle = t.ink;
      ctx.fillText(station.label, labelX, labelY);
    });

    ctx.restore();
  },
};

// --- Datasets: real station markers, plus zero-data "swatch" datasets so the
// three route types get a legend entry (color-coded route type per spec) ----
const nodeDataset = {
  label: "Stations",
  data: stations.map((s) => ({ x: s.x, y: s.y })),
  backgroundColor: t.ink,
  borderColor: t.pageBg,
  borderWidth: 3,
  pointRadius: stations.map((s) => nodeRadius(s.id)),
  pointHoverRadius: stations.map((s) => nodeRadius(s.id) + 4),
  showLine: false,
};

const legendSwatches = ROUTE_TYPES.map((type) => ({
  label: ROUTE_TYPE_LABELS[type],
  data: [],
  backgroundColor: ROUTE_COLORS[type],
  borderColor: ROUTE_COLORS[type],
  pointStyle: "line",
  showLine: false,
}));

// Invisible hit-testable points at each route's curve midpoint (approximated
// in data space, same lane-offset logic as the pixel-space edge plugin above)
// so hovering an edge shows its full route details, not just station degree.
const routeHitDataset = {
  label: "Routes",
  data: routes.map((route, idx) => {
    const from = stations[route.source];
    const to = stations[route.target];
    const lo = stations[Math.min(route.source, route.target)];
    const hi = stations[Math.max(route.source, route.target)];
    const canonLen = Math.max(Math.hypot(hi.x - lo.x, hi.y - lo.y), 1e-6);
    const perpX = -(hi.y - lo.y) / canonLen;
    const perpY = (hi.x - lo.x) / canonLen;
    const { lane, count } = laneInfo.get(idx);
    const offsetMag = count > 1 ? (lane - (count - 1) / 2) * dataOffsetUnit : 0;
    return { x: (from.x + to.x) / 2 + perpX * offsetMag, y: (from.y + to.y) / 2 + perpY * offsetMag };
  }),
  backgroundColor: "rgba(0, 0, 0, 0)",
  borderColor: "rgba(0, 0, 0, 0)",
  pointRadius: 0,
  pointHoverRadius: 0,
  pointHitRadius: 14,
  showLine: false,
};

// --- Chart ---------------------------------------------------------------
new Chart(canvas, {
  type: "scatter",
  data: { datasets: [...legendSwatches, nodeDataset, routeHitDataset] },
  plugins: [routeEdgePlugin, labelPlugin],
  options: {
    responsive: true,
    maintainAspectRatio: false,
    animation: false,
    layout: {
      padding: { top: 10, right: 20, bottom: 10, left: 20 },
    },
    plugins: {
      title: {
        display: true,
        text: "network-transport-static · javascript · chartjs · anyplot.ai",
        color: t.ink,
        font: { size: 22, weight: "normal" },
        padding: { top: 12, bottom: 16 },
      },
      legend: {
        display: true,
        position: "bottom",
        labels: {
          color: t.ink,
          font: { size: 16 },
          usePointStyle: true,
          boxWidth: 24,
          filter: (item) => item.text !== "Stations" && item.text !== "Routes",
        },
      },
      tooltip: {
        callbacks: {
          title: (items) => {
            if (!items.length) return "";
            const ds = items[0].chart.data.datasets[items[0].datasetIndex];
            if (ds.label === "Stations") return stations[items[0].dataIndex].label;
            if (ds.label === "Routes") return routes[items[0].dataIndex].routeId;
            return "";
          },
          label: (item) => {
            const ds = item.chart.data.datasets[item.datasetIndex];
            if (ds.label === "Stations") {
              const station = stations[item.dataIndex];
              return `${degree[station.id]} services`;
            }
            if (ds.label === "Routes") {
              const route = routes[item.dataIndex];
              return `${route.departure} → ${route.arrival} (${ROUTE_TYPE_LABELS[route.type]})`;
            }
            return "";
          },
        },
      },
    },
    scales: {
      x: { display: false, min: xScaleMin, max: xScaleMax },
      y: { display: false, min: yScaleMin, max: yScaleMax },
    },
  },
});
Runnable source as JSON, for any HTTP client: https://api.anyplot.ai/specs/network-transport-static/chartjs/code. Any spec id and library id listed in llms-full.txt fit the same URL shape; every URL below is complete and callable.
{
  "spec_id": "network-transport-static",
  "language": "javascript",
  "library": "chartjs",
  "page": "https://anyplot.ai/network-transport-static/javascript/chartjs",
  "hub": "https://anyplot.ai/network-transport-static",
  "code_json": "https://api.anyplot.ai/specs/network-transport-static/chartjs/code",
  "spec_json": "https://api.anyplot.ai/specs/network-transport-static",
  "render_light_png": "https://storage.googleapis.com/anyplot-images/plots/network-transport-static/javascript/chartjs/plot-light.png",
  "render_dark_png": "https://storage.googleapis.com/anyplot-images/plots/network-transport-static/javascript/chartjs/plot-dark.png",
  "interactive_light_html": "https://storage.googleapis.com/anyplot-images/plots/network-transport-static/javascript/chartjs/plot-light.html",
  "interactive_dark_html": "https://storage.googleapis.com/anyplot-images/plots/network-transport-static/javascript/chartjs/plot-dark.html",
  "quality_score": 88.0,
  "license": "MIT",
  "guide": "https://anyplot.ai/llms.txt"
}
Part of Static Transport Network Diagram on anyplot.ai.