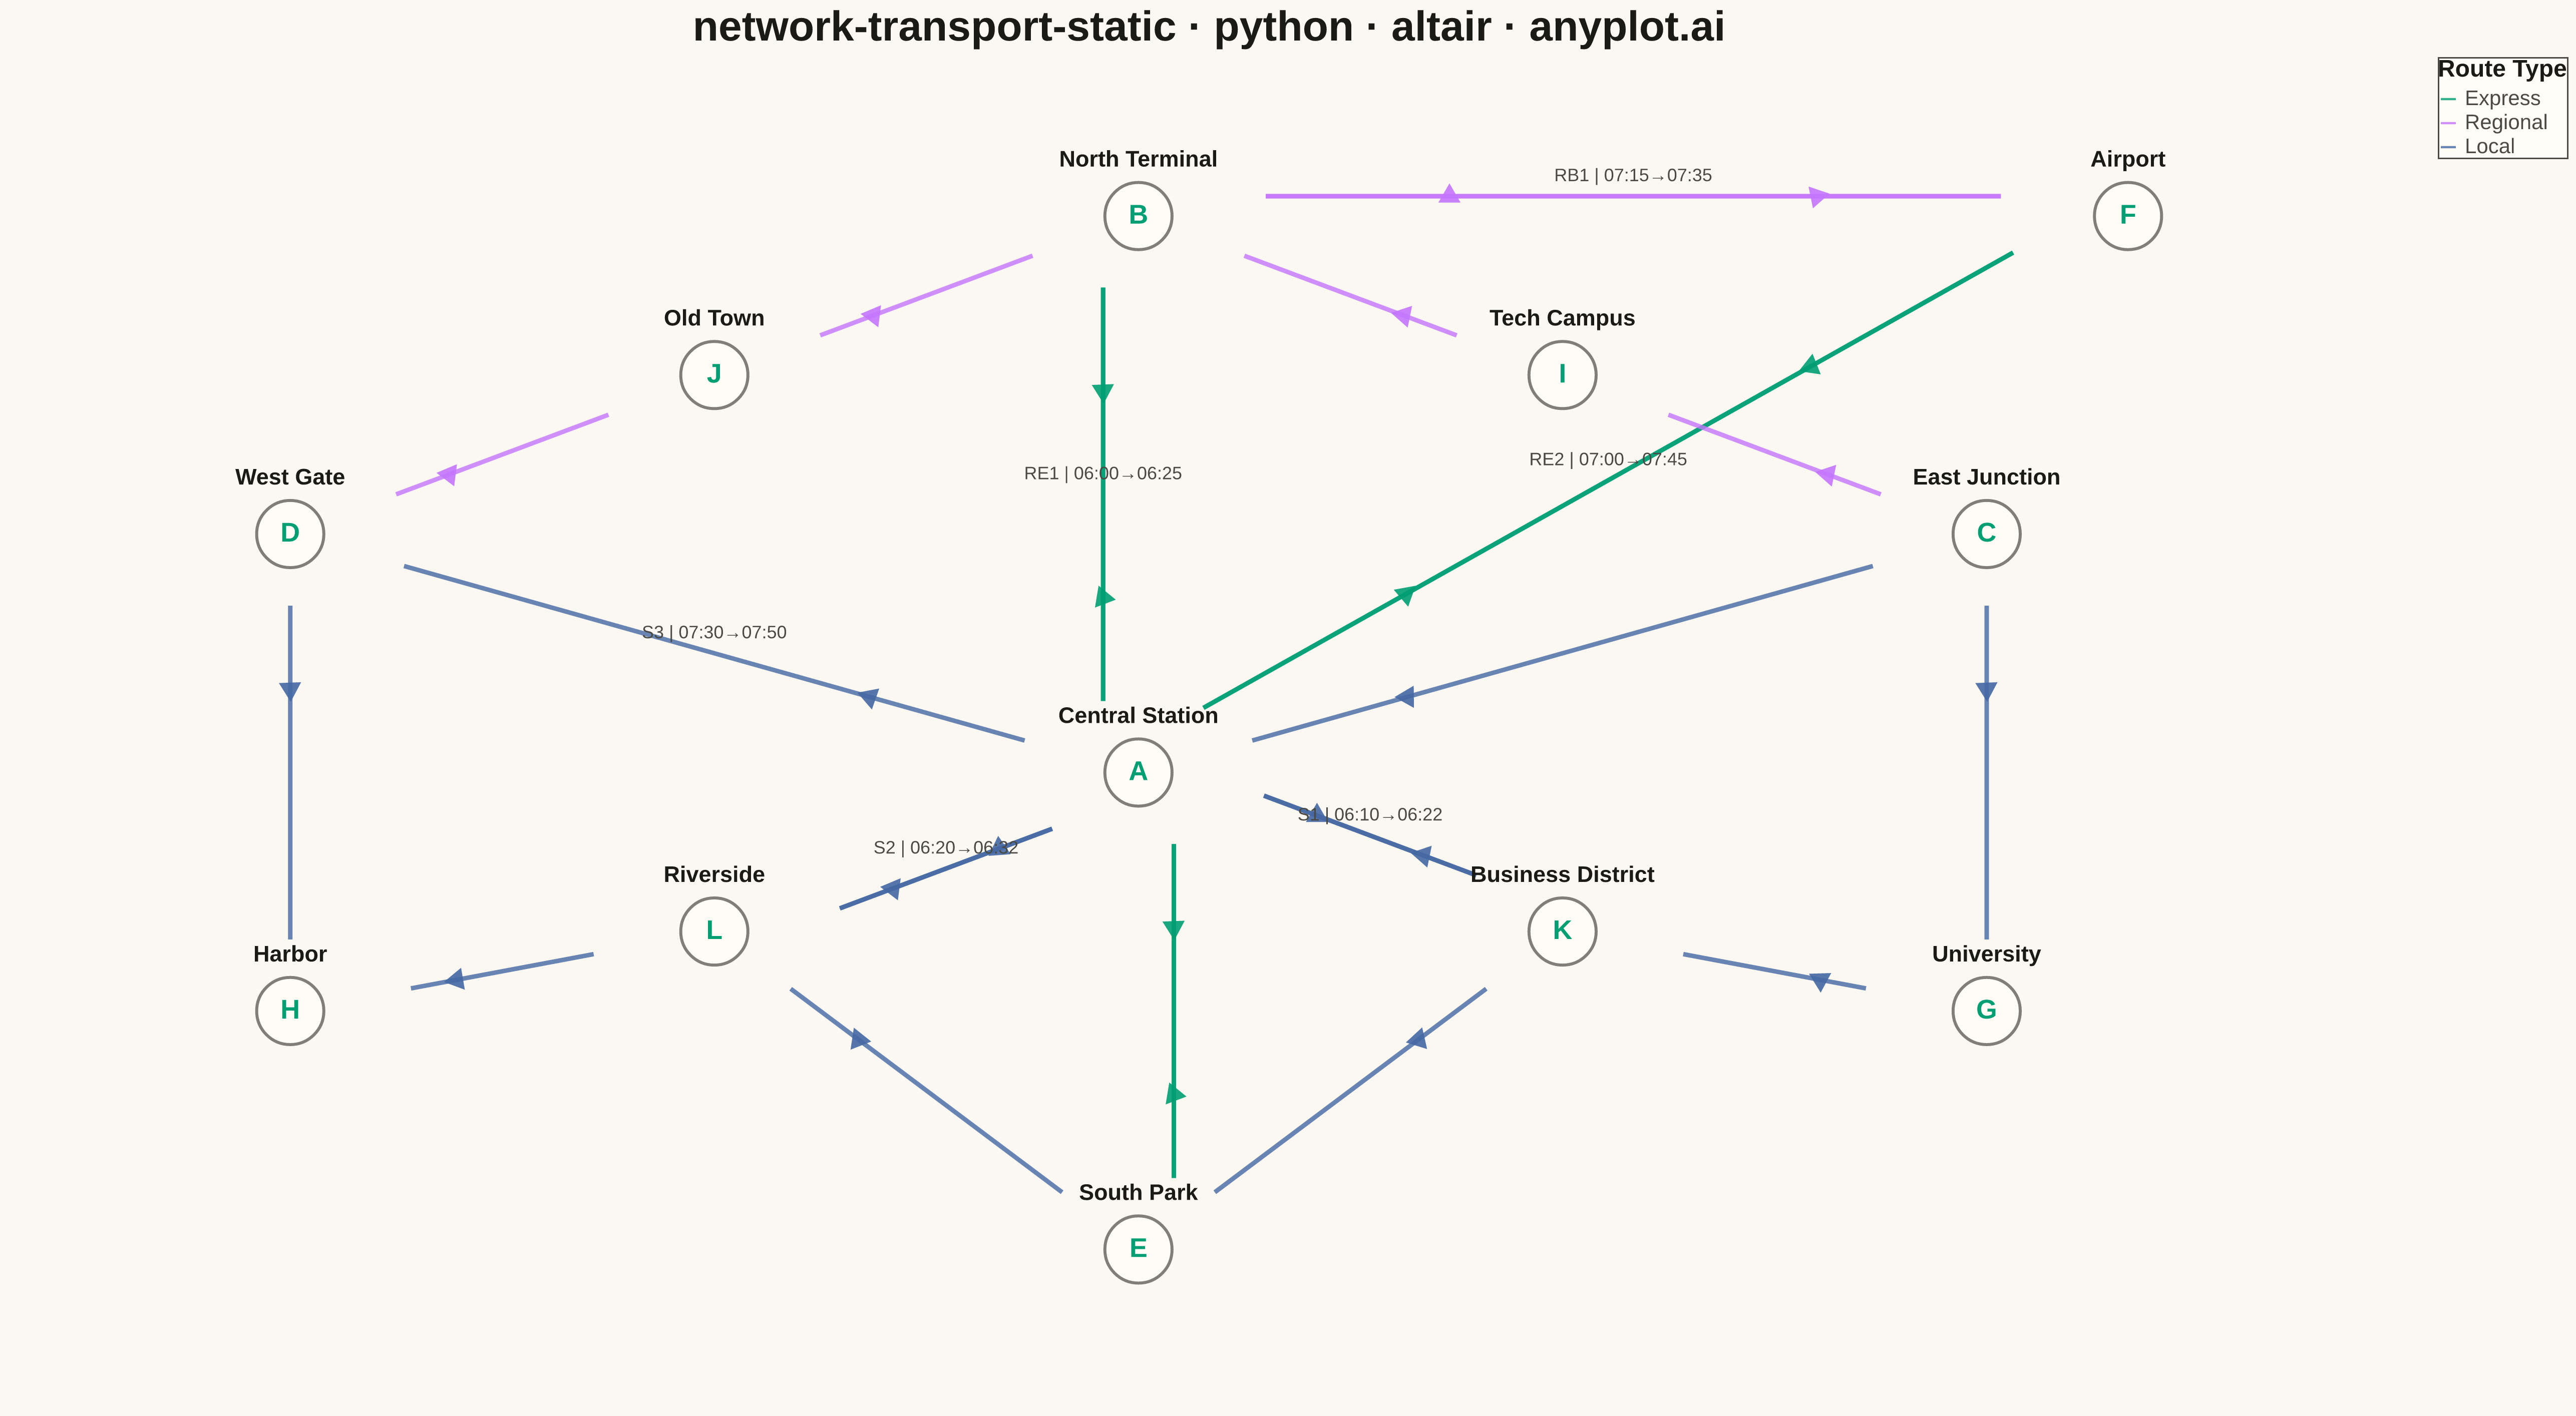
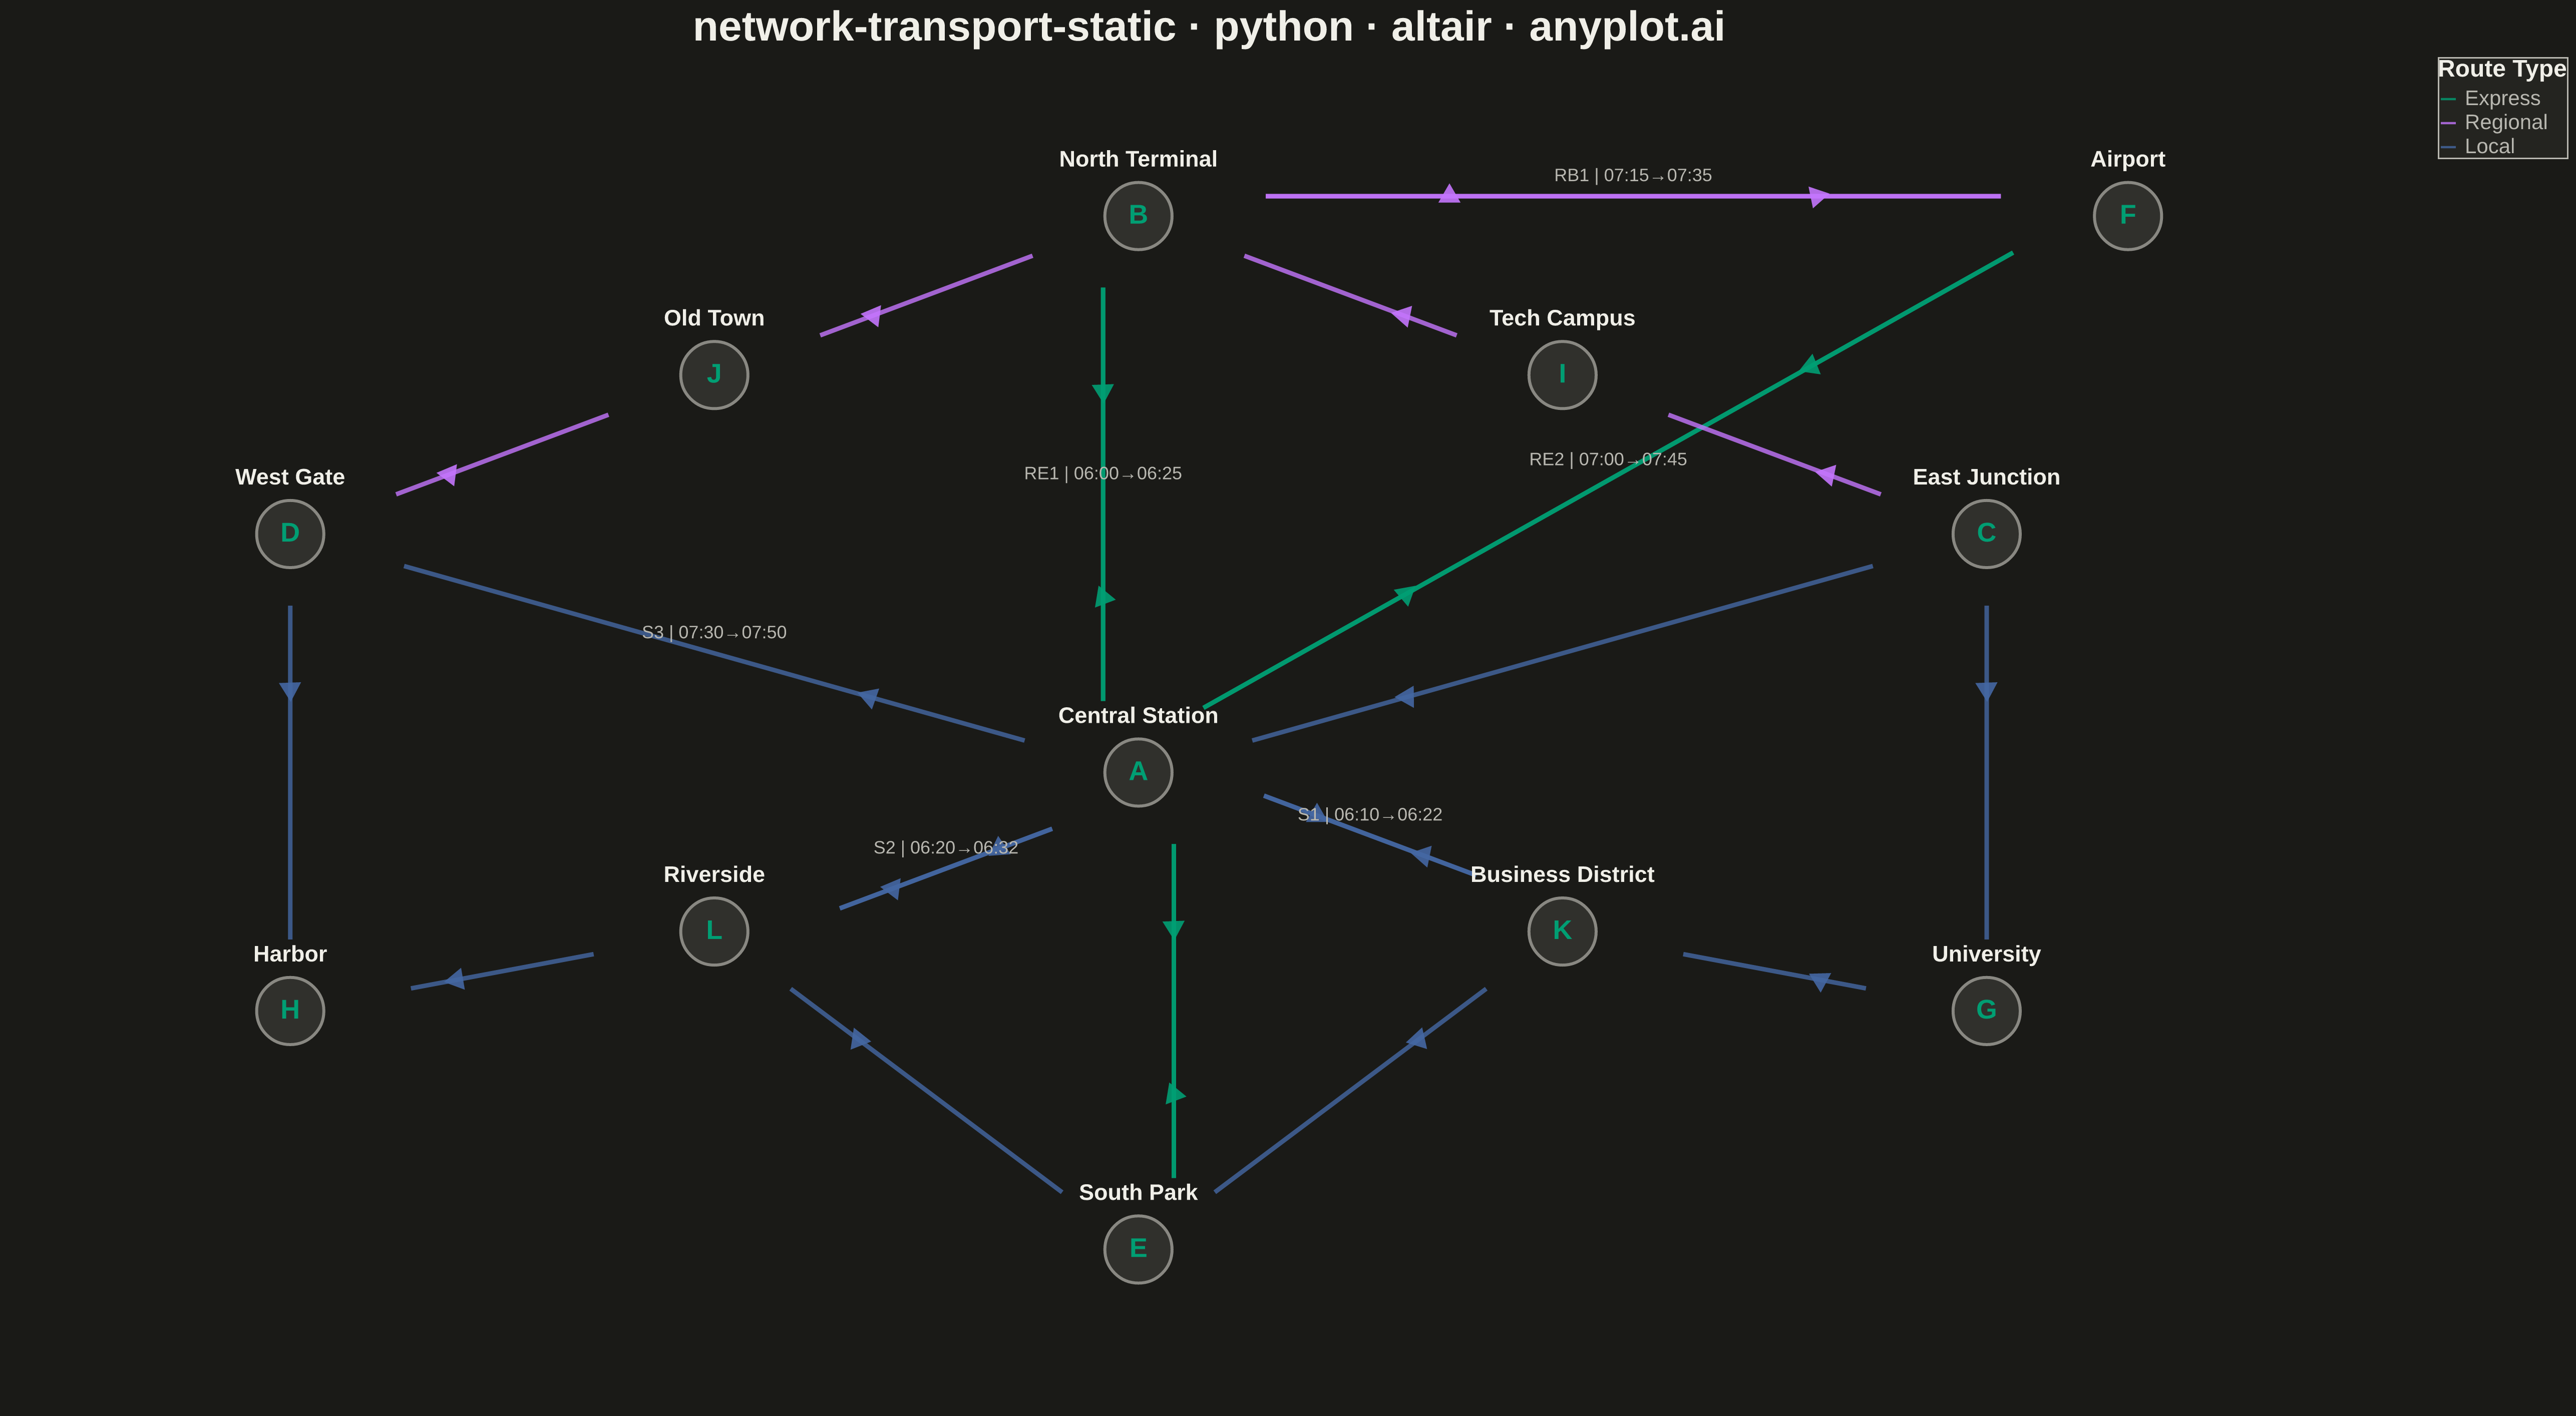
A directed network visualization for transportation systems where stations are displayed as labeled nodes and train/bus routes as directed edges. Edges display departure times, arrival times, and route identifiers. Designed for visualizing timetables, route maps, and connection patterns in rail, bus, or flight networks. This static version focuses on clear, readable presentation without interactive repositioning.
""" anyplot.ai
network-transport-static: Static Transport Network Diagram
Library: altair 6.1.0 | Python 3.13.13
Quality: 87/100 | Updated: 2026-05-18
"""

import os
import sys


# Handle naming conflict: remove script dir from path before importing
script_dir = os.path.dirname(os.path.abspath(__file__))
sys.path = [p for p in sys.path if os.path.abspath(p) != script_dir]

import altair as alt
import numpy as np
import pandas as pd


np.random.seed(42)

# Theme tokens
THEME = os.getenv("ANYPLOT_THEME", "light")
PAGE_BG = "#FAF8F1" if THEME == "light" else "#1A1A17"
ELEVATED_BG = "#FFFDF6" if THEME == "light" else "#242420"
INK = "#1A1A17" if THEME == "light" else "#F0EFE8"
INK_SOFT = "#4A4A44" if THEME == "light" else "#B8B7B0"

# Okabe-Ito palette (first series always #009E73)
IMPRINT = ["#009E73", "#C475FD", "#4467A3"]

# Station data - Regional rail network
stations = [
    {"id": "A", "label": "Central Station", "x": 400, "y": 450},
    {"id": "B", "label": "North Terminal", "x": 400, "y": 100},
    {"id": "C", "label": "East Junction", "x": 700, "y": 300},
    {"id": "D", "label": "West Gate", "x": 100, "y": 300},
    {"id": "E", "label": "South Park", "x": 400, "y": 750},
    {"id": "F", "label": "Airport", "x": 750, "y": 100},
    {"id": "G", "label": "University", "x": 700, "y": 600},
    {"id": "H", "label": "Harbor", "x": 100, "y": 600},
    {"id": "I", "label": "Tech Campus", "x": 550, "y": 200},
    {"id": "J", "label": "Old Town", "x": 250, "y": 200},
    {"id": "K", "label": "Business District", "x": 550, "y": 550},
    {"id": "L", "label": "Riverside", "x": 250, "y": 550},
]

stations_df = pd.DataFrame(stations)
station_lookup = {s["id"]: s for s in stations}

# Route data - Train services with times
routes = [
    # Express lines (longer routes)
    {"source": "A", "target": "B", "route": "RE1", "dep": "06:00", "arr": "06:25", "type": "Express"},
    {"source": "B", "target": "A", "route": "RE1", "dep": "06:35", "arr": "07:00", "type": "Express"},
    {"source": "A", "target": "F", "route": "RE2", "dep": "07:00", "arr": "07:45", "type": "Express"},
    {"source": "F", "target": "A", "route": "RE2", "dep": "08:00", "arr": "08:45", "type": "Express"},
    {"source": "A", "target": "E", "route": "RE3", "dep": "06:15", "arr": "06:40", "type": "Express"},
    {"source": "E", "target": "A", "route": "RE3", "dep": "07:00", "arr": "07:25", "type": "Express"},
    # Regional lines
    {"source": "B", "target": "F", "route": "RB1", "dep": "07:15", "arr": "07:35", "type": "Regional"},
    {"source": "F", "target": "B", "route": "RB1", "dep": "08:00", "arr": "08:20", "type": "Regional"},
    {"source": "B", "target": "I", "route": "RB2", "dep": "06:30", "arr": "06:45", "type": "Regional"},
    {"source": "I", "target": "C", "route": "RB2", "dep": "06:50", "arr": "07:05", "type": "Regional"},
    {"source": "B", "target": "J", "route": "RB3", "dep": "07:00", "arr": "07:15", "type": "Regional"},
    {"source": "J", "target": "D", "route": "RB3", "dep": "07:20", "arr": "07:35", "type": "Regional"},
    # Local services
    {"source": "A", "target": "K", "route": "S1", "dep": "06:10", "arr": "06:22", "type": "Local"},
    {"source": "K", "target": "G", "route": "S1", "dep": "06:25", "arr": "06:40", "type": "Local"},
    {"source": "G", "target": "C", "route": "S1", "dep": "06:45", "arr": "07:00", "type": "Local"},
    {"source": "A", "target": "L", "route": "S2", "dep": "06:20", "arr": "06:32", "type": "Local"},
    {"source": "L", "target": "H", "route": "S2", "dep": "06:35", "arr": "06:50", "type": "Local"},
    {"source": "H", "target": "D", "route": "S2", "dep": "06:55", "arr": "07:10", "type": "Local"},
    {"source": "D", "target": "A", "route": "S3", "dep": "07:30", "arr": "07:50", "type": "Local"},
    {"source": "C", "target": "A", "route": "S4", "dep": "07:15", "arr": "07:35", "type": "Local"},
    {"source": "E", "target": "K", "route": "S5", "dep": "08:00", "arr": "08:15", "type": "Local"},
    {"source": "E", "target": "L", "route": "S6", "dep": "08:10", "arr": "08:25", "type": "Local"},
    {"source": "K", "target": "A", "route": "S1", "dep": "07:30", "arr": "07:42", "type": "Local"},
    {"source": "L", "target": "A", "route": "S2", "dep": "07:40", "arr": "07:52", "type": "Local"},
]

# Build edge dataframe with coordinates
edges_data = []
for i, r in enumerate(routes):
    src = station_lookup[r["source"]]
    tgt = station_lookup[r["target"]]

    # Calculate offset for parallel routes (same source-target pair)
    pair_key = tuple(sorted([r["source"], r["target"]]))
    same_pair = [j for j, route in enumerate(routes) if tuple(sorted([route["source"], route["target"]])) == pair_key]
    pair_index = same_pair.index(i)
    offset = (pair_index - len(same_pair) / 2 + 0.5) * 25

    # Calculate perpendicular offset
    dx = tgt["x"] - src["x"]
    dy = tgt["y"] - src["y"]
    length = np.sqrt(dx**2 + dy**2) + 0.001
    perp_x = -dy / length * offset
    perp_y = dx / length * offset

    # Shorten edges to not overlap with nodes
    shrink = 45 / length
    x1 = src["x"] + dx * shrink + perp_x
    y1 = src["y"] + dy * shrink + perp_y
    x2 = tgt["x"] - dx * shrink + perp_x
    y2 = tgt["y"] - dy * shrink + perp_y

    # Arrow position (near target)
    arrow_pos = 0.75
    ax = x1 + (x2 - x1) * arrow_pos
    ay = y1 + (y2 - y1) * arrow_pos

    # Label position (middle of edge)
    lx = (x1 + x2) / 2
    ly = (y1 + y2) / 2

    edges_data.append(
        {
            "x1": x1,
            "y1": y1,
            "x2": x2,
            "y2": y2,
            "ax": ax,
            "ay": ay,
            "lx": lx,
            "ly": ly,
            "route": r["route"],
            "dep": r["dep"],
            "arr": r["arr"],
            "type": r["type"],
            "label": f"{r['route']} | {r['dep']}→{r['arr']}",
            "angle": np.degrees(np.arctan2(y2 - y1, x2 - x1)),
        }
    )

edges_df = pd.DataFrame(edges_data)

# Node fill color (adapt to theme for better contrast)
node_fill = "#FFFDF6" if THEME == "light" else "#3A3A35"

# Define scales with reversed Y axis (so North is at top, South at bottom)
x_scale = alt.Scale(domain=[0, 850])
y_scale = alt.Scale(domain=[0, 850], reverse=True)

# Station nodes
nodes = (
    alt.Chart(stations_df)
    .mark_circle(size=2000, stroke=INK_SOFT, strokeWidth=2)
    .encode(x=alt.X("x:Q", scale=x_scale), y=alt.Y("y:Q", scale=y_scale), color=alt.value(node_fill))
)

# Station labels
node_labels = (
    alt.Chart(stations_df)
    .mark_text(fontSize=15, fontWeight="bold", dy=-38)
    .encode(x=alt.X("x:Q", scale=x_scale), y=alt.Y("y:Q", scale=y_scale), text="label:N", color=alt.value(INK))
)

# Station ID in center
node_ids = (
    alt.Chart(stations_df)
    .mark_text(fontSize=18, fontWeight="bold")
    .encode(x=alt.X("x:Q", scale=x_scale), y=alt.Y("y:Q", scale=y_scale), text="id:N", color=alt.value(IMPRINT[0]))
)

# Route edges (lines)
edges = (
    alt.Chart(edges_df)
    .mark_rule(strokeWidth=3, opacity=0.8)
    .encode(
        x=alt.X("x1:Q", scale=x_scale),
        y=alt.Y("y1:Q", scale=y_scale),
        x2="x2:Q",
        y2="y2:Q",
        color=alt.Color(
            "type:N",
            scale=alt.Scale(domain=["Express", "Regional", "Local"], range=IMPRINT),
            legend=alt.Legend(title="Route Type", titleFontSize=16, labelFontSize=14, orient="right"),
        ),
        tooltip=["route:N", "dep:N", "arr:N", "type:N"],
    )
)

# Arrow heads (triangles pointing in direction of travel)
edges_df["angle_adjusted"] = -edges_df["angle"]

arrows = (
    alt.Chart(edges_df)
    .mark_point(shape="triangle", size=220, filled=True, opacity=0.9)
    .encode(
        x=alt.X("ax:Q", scale=x_scale),
        y=alt.Y("ay:Q", scale=y_scale),
        angle=alt.Angle("angle_adjusted:Q"),
        color=alt.Color(
            "type:N", scale=alt.Scale(domain=["Express", "Regional", "Local"], range=IMPRINT), legend=None
        ),
    )
)

# Route labels (only show for a subset to avoid clutter)
label_indices = [0, 2, 6, 12, 15, 18]
labels_df = edges_df.iloc[label_indices].copy()

route_labels = (
    alt.Chart(labels_df)
    .mark_text(fontSize=12, fontWeight="normal", align="center", baseline="middle", dy=-14)
    .encode(x=alt.X("lx:Q", scale=x_scale), y=alt.Y("ly:Q", scale=y_scale), text="label:N", color=alt.value(INK_SOFT))
)

# Combine all layers
chart = (
    alt.layer(edges, arrows, nodes, node_labels, node_ids, route_labels)
    .properties(
        width=1600,
        height=900,
        background=PAGE_BG,
        title=alt.Title(
            "network-transport-static · python · altair · anyplot.ai", fontSize=28, anchor="middle", color=INK
        ),
    )
    .configure_view(strokeWidth=0, fill=PAGE_BG)
    .configure_axis(grid=False, labels=False, ticks=False, domain=False, title=None)
    .configure_legend(fillColor=ELEVATED_BG, strokeColor=INK_SOFT, labelColor=INK_SOFT, titleColor=INK)
)

# Save as PNG and HTML
chart.save(f"plot-{THEME}.png", scale_factor=3.0)
chart.save(f"plot-{THEME}.html")
Runnable source as JSON, for any HTTP client: https://api.anyplot.ai/specs/network-transport-static/altair/code. Any spec id and library id listed in llms-full.txt fit the same URL shape; every URL below is complete and callable.
{
  "spec_id": "network-transport-static",
  "language": "python",
  "library": "altair",
  "page": "https://anyplot.ai/network-transport-static/python/altair",
  "hub": "https://anyplot.ai/network-transport-static",
  "code_json": "https://api.anyplot.ai/specs/network-transport-static/altair/code",
  "spec_json": "https://api.anyplot.ai/specs/network-transport-static",
  "render_light_png": "https://storage.googleapis.com/anyplot-images/plots/network-transport-static/python/altair/plot-light.png",
  "render_dark_png": "https://storage.googleapis.com/anyplot-images/plots/network-transport-static/python/altair/plot-dark.png",
  "interactive_light_html": "https://storage.googleapis.com/anyplot-images/plots/network-transport-static/python/altair/plot-light.html",
  "interactive_dark_html": "https://storage.googleapis.com/anyplot-images/plots/network-transport-static/python/altair/plot-dark.html",
  "quality_score": 87.0,
  "license": "MIT",
  "guide": "https://anyplot.ai/llms.txt"
}
Part of Static Transport Network Diagram on anyplot.ai.