The same plot in 14 other libraries — JavaScript: Chart.js, D3.js, Highcharts, MUI X Charts; Python: Altair, Bokeh, lets-plot, Matplotlib, Plotly, plotnine, Pygal, Seaborn; R: ggplot2; Julia: Makie.jl. Compare all 15 side by side: Static Transport Network Diagram in Python, R, Julia and JavaScript.
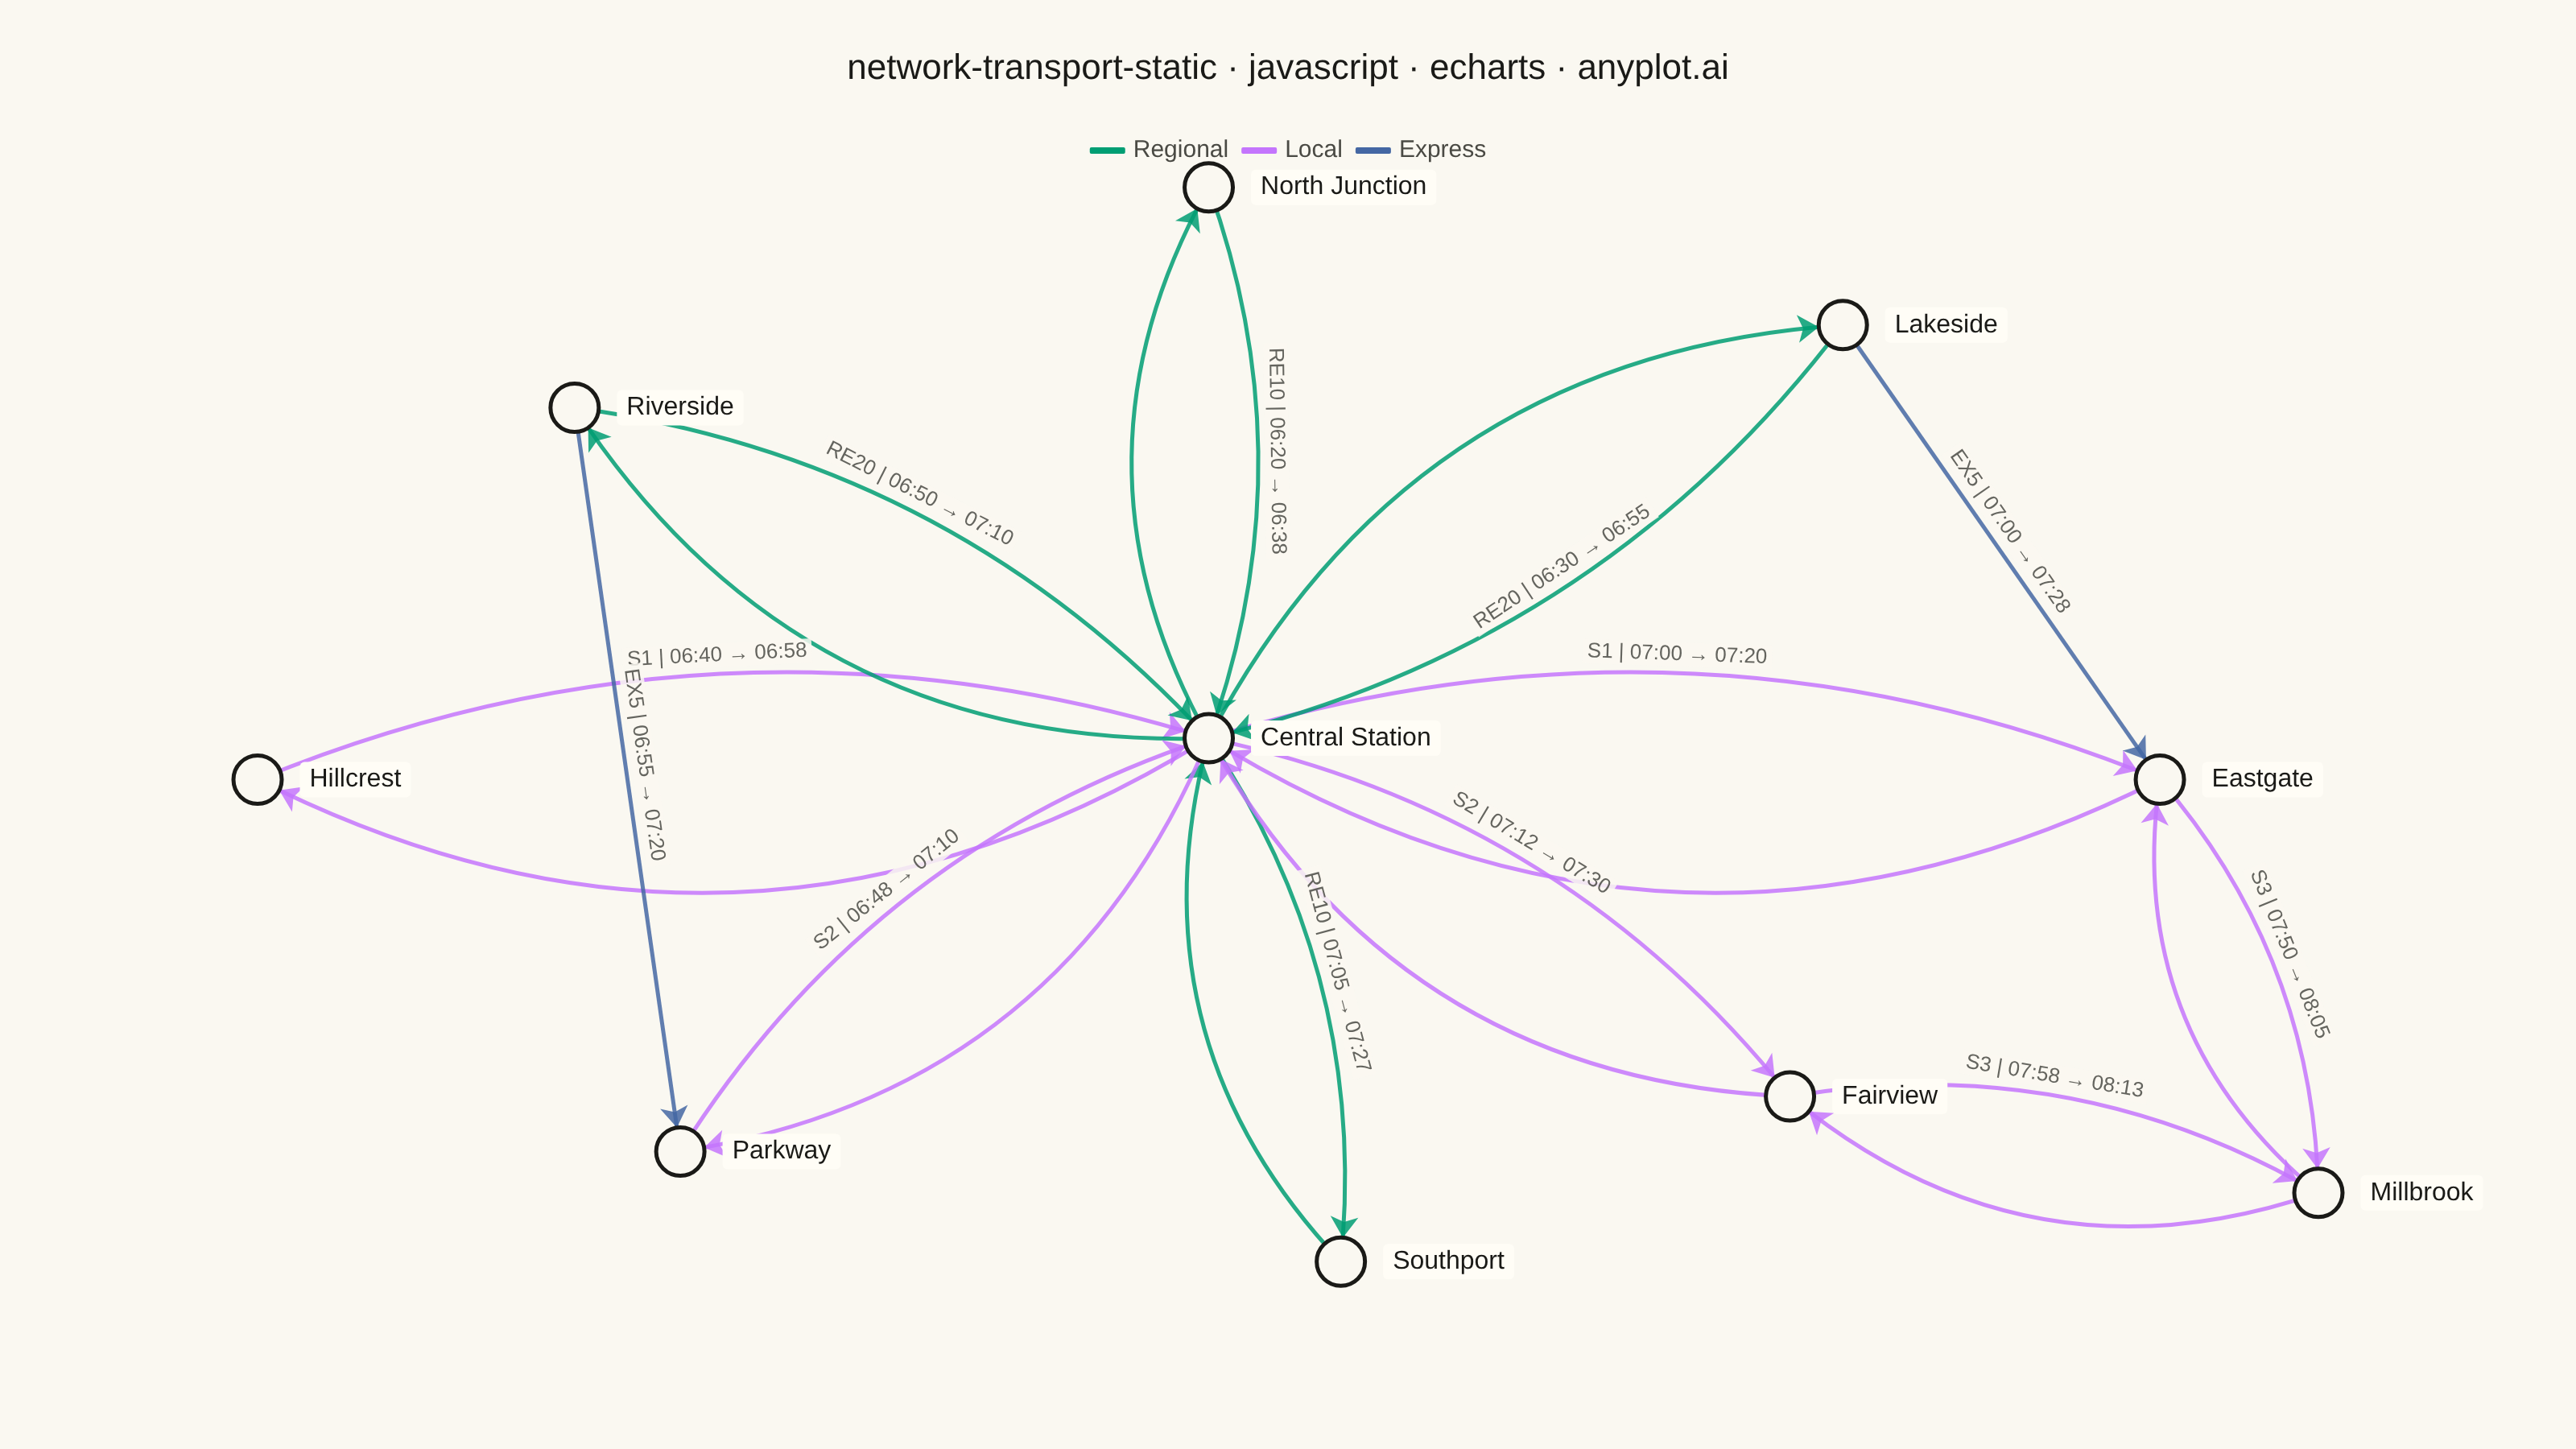
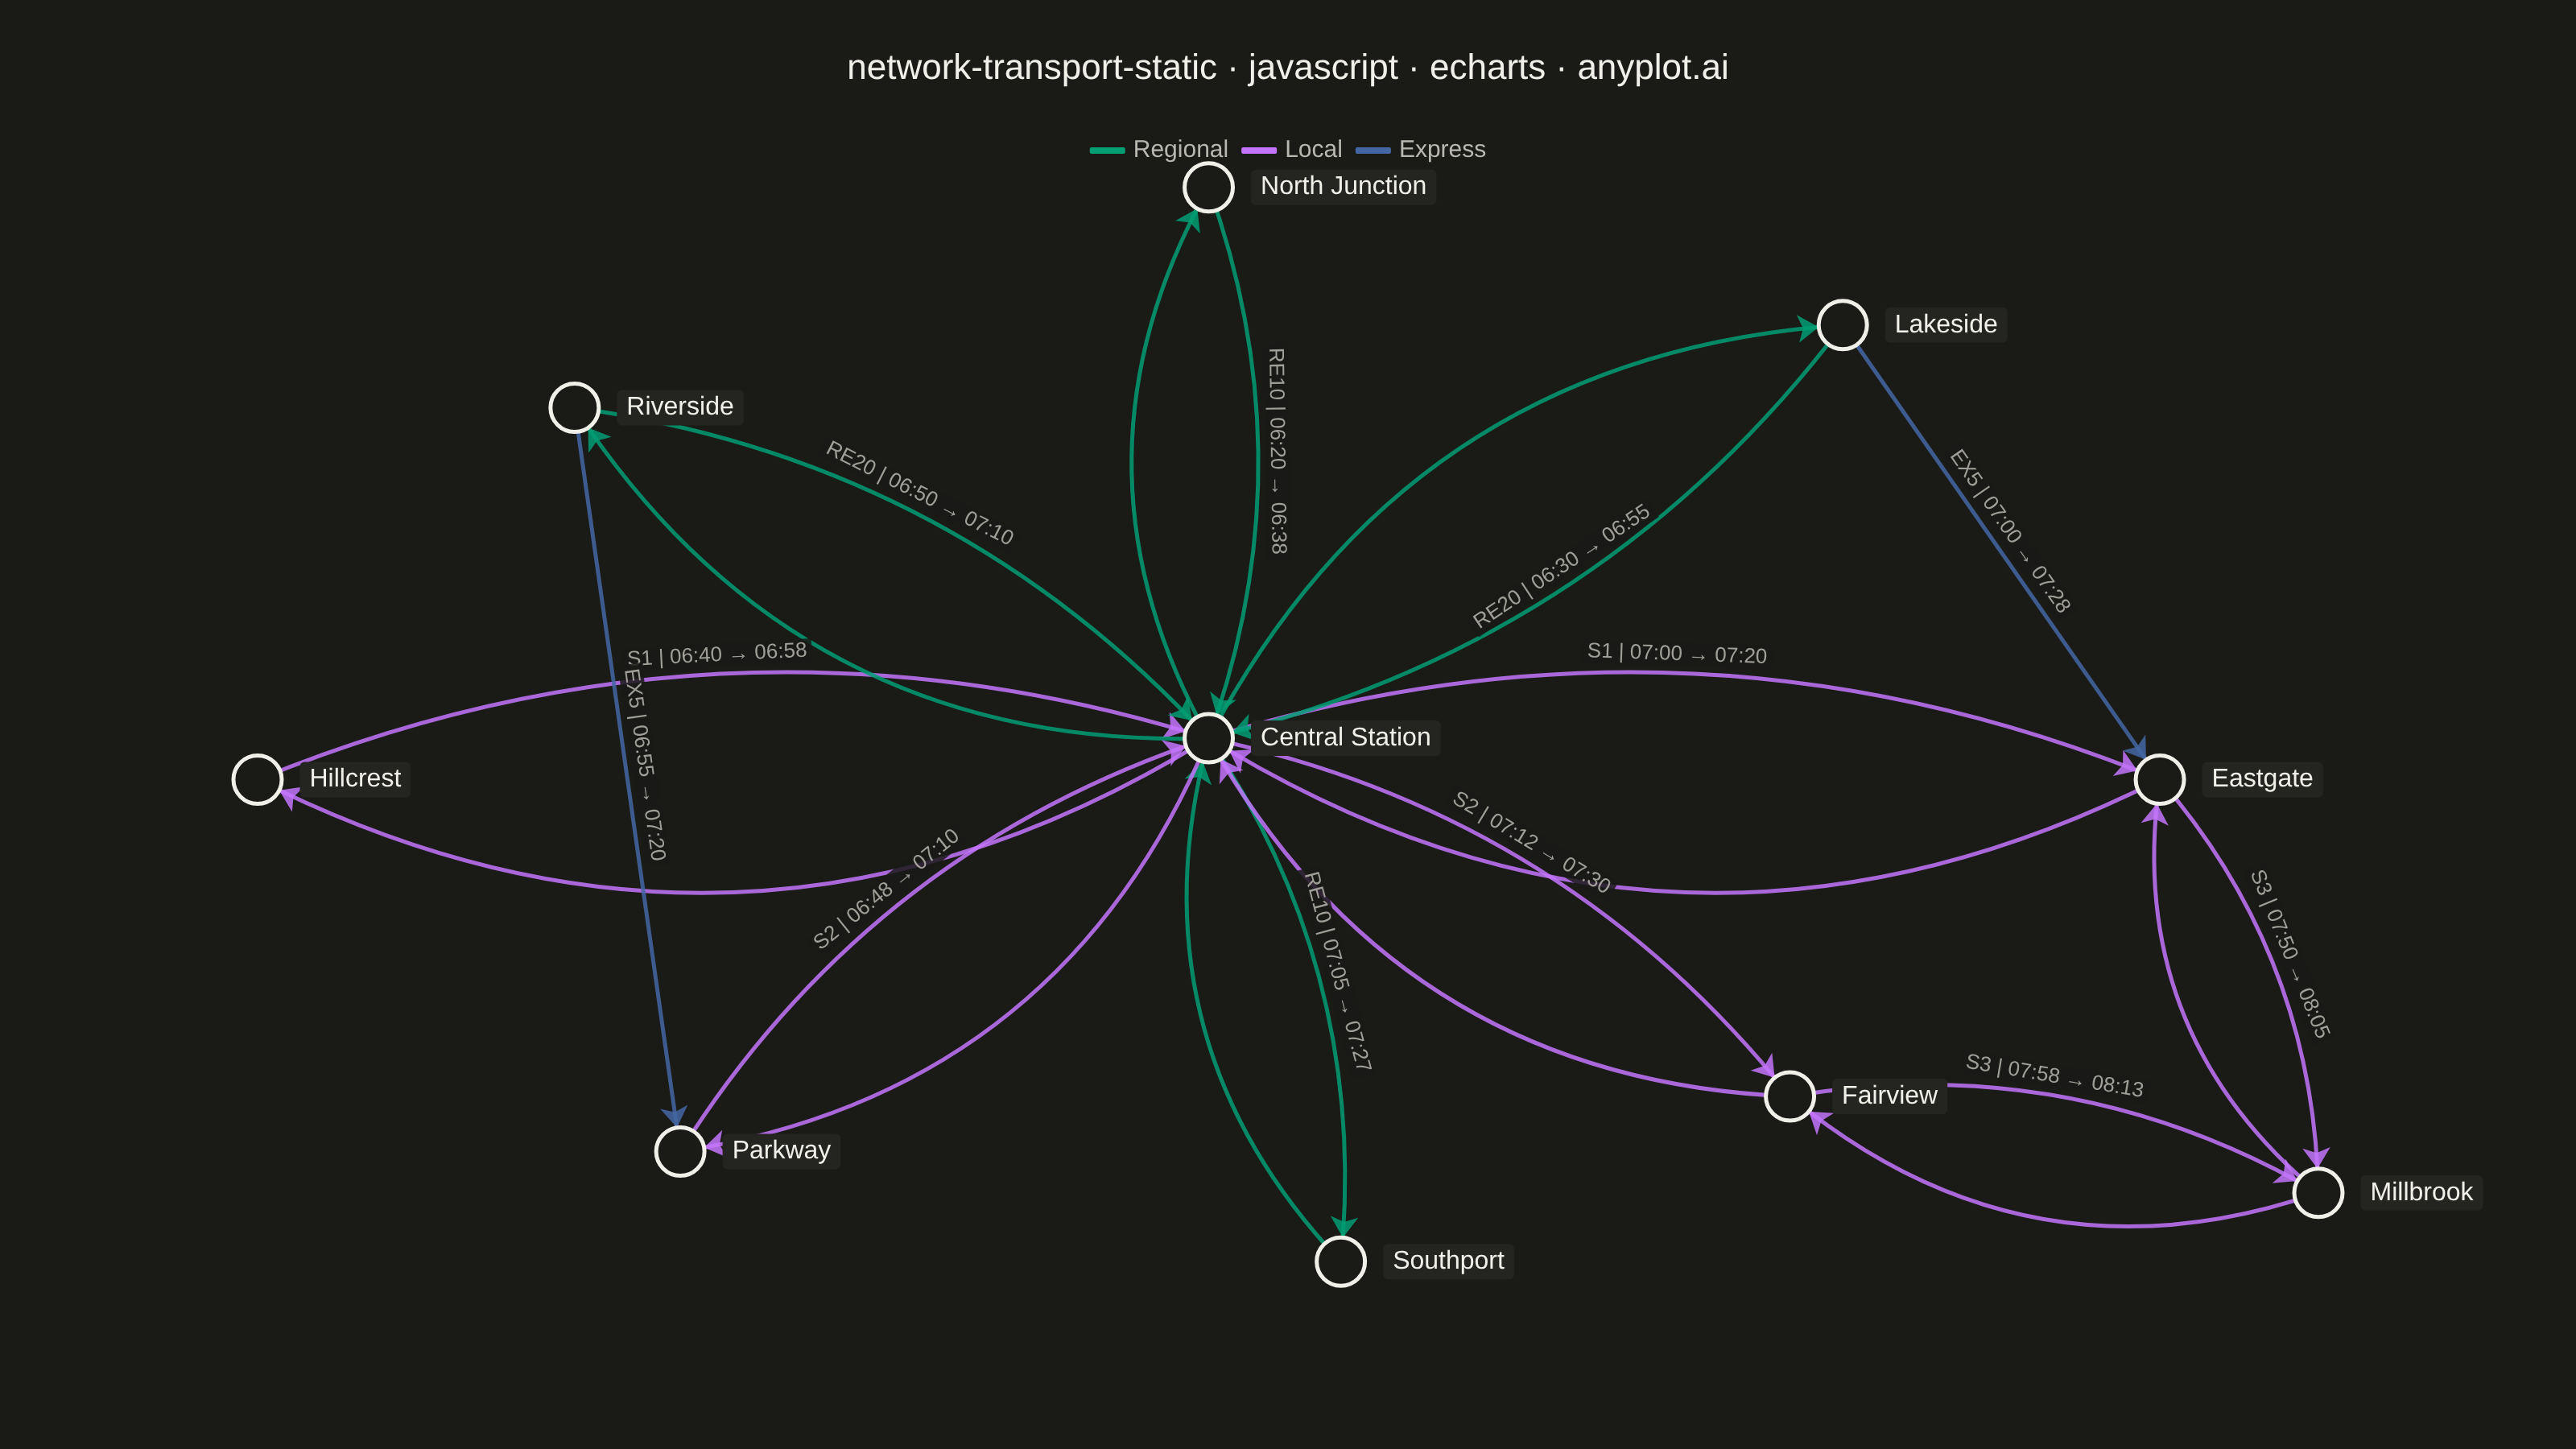
A directed network visualization for transportation systems where stations are displayed as labeled nodes and train/bus routes as directed edges. Edges display departure times, arrival times, and route identifiers. Designed for visualizing timetables, route maps, and connection patterns in rail, bus, or flight networks. This static version focuses on clear, readable presentation without interactive repositioning.
// anyplot.ai
// network-transport-static: Static Transport Network Diagram
// Library: echarts 6.1.0 | JavaScript 22.23.2
// Quality: 89/100 | Created: 2026-09-02

const t = window.ANYPLOT_TOKENS;
const size = window.ANYPLOT_SIZE;

// --- Data: regional rail network (in-memory, deterministic) ----------------
// Stations positioned by normalized (x, y) so the layout scales to the mount.
const stations = [
  { id: "HUB", label: "Central Station", x: 0.5, y: 0.52 },
  { id: "NOR", label: "North Junction", x: 0.5, y: 0.12 },
  { id: "RIV", label: "Riverside", x: 0.26, y: 0.28 },
  { id: "LAK", label: "Lakeside", x: 0.74, y: 0.22 },
  { id: "HIL", label: "Hillcrest", x: 0.14, y: 0.55 },
  { id: "PAR", label: "Parkway", x: 0.3, y: 0.82 },
  { id: "EAS", label: "Eastgate", x: 0.86, y: 0.55 },
  { id: "SOU", label: "Southport", x: 0.55, y: 0.9 },
  { id: "FAI", label: "Fairview", x: 0.72, y: 0.78 },
  { id: "MIL", label: "Millbrook", x: 0.92, y: 0.85 },
];

// route_id prefix -> service tier. Regional is the primary/most frequent
// tier, so it takes the brand color; the rest follow canonical palette order.
const ROUTE_TIERS = ["Regional", "Local", "Express"];
const tierOf = (routeId) => {
  if (routeId.startsWith("RE")) return "Regional";
  if (routeId.startsWith("EX")) return "Express";
  return "Local";
};
const TIER_COLOR = {
  Regional: t.palette[0],
  Local: t.palette[1],
  Express: t.palette[2],
};

const routes = [
  { source: "NOR", target: "HUB", route: "RE10", dep: "06:20", arr: "06:38" },
  { source: "HUB", target: "NOR", route: "RE10", dep: "06:45", arr: "07:03" },
  { source: "HUB", target: "SOU", route: "RE10", dep: "07:05", arr: "07:27" },
  { source: "SOU", target: "HUB", route: "RE10", dep: "07:35", arr: "07:57" },
  { source: "HIL", target: "HUB", route: "S1", dep: "06:40", arr: "06:58" },
  { source: "HUB", target: "HIL", route: "S1", dep: "07:05", arr: "07:23" },
  { source: "HUB", target: "EAS", route: "S1", dep: "07:00", arr: "07:20" },
  { source: "EAS", target: "HUB", route: "S1", dep: "07:25", arr: "07:45" },
  { source: "RIV", target: "HUB", route: "RE20", dep: "06:50", arr: "07:10" },
  { source: "HUB", target: "RIV", route: "RE20", dep: "07:15", arr: "07:35" },
  { source: "LAK", target: "HUB", route: "RE20", dep: "06:30", arr: "06:55" },
  { source: "HUB", target: "LAK", route: "RE20", dep: "07:10", arr: "07:35" },
  { source: "PAR", target: "HUB", route: "S2", dep: "06:48", arr: "07:10" },
  { source: "HUB", target: "PAR", route: "S2", dep: "07:15", arr: "07:37" },
  { source: "HUB", target: "FAI", route: "S2", dep: "07:12", arr: "07:30" },
  { source: "FAI", target: "HUB", route: "S2", dep: "07:36", arr: "07:54" },
  { source: "FAI", target: "MIL", route: "S3", dep: "07:58", arr: "08:13" },
  { source: "MIL", target: "FAI", route: "S3", dep: "08:18", arr: "08:33" },
  { source: "EAS", target: "MIL", route: "S3", dep: "07:50", arr: "08:05" },
  { source: "MIL", target: "EAS", route: "S3", dep: "08:10", arr: "08:25" },
  { source: "LAK", target: "EAS", route: "EX5", dep: "07:00", arr: "07:28" },
  { source: "RIV", target: "PAR", route: "EX5", dep: "06:55", arr: "07:20" },
];

// Curve same-pair edges apart so opposite-direction (or parallel) services
// between two stations don't sit on top of each other.
const pairCounts = new Map();
routes.forEach((r) => {
  const key = [r.source, r.target].sort().join("|");
  pairCounts.set(key, (pairCounts.get(key) || 0) + 1);
});

// --- Layout: map normalized station coordinates to the mount, leaving room
// for the title band and edge labels at the margins. -------------------------
const marginX = size.width * 0.09;
const marginTop = size.height * 0.16;
const marginBottom = size.height * 0.08;
const spanX = size.width - marginX * 2;
const spanY = size.height - marginTop - marginBottom;

const nodes = stations.map((s) => ({
  id: s.id,
  name: s.label,
  x: marginX + s.x * spanX,
  y: marginTop + s.y * spanY,
  symbolSize: 30,
  itemStyle: { color: t.pageBg, borderColor: t.ink, borderWidth: 2.5 },
  label: {
    show: true,
    position: "right",
    distance: 10,
    color: t.ink,
    fontSize: 16,
    fontWeight: 500,
    backgroundColor: t.elevatedBg,
    padding: [3, 6],
    borderRadius: 3,
  },
}));

// A bidirectional pair shares one route id — label only the first-seen
// direction so the two arcs of the same service don't print the id twice
// on top of each other. Same-pair curves are spread across a small set of
// curveness values (not just one) so 3+ parallel services at a busy hub
// stay visually separated instead of bunching into one arc.
const labeledPairs = new Set();
const pairSeen = new Map();
const links = routes.map((r) => {
  const key = [r.source, r.target].sort().join("|");
  const showLabel = !labeledPairs.has(key);
  labeledPairs.add(key);
  const seenIndex = pairSeen.get(key) || 0;
  pairSeen.set(key, seenIndex + 1);
  const curveness = pairCounts.get(key) > 1 ? 0.18 + seenIndex * 0.1 : 0;
  return {
    source: r.source,
    target: r.target,
    route: r.route,
    dep: r.dep,
    arr: r.arr,
    category: ROUTE_TIERS.indexOf(tierOf(r.route)),
    lineStyle: {
      color: TIER_COLOR[tierOf(r.route)],
      width: 2.5,
      curveness,
      opacity: 0.85,
    },
    label: {
      show: showLabel,
      formatter: `${r.route} | ${r.dep} → ${r.arr}`,
      fontSize: 13,
      color: t.inkSoft,
      backgroundColor: t.pageBg,
      padding: [1, 3],
    },
  };
});

// --- Title (length-scaled per plot-generator.md) ----------------------------
const titleText = "network-transport-static · javascript · echarts · anyplot.ai";
const titleFontSize = Math.max(15, Math.round(22 * Math.min(1, 67 / titleText.length)));

// --- Init + option ------------------------------------------------------------
const chart = echarts.init(document.getElementById("container"));

chart.setOption({
  animation: false,
  backgroundColor: "transparent",
  title: {
    text: titleText,
    left: "center",
    top: size.height * 0.03,
    textStyle: { color: t.ink, fontSize: titleFontSize, fontWeight: 500 },
  },
  legend: {
    data: ROUTE_TIERS,
    top: size.height * 0.09,
    left: "center",
    itemWidth: 22,
    itemHeight: 4,
    textStyle: { color: t.inkSoft, fontSize: 15 },
  },
  color: ROUTE_TIERS.map((tier) => TIER_COLOR[tier]),
  tooltip: {
    formatter: (params) =>
      params.dataType === "edge"
        ? `${params.data.route} | ${params.data.dep} → ${params.data.arr}`
        : params.name,
  },
  series: [
    {
      type: "graph",
      layout: "none",
      roam: false,
      symbol: "circle",
      edgeSymbol: ["none", "arrow"],
      edgeSymbolSize: [0, 13],
      data: nodes,
      links: links,
      categories: ROUTE_TIERS.map((name) => ({ name })),
      lineStyle: { curveness: 0 },
      edgeLabel: { show: true },
    },
  ],
});

// ECharts' built-in category filter only applies to graph *nodes*, not
// edges — and a station here typically carries routes from more than one
// tier, so tagging nodes with a single category would misrepresent the
// data. Instead, drive the legend's tier toggle explicitly: hide/show each
// link by the tier recorded on its own `category` field above.
chart.on("legendselectchanged", (params) => {
  chart.setOption({
    series: [
      {
        links: links.map((l) => {
          const visible = params.selected[ROUTE_TIERS[l.category]];
          return {
            ...l,
            lineStyle: { ...l.lineStyle, opacity: visible ? l.lineStyle.opacity : 0 },
            label: { ...l.label, show: l.label.show && visible },
          };
        }),
      },
    ],
  });
});
Runnable source as JSON, for any HTTP client: https://api.anyplot.ai/specs/network-transport-static/echarts/code. Any spec id and library id listed in llms-full.txt fit the same URL shape; every URL below is complete and callable.
{
  "spec_id": "network-transport-static",
  "language": "javascript",
  "library": "echarts",
  "page": "https://anyplot.ai/network-transport-static/javascript/echarts",
  "hub": "https://anyplot.ai/network-transport-static",
  "code_json": "https://api.anyplot.ai/specs/network-transport-static/echarts/code",
  "spec_json": "https://api.anyplot.ai/specs/network-transport-static",
  "render_light_png": "https://storage.googleapis.com/anyplot-images/plots/network-transport-static/javascript/echarts/plot-light.png",
  "render_dark_png": "https://storage.googleapis.com/anyplot-images/plots/network-transport-static/javascript/echarts/plot-dark.png",
  "interactive_light_html": "https://storage.googleapis.com/anyplot-images/plots/network-transport-static/javascript/echarts/plot-light.html",
  "interactive_dark_html": "https://storage.googleapis.com/anyplot-images/plots/network-transport-static/javascript/echarts/plot-dark.html",
  "quality_score": 89.0,
  "license": "MIT",
  "guide": "https://anyplot.ai/llms.txt"
}
Part of Static Transport Network Diagram on anyplot.ai.