The same plot in 14 other libraries — JavaScript: Chart.js, D3.js, Apache ECharts, MUI X Charts; Python: Altair, Bokeh, lets-plot, Matplotlib, Plotly, plotnine, Pygal, Seaborn; R: ggplot2; Julia: Makie.jl. Compare all 15 side by side: Static Transport Network Diagram in Python, R, Julia and JavaScript.
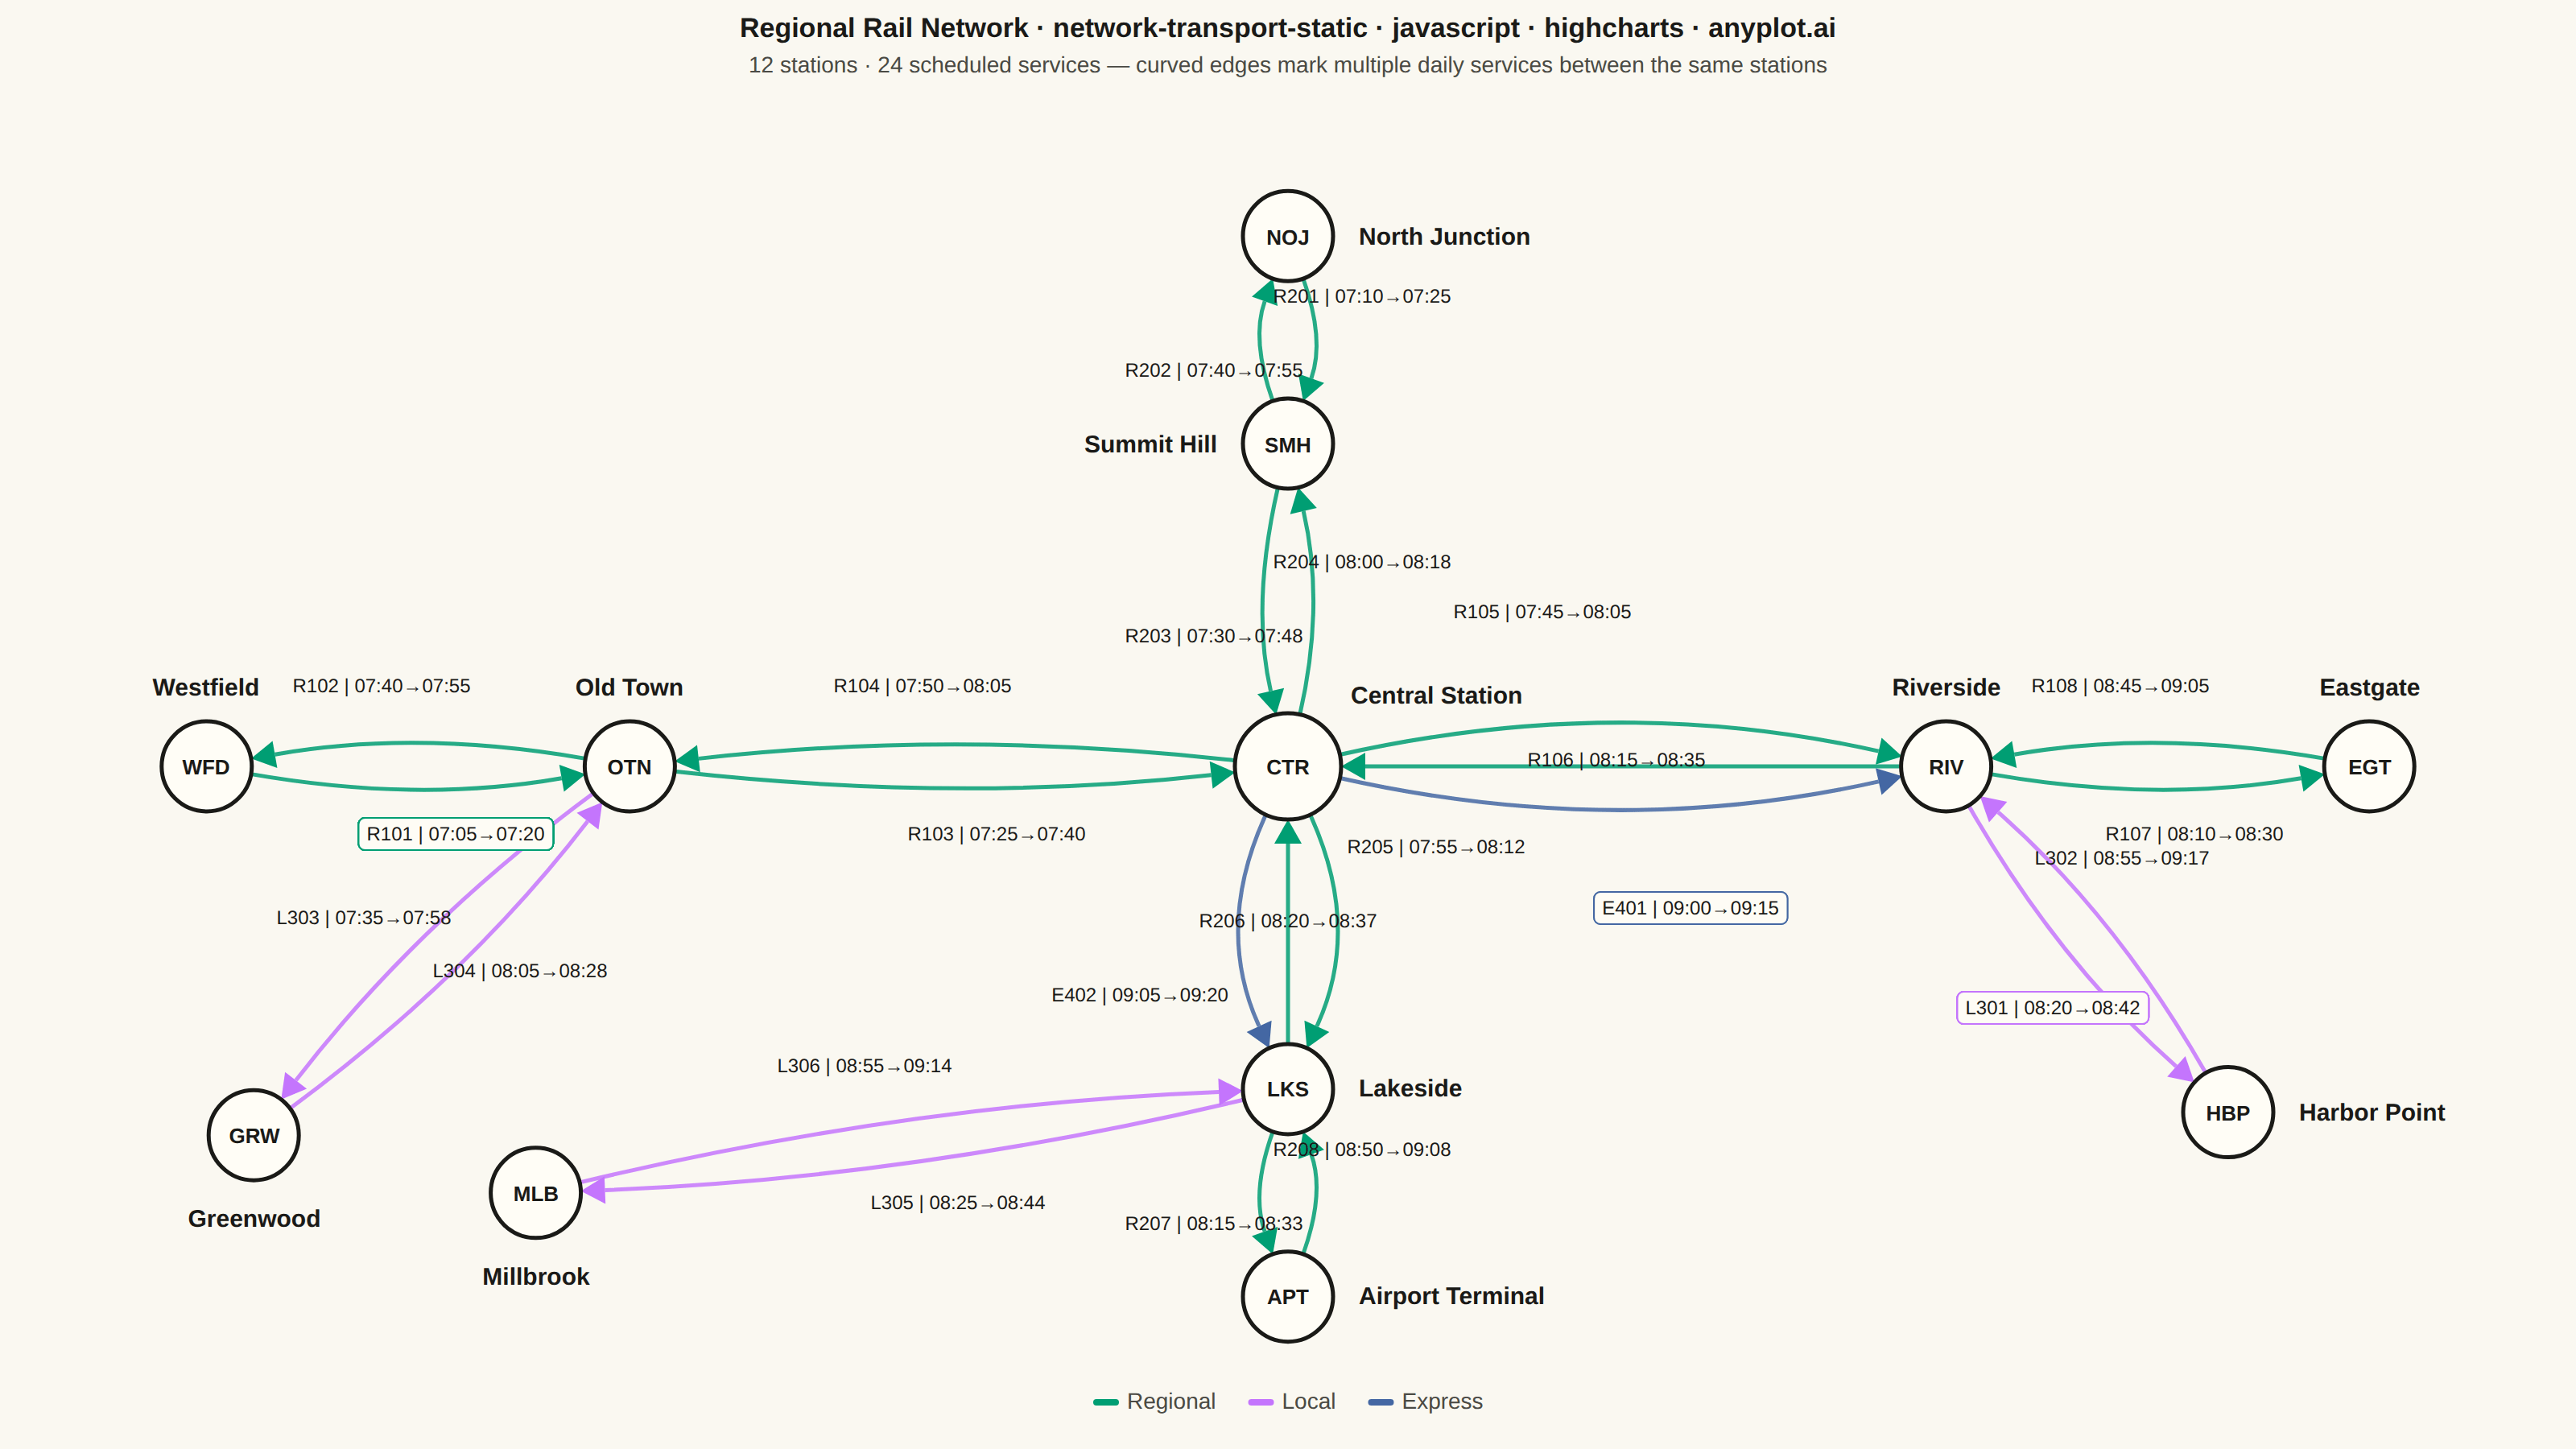
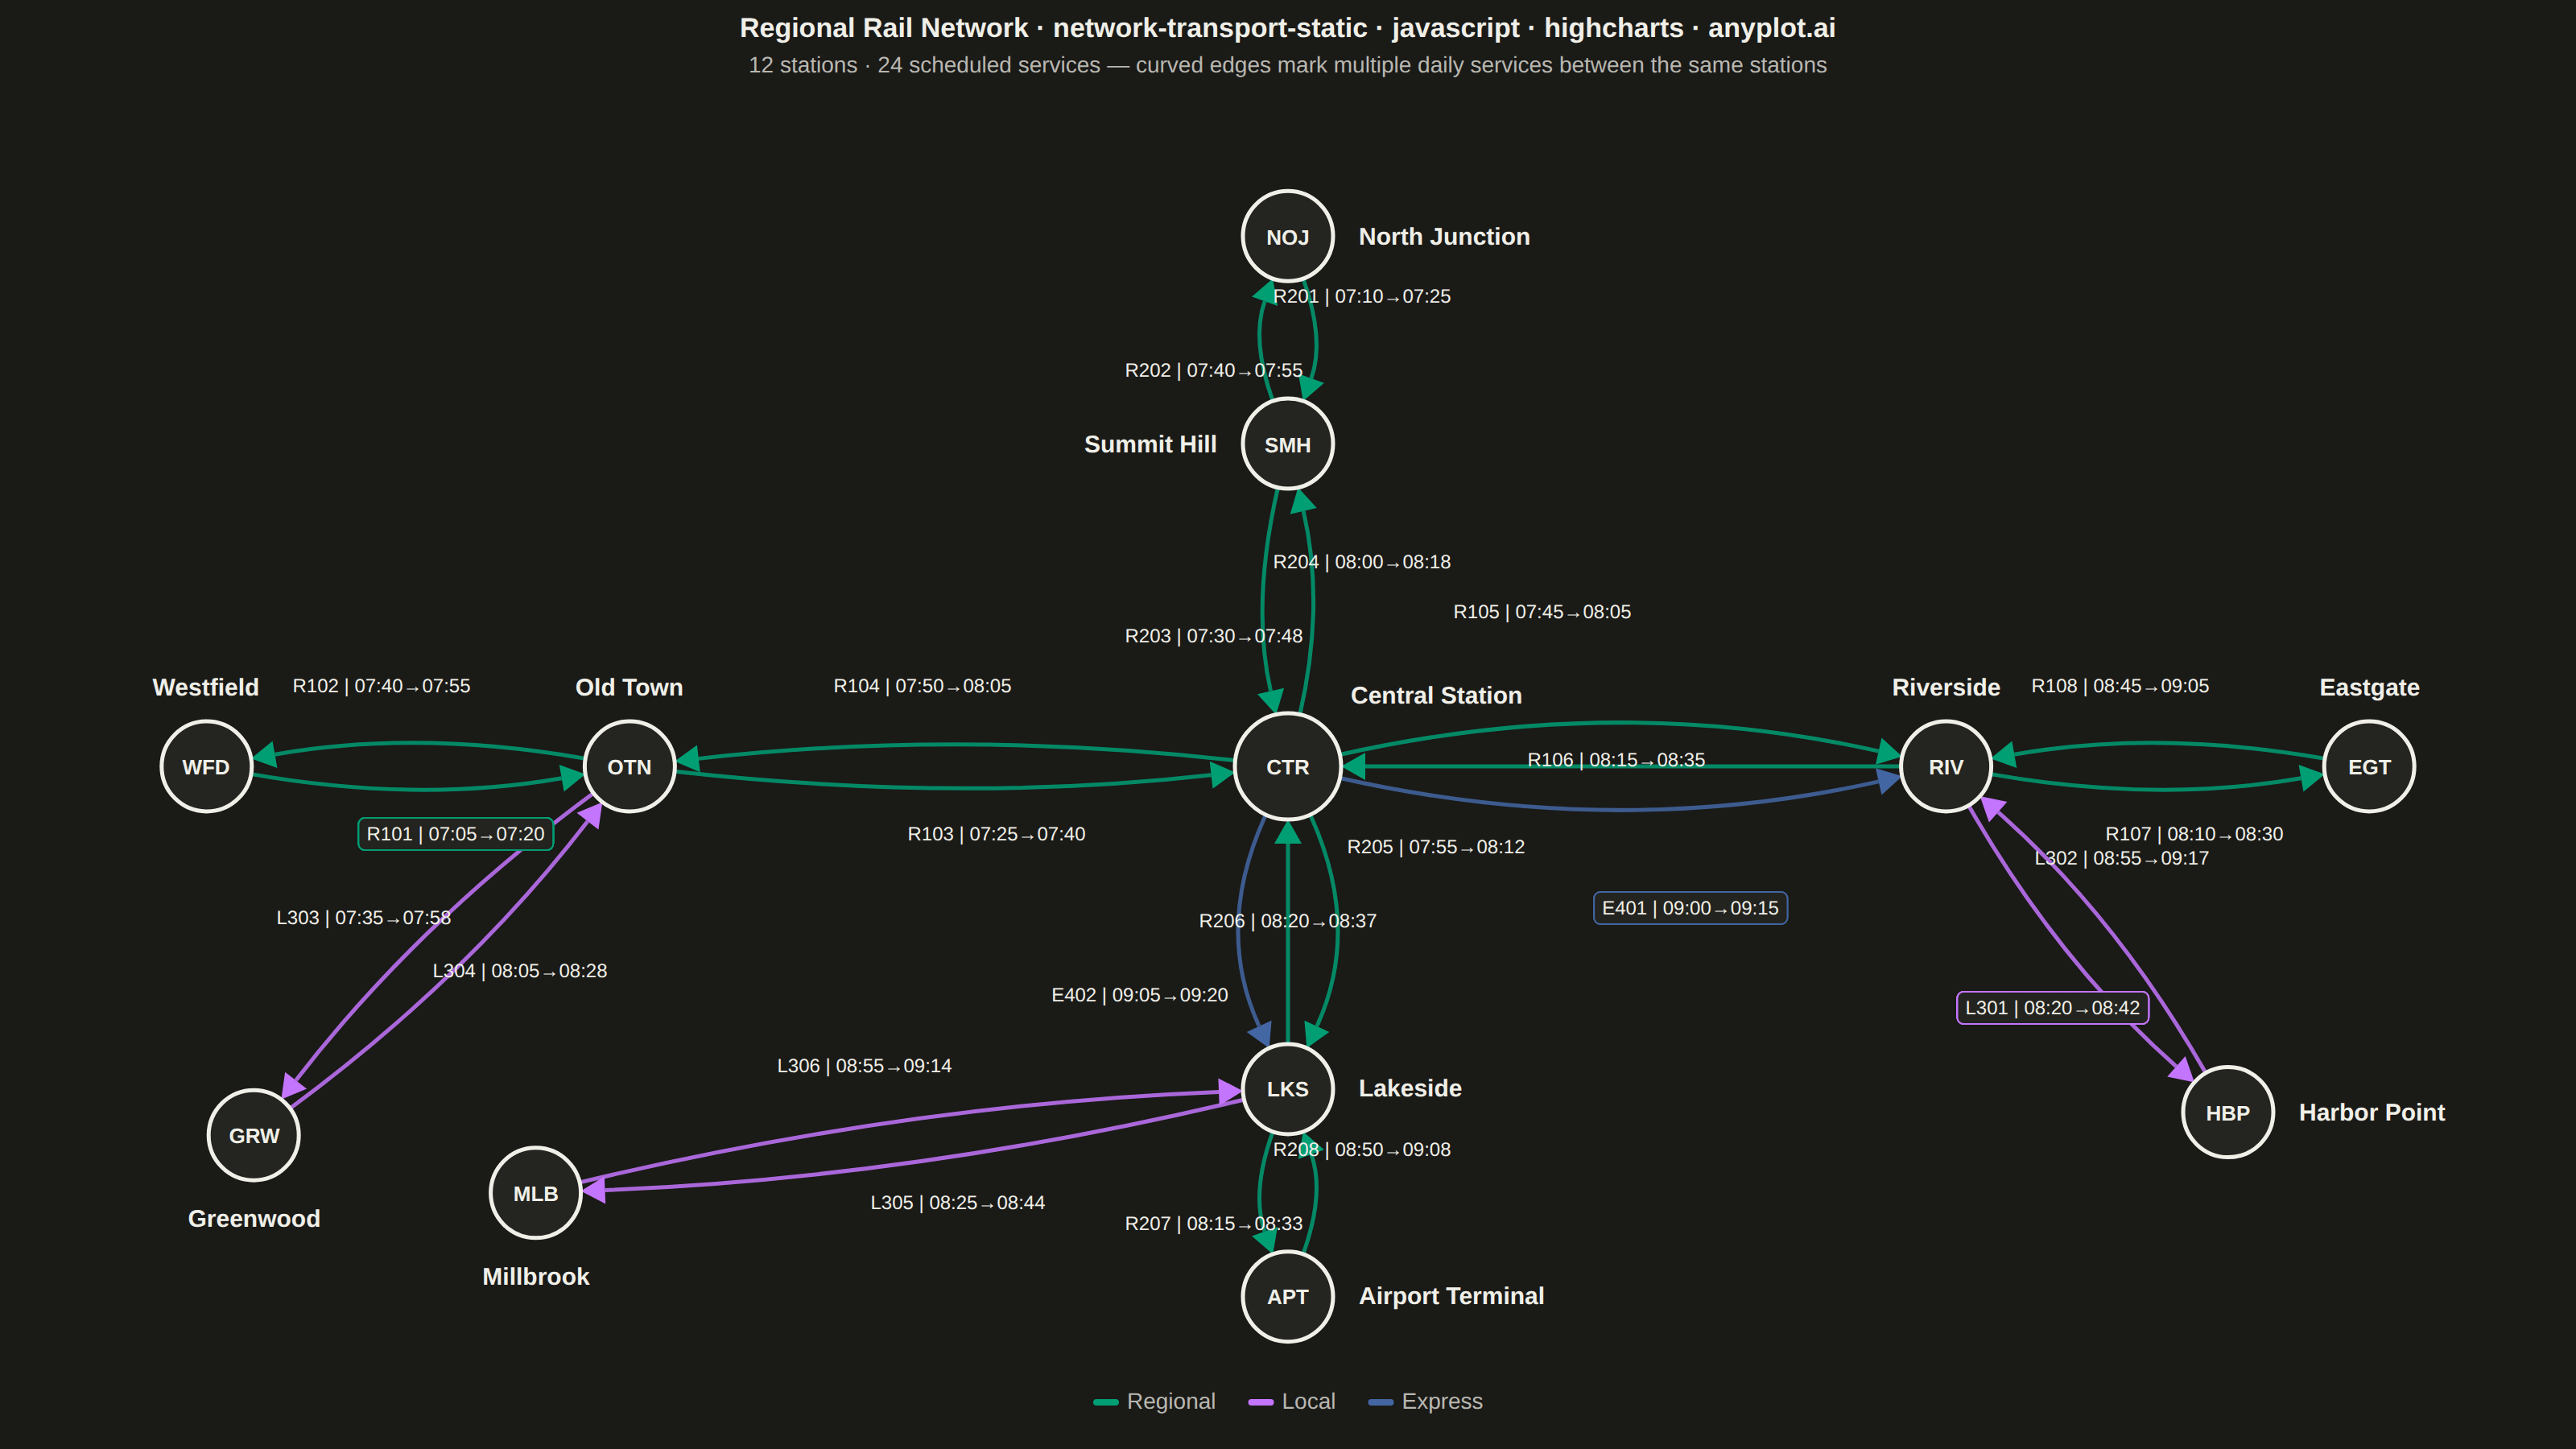
A directed network visualization for transportation systems where stations are displayed as labeled nodes and train/bus routes as directed edges. Edges display departure times, arrival times, and route identifiers. Designed for visualizing timetables, route maps, and connection patterns in rail, bus, or flight networks. This static version focuses on clear, readable presentation without interactive repositioning.
// anyplot.ai
// network-transport-static: Static Transport Network Diagram
// Library: highcharts 12.6.0 | JavaScript 22.23.2
// Quality: 84/100 | Created: 2026-09-02

const t = window.ANYPLOT_TOKENS;
const size = window.ANYPLOT_SIZE;

// --- Data: a regional rail network (in-memory, deterministic) --------------
// Two trunk lines (east-west, north-south) crossing at the interchange, plus
// three short branches — a layout that spreads edges across the canvas
// instead of radiating every route through a single hub.
const STATIONS = [
  { id: "CTR", label: "Central Station", nx: 0.5, ny: 0.5, hub: true, dir: "upper-right" },
  { id: "WFD", label: "Westfield", nx: 0.04, ny: 0.5, dir: "up" },
  { id: "OTN", label: "Old Town", nx: 0.22, ny: 0.5, dir: "up" },
  { id: "RIV", label: "Riverside", nx: 0.78, ny: 0.5, dir: "up" },
  { id: "EGT", label: "Eastgate", nx: 0.96, ny: 0.5, dir: "up" },
  { id: "NOJ", label: "North Junction", nx: 0.5, ny: 0.04, dir: "right" },
  { id: "SMH", label: "Summit Hill", nx: 0.5, ny: 0.22, dir: "left" },
  { id: "LKS", label: "Lakeside", nx: 0.5, ny: 0.78, dir: "right" },
  { id: "APT", label: "Airport Terminal", nx: 0.5, ny: 0.96, dir: "right" },
  { id: "HBP", label: "Harbor Point", nx: 0.9, ny: 0.8, dir: "right" },
  { id: "GRW", label: "Greenwood", nx: 0.06, ny: 0.82, dir: "down" },
  { id: "MLB", label: "Millbrook", nx: 0.18, ny: 0.87, dir: "down" },
];

const ROUTE_TYPES = {
  regional: { name: "Regional", color: t.palette[0] },
  local: { name: "Local", color: t.palette[1] },
  express: { name: "Express", color: t.palette[2] },
};

const ROUTES = [
  { source: "WFD", target: "OTN", id: "R101", dep: "07:05", arr: "07:20", type: "regional" },
  { source: "OTN", target: "WFD", id: "R102", dep: "07:40", arr: "07:55", type: "regional" },
  { source: "OTN", target: "CTR", id: "R103", dep: "07:25", arr: "07:40", type: "regional" },
  { source: "CTR", target: "OTN", id: "R104", dep: "07:50", arr: "08:05", type: "regional" },
  { source: "CTR", target: "RIV", id: "R105", dep: "07:45", arr: "08:05", type: "regional" },
  { source: "RIV", target: "CTR", id: "R106", dep: "08:15", arr: "08:35", type: "regional" },
  { source: "RIV", target: "EGT", id: "R107", dep: "08:10", arr: "08:30", type: "regional" },
  { source: "EGT", target: "RIV", id: "R108", dep: "08:45", arr: "09:05", type: "regional" },
  { source: "NOJ", target: "SMH", id: "R201", dep: "07:10", arr: "07:25", type: "regional" },
  { source: "SMH", target: "NOJ", id: "R202", dep: "07:40", arr: "07:55", type: "regional" },
  { source: "SMH", target: "CTR", id: "R203", dep: "07:30", arr: "07:48", type: "regional" },
  { source: "CTR", target: "SMH", id: "R204", dep: "08:00", arr: "08:18", type: "regional" },
  { source: "CTR", target: "LKS", id: "R205", dep: "07:55", arr: "08:12", type: "regional" },
  { source: "LKS", target: "CTR", id: "R206", dep: "08:20", arr: "08:37", type: "regional" },
  { source: "LKS", target: "APT", id: "R207", dep: "08:15", arr: "08:33", type: "regional" },
  { source: "APT", target: "LKS", id: "R208", dep: "08:50", arr: "09:08", type: "regional" },
  { source: "RIV", target: "HBP", id: "L301", dep: "08:20", arr: "08:42", type: "local" },
  { source: "HBP", target: "RIV", id: "L302", dep: "08:55", arr: "09:17", type: "local" },
  { source: "OTN", target: "GRW", id: "L303", dep: "07:35", arr: "07:58", type: "local" },
  { source: "GRW", target: "OTN", id: "L304", dep: "08:05", arr: "08:28", type: "local" },
  { source: "LKS", target: "MLB", id: "L305", dep: "08:25", arr: "08:44", type: "local" },
  { source: "MLB", target: "LKS", id: "L306", dep: "08:55", arr: "09:14", type: "local" },
  { source: "CTR", target: "RIV", id: "E401", dep: "09:00", arr: "09:15", type: "express" },
  { source: "CTR", target: "LKS", id: "E402", dep: "09:05", arr: "09:20", type: "express" },
];

// --- Title -------------------------------------------------------------------
const TITLE = "Regional Rail Network · network-transport-static · javascript · highcharts · anyplot.ai";
const TITLE_FONT_SIZE = `${Math.max(15, Math.round(22 * Math.min(1, 67 / TITLE.length)))}px`;

// --- Geometry ------------------------------------------------------------
const margin = { top: 118, right: 70, bottom: 66, left: 70 };
const plotW = size.width - margin.left - margin.right;
const plotH = size.height - margin.top - margin.bottom;
const NODE_R = 28;
const HUB_R = 33;

// Edge-label backing boxes are sized from measured text width rather than
// SVGElement.getBBox() — calling getBBox() on a freshly-added Highcharts
// text element mid-loop only reflects the actually laid-out box for a few
// of the labels (a batched-relayout quirk), leaving the rest with a
// stale/zero-size box. Canvas 2D text measurement is synchronous and
// unaffected by that, so every label gets a consistent box.
const LABEL_FONT_SIZE = 12;
const LABEL_FONT_WEIGHT = 500;
const LABEL_FONT = `${LABEL_FONT_WEIGHT} ${LABEL_FONT_SIZE}px -apple-system, BlinkMacSystemFont, "Segoe UI", Roboto, Helvetica, Arial, sans-serif`;
const measureCtx = document.createElement("canvas").getContext("2d");
measureCtx.font = LABEL_FONT;
function labelBoxFor(text, cx, cy) {
  const width = measureCtx.measureText(text).width;
  const height = LABEL_FONT_SIZE * 1.3;
  return { x: cx - width / 2, y: cy - height * 0.72, width, height };
}

function pixelOf(station) {
  return { x: margin.left + station.nx * plotW, y: margin.top + station.ny * plotH };
}
const pixels = {};
const radii = {};
STATIONS.forEach((s) => {
  pixels[s.id] = pixelOf(s);
  radii[s.id] = s.hub ? HUB_R : NODE_R;
});

// Group routes by unordered station pair so repeated connections (either
// direction) fan out into distinguishable curves instead of overlapping.
// The perpendicular normal is derived from a *canonical* (sorted) station
// order shared by the whole group — deriving it from each route's own
// source->target direction would flip sign on the reverse-direction routes
// and collapse every bidirectional pair back onto a single curve.
const CURVE_STEP = 46;
const pairGroups = new Map();
ROUTES.forEach((route) => {
  const key = [route.source, route.target].sort().join("|");
  if (!pairGroups.has(key)) pairGroups.set(key, []);
  pairGroups.get(key).push(route);
});
// Label placement is deliberately decoupled from the (subtle) line curve: a
// label box is ~150px wide, far more than a tasteful curve bulge, so labels
// get their own larger perpendicular spacing plus an along-the-edge stagger.
// One of the two always ends up as a vertical (row) separation regardless of
// whether the edge itself runs mostly horizontal or mostly vertical.
const LABEL_PERP_STEP = 92;
const LABEL_ALONG_STEP = 46;
// On short station pairs (adjacent stations) the fixed offsets above leave
// little room between the pair midpoint and the arrow-trim point near the
// target node, so the label ends up sitting on top of the arrowhead. Boost
// both offsets inversely with edge length so close-together stations still
// get enough clearance; longer edges are unaffected (boost clamps to 1).
const REFERENCE_EDGE_LEN = 260;
const MAX_LABEL_BOOST = 2.6;
pairGroups.forEach((group, key) => {
  const [a, b] = key.split("|");
  const pa = pixels[a];
  const pb = pixels[b];
  const len = Math.hypot(pb.x - pa.x, pb.y - pa.y) || 1;
  const canonNx = -(pb.y - pa.y) / len;
  const canonNy = (pb.x - pa.x) / len;
  const alongX = (pb.x - pa.x) / len;
  const alongY = (pb.y - pa.y) / len;
  const labelBoost = Math.min(MAX_LABEL_BOOST, Math.max(1, REFERENCE_EDGE_LEN / len));
  const n = group.length;
  group.forEach((route, i) => {
    route.curveNx = canonNx;
    route.curveNy = canonNy;
    const idx = n === 1 ? 0 : i - (n - 1) / 2;
    route.curveOffset = idx * CURVE_STEP;
    route.labelPerpX = canonNx * idx * LABEL_PERP_STEP * labelBoost;
    route.labelPerpY = canonNy * idx * LABEL_PERP_STEP * labelBoost;
    route.labelAlongX = alongX * idx * LABEL_ALONG_STEP * labelBoost;
    route.labelAlongY = alongY * idx * LABEL_ALONG_STEP * labelBoost;
  });
});

// Anchor point + text-anchor for a station's outside name label, chosen per
// station to dodge that station's own incident edges.
function labelAnchor(p, r, dir) {
  const gap = 16;
  switch (dir) {
    case "up":
      return { x: p.x, y: p.y - r - gap, align: "center" };
    case "down":
      return { x: p.x, y: p.y + r + gap + 13, align: "center" };
    case "left":
      return { x: p.x - r - gap, y: p.y + 5, align: "right" };
    case "right":
      return { x: p.x + r + gap, y: p.y + 5, align: "left" };
    case "upper-right":
      return { x: p.x + r * 0.7 + gap, y: p.y - r * 0.7 - gap, align: "left" };
    default:
      return { x: p.x, y: p.y - r - gap, align: "center" };
  }
}

const chart = Highcharts.chart("container", {
  chart: {
    backgroundColor: "transparent",
    animation: false,
    style: { fontFamily: "inherit" },
    events: {
      load: function () {
        const renderer = this.renderer;

        // --- Edges: curved/offset paths with an arrowhead at the target --
        ROUTES.forEach((route) => {
          const p0 = pixels[route.source];
          const p2 = pixels[route.target];
          const r0 = radii[route.source];
          const r2 = radii[route.target];
          const color = ROUTE_TYPES[route.type].color;

          const mx = (p0.x + p2.x) / 2;
          const my = (p0.y + p2.y) / 2;
          const cx = mx + route.curveNx * route.curveOffset;
          const cy = my + route.curveNy * route.curveOffset;

          // Trim the curve so it starts/ends at the node's edge, not center.
          const s0x = cx - p0.x;
          const s0y = cy - p0.y;
          const s0len = Math.hypot(s0x, s0y) || 1;
          const startX = p0.x + (s0x / s0len) * r0;
          const startY = p0.y + (s0y / s0len) * r0;

          const s1x = cx - p2.x;
          const s1y = cy - p2.y;
          const s1len = Math.hypot(s1x, s1y) || 1;
          const tipX = p2.x + (s1x / s1len) * r2;
          const tipY = p2.y + (s1y / s1len) * r2;

          // Arrowhead: a small triangle oriented along the arrival tangent
          // (from the control point toward the trimmed end point).
          const adx = tipX - cx;
          const ady = tipY - cy;
          const alen = Math.hypot(adx, ady) || 1;
          const adirX = adx / alen;
          const adirY = ady / alen;
          const ARROW_LEN = 15;
          const ARROW_W = 8.5;
          const baseX = tipX - adirX * ARROW_LEN;
          const baseY = tipY - adirY * ARROW_LEN;
          const perpX = -adirY;
          const perpY = adirX;

          renderer
            .path(["M", startX, startY, "Q", cx, cy, baseX, baseY])
            .attr({ stroke: color, "stroke-width": 2.5, fill: "none", opacity: 0.85, zIndex: 2 })
            .add();
          renderer
            .path([
              "M", tipX, tipY,
              "L", baseX + perpX * ARROW_W, baseY + perpY * ARROW_W,
              "L", baseX - perpX * ARROW_W, baseY - perpY * ARROW_W,
              "Z",
            ])
            .attr({ fill: color, stroke: "none", zIndex: 3 })
            .add();

          // Edge label ("route id | dep -> arr") on a legible backing box,
          // offset from the station-pair midpoint (see LABEL_PERP_STEP /
          // LABEL_ALONG_STEP above) so parallel-edge labels don't stack.
          const labelX = mx + route.labelPerpX + route.labelAlongX;
          const labelY = my + route.labelPerpY + route.labelAlongY;
          const labelText = `${route.id} | ${route.dep}→${route.arr}`;
          const box = labelBoxFor(labelText, labelX, labelY);
          renderer
            .rect(box.x - 5, box.y - 3, box.width + 10, box.height + 6, 4)
            .attr({ fill: t.elevatedBg, stroke: color, "stroke-width": 1, opacity: 0.92, zIndex: 5 })
            .add();
          renderer
            .text(labelText, labelX, labelY)
            .attr({ align: "center", zIndex: 6 })
            .css({ color: t.ink, fontSize: `${LABEL_FONT_SIZE}px`, fontWeight: String(LABEL_FONT_WEIGHT) })
            .add();
        });

        // --- Nodes: circle + station code inside, full name outside ------
        STATIONS.forEach((station) => {
          const p = pixels[station.id];
          const r = radii[station.id];
          renderer
            .circle(p.x, p.y, r)
            .attr({ fill: t.elevatedBg, stroke: t.ink, "stroke-width": 2.5, zIndex: 8 })
            .add();
          renderer
            .text(station.id, p.x, p.y + 5)
            .attr({ align: "center", zIndex: 9 })
            .css({ color: t.ink, fontSize: "13px", fontWeight: "700" })
            .add();
          const anchor = labelAnchor(p, r, station.dir);
          renderer
            .text(station.label, anchor.x, anchor.y)
            .attr({ align: anchor.align, zIndex: 9 })
            .css({ color: t.ink, fontSize: "15px", fontWeight: "600" })
            .add();
        });
      },
    },
  },
  title: {
    text: TITLE,
    style: { color: t.ink, fontSize: TITLE_FONT_SIZE, fontWeight: "600" },
  },
  subtitle: {
    text: "12 stations · 24 scheduled services — curved edges mark multiple daily services between the same stations",
    style: { color: t.inkSoft, fontSize: "14px" },
  },
  credits: { enabled: false },
  xAxis: { visible: false },
  yAxis: { visible: false },
  legend: {
    enabled: true,
    verticalAlign: "bottom",
    itemStyle: { color: t.inkSoft, fontSize: "14px" },
    itemHoverStyle: { color: t.ink },
  },
  plotOptions: { series: { animation: false, enableMouseTracking: false } },
  series: Object.values(ROUTE_TYPES).map((rt) => ({
    type: "line",
    name: rt.name,
    data: [],
    color: rt.color,
    lineWidth: 4,
    marker: { enabled: false },
    showInLegend: true,
  })),
});
Runnable source as JSON, for any HTTP client: https://api.anyplot.ai/specs/network-transport-static/highcharts/code. Any spec id and library id listed in llms-full.txt fit the same URL shape; every URL below is complete and callable.
{
  "spec_id": "network-transport-static",
  "language": "javascript",
  "library": "highcharts",
  "page": "https://anyplot.ai/network-transport-static/javascript/highcharts",
  "hub": "https://anyplot.ai/network-transport-static",
  "code_json": "https://api.anyplot.ai/specs/network-transport-static/highcharts/code",
  "spec_json": "https://api.anyplot.ai/specs/network-transport-static",
  "render_light_png": "https://storage.googleapis.com/anyplot-images/plots/network-transport-static/javascript/highcharts/plot-light.png",
  "render_dark_png": "https://storage.googleapis.com/anyplot-images/plots/network-transport-static/javascript/highcharts/plot-dark.png",
  "interactive_light_html": "https://storage.googleapis.com/anyplot-images/plots/network-transport-static/javascript/highcharts/plot-light.html",
  "interactive_dark_html": "https://storage.googleapis.com/anyplot-images/plots/network-transport-static/javascript/highcharts/plot-dark.html",
  "quality_score": 84.0,
  "license": "MIT",
  "guide": "https://anyplot.ai/llms.txt"
}
Part of Static Transport Network Diagram on anyplot.ai.