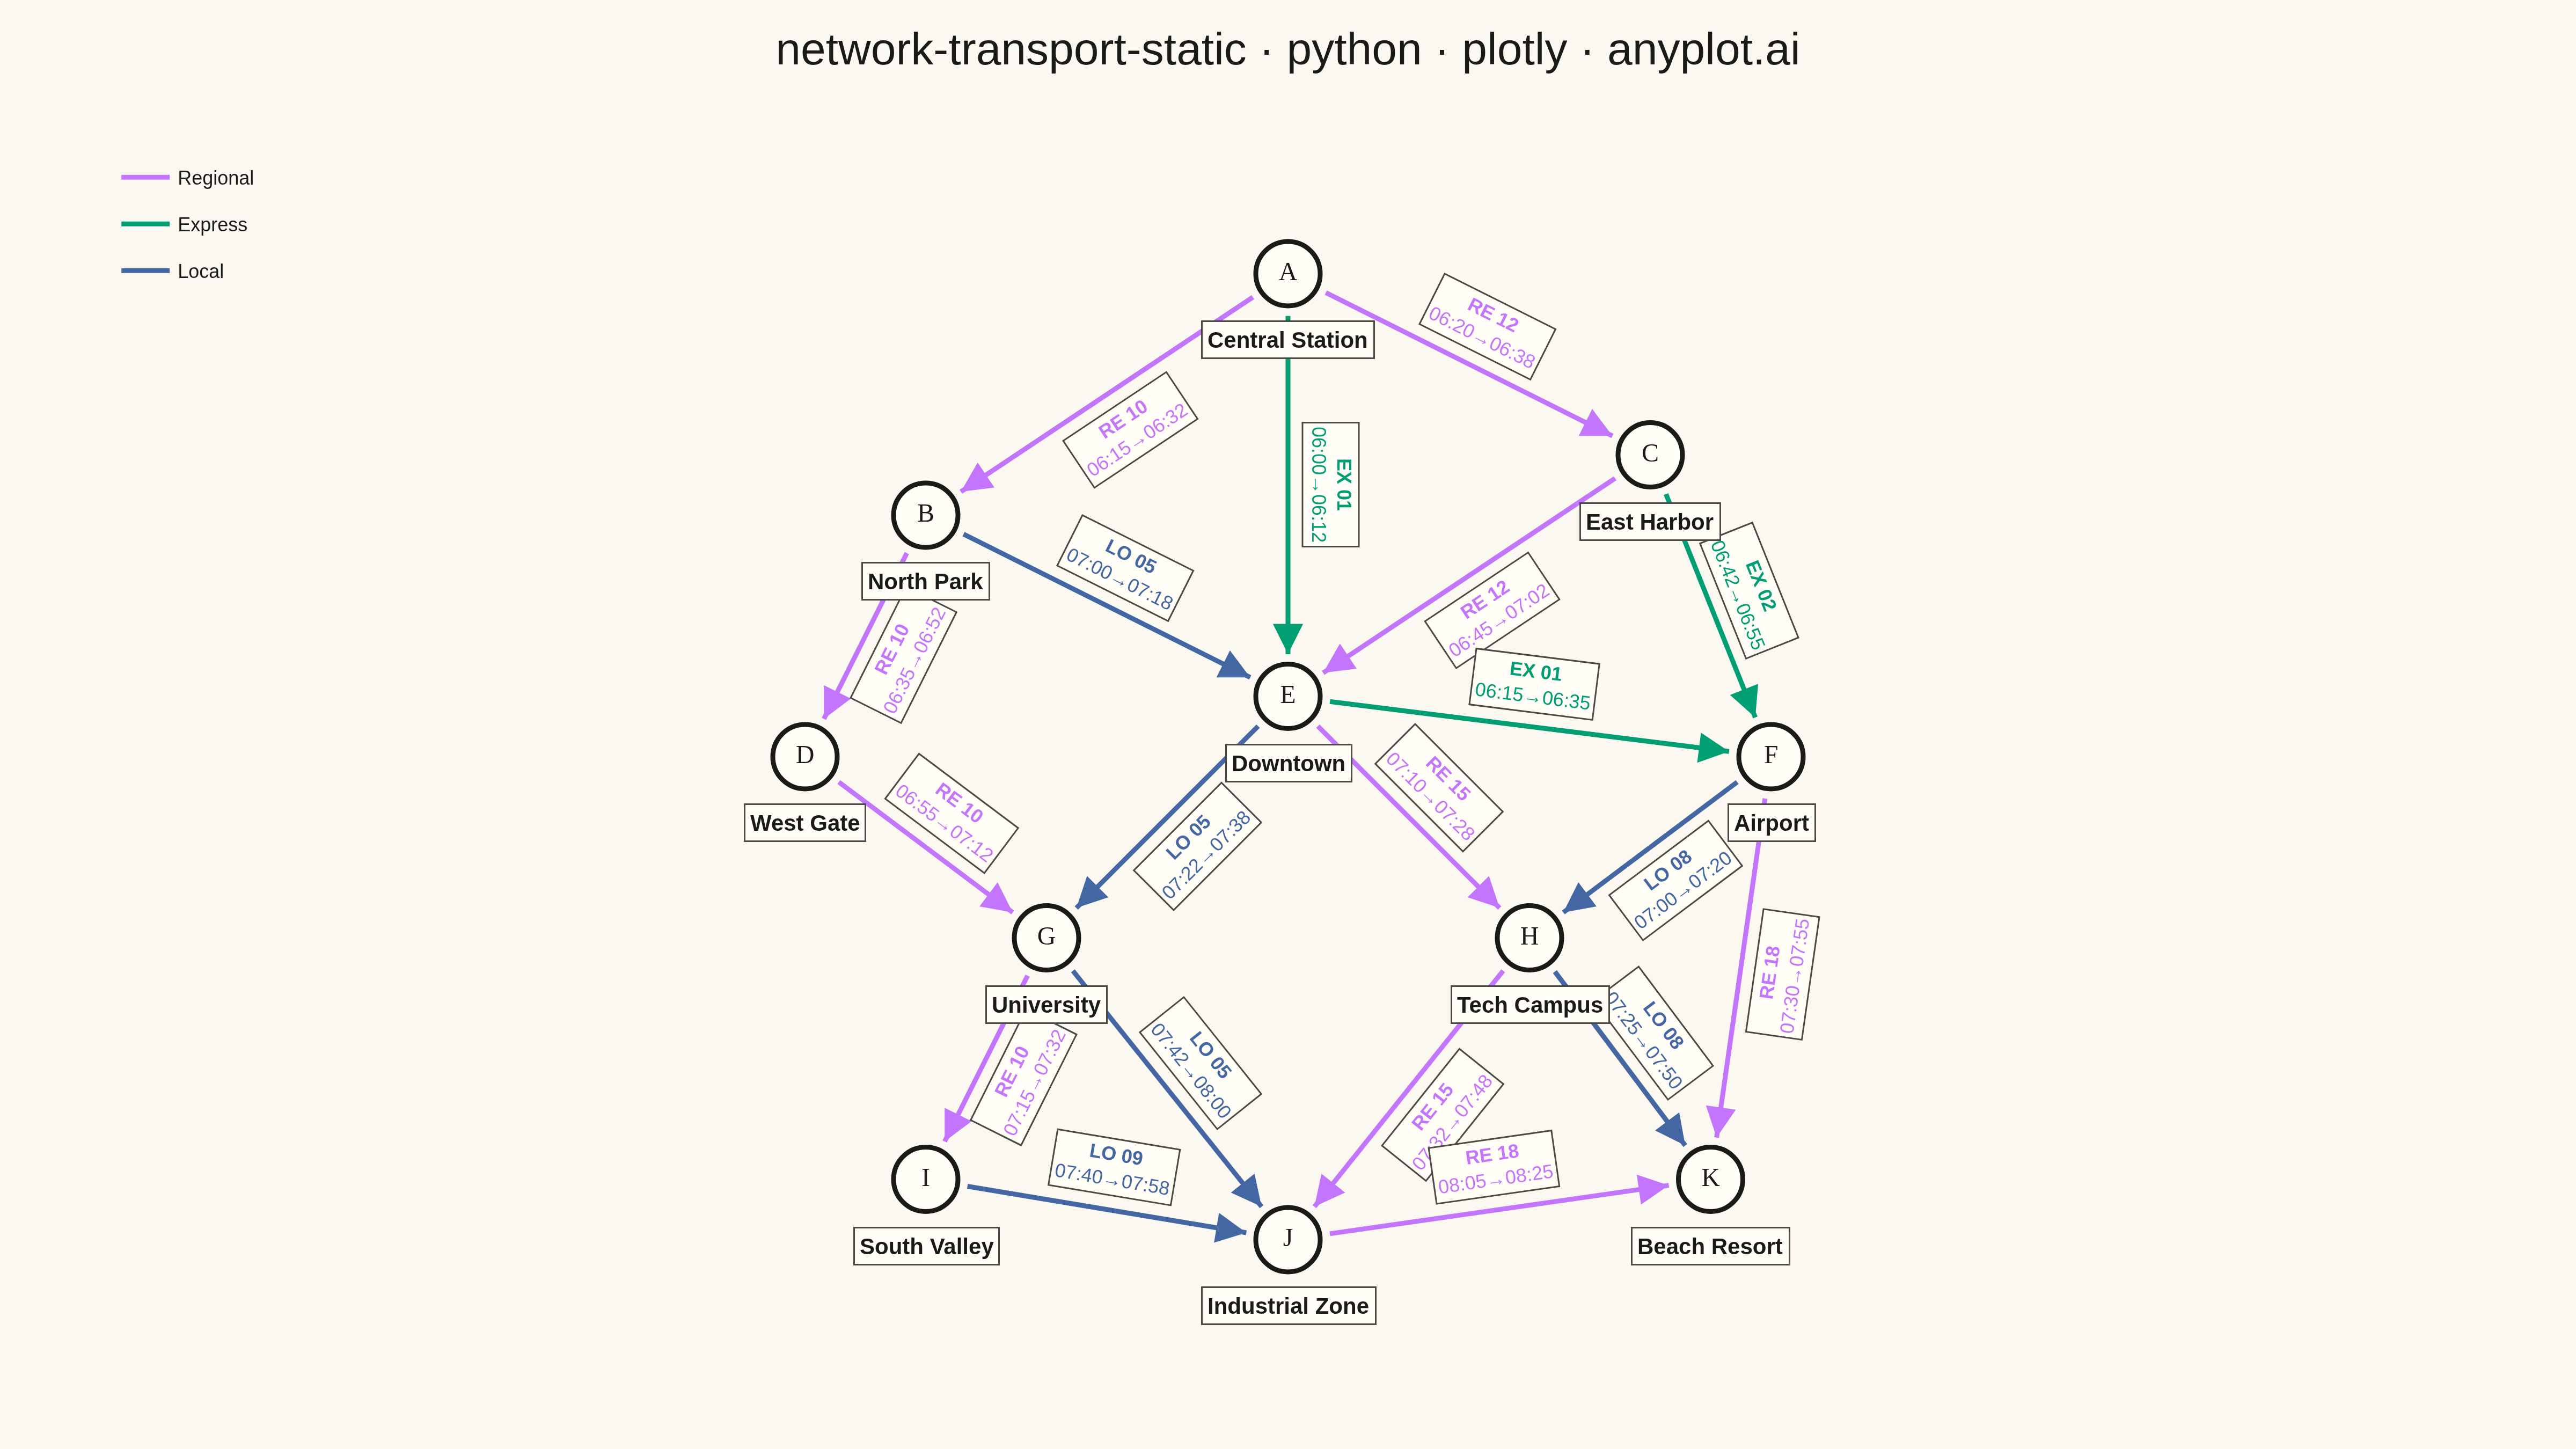
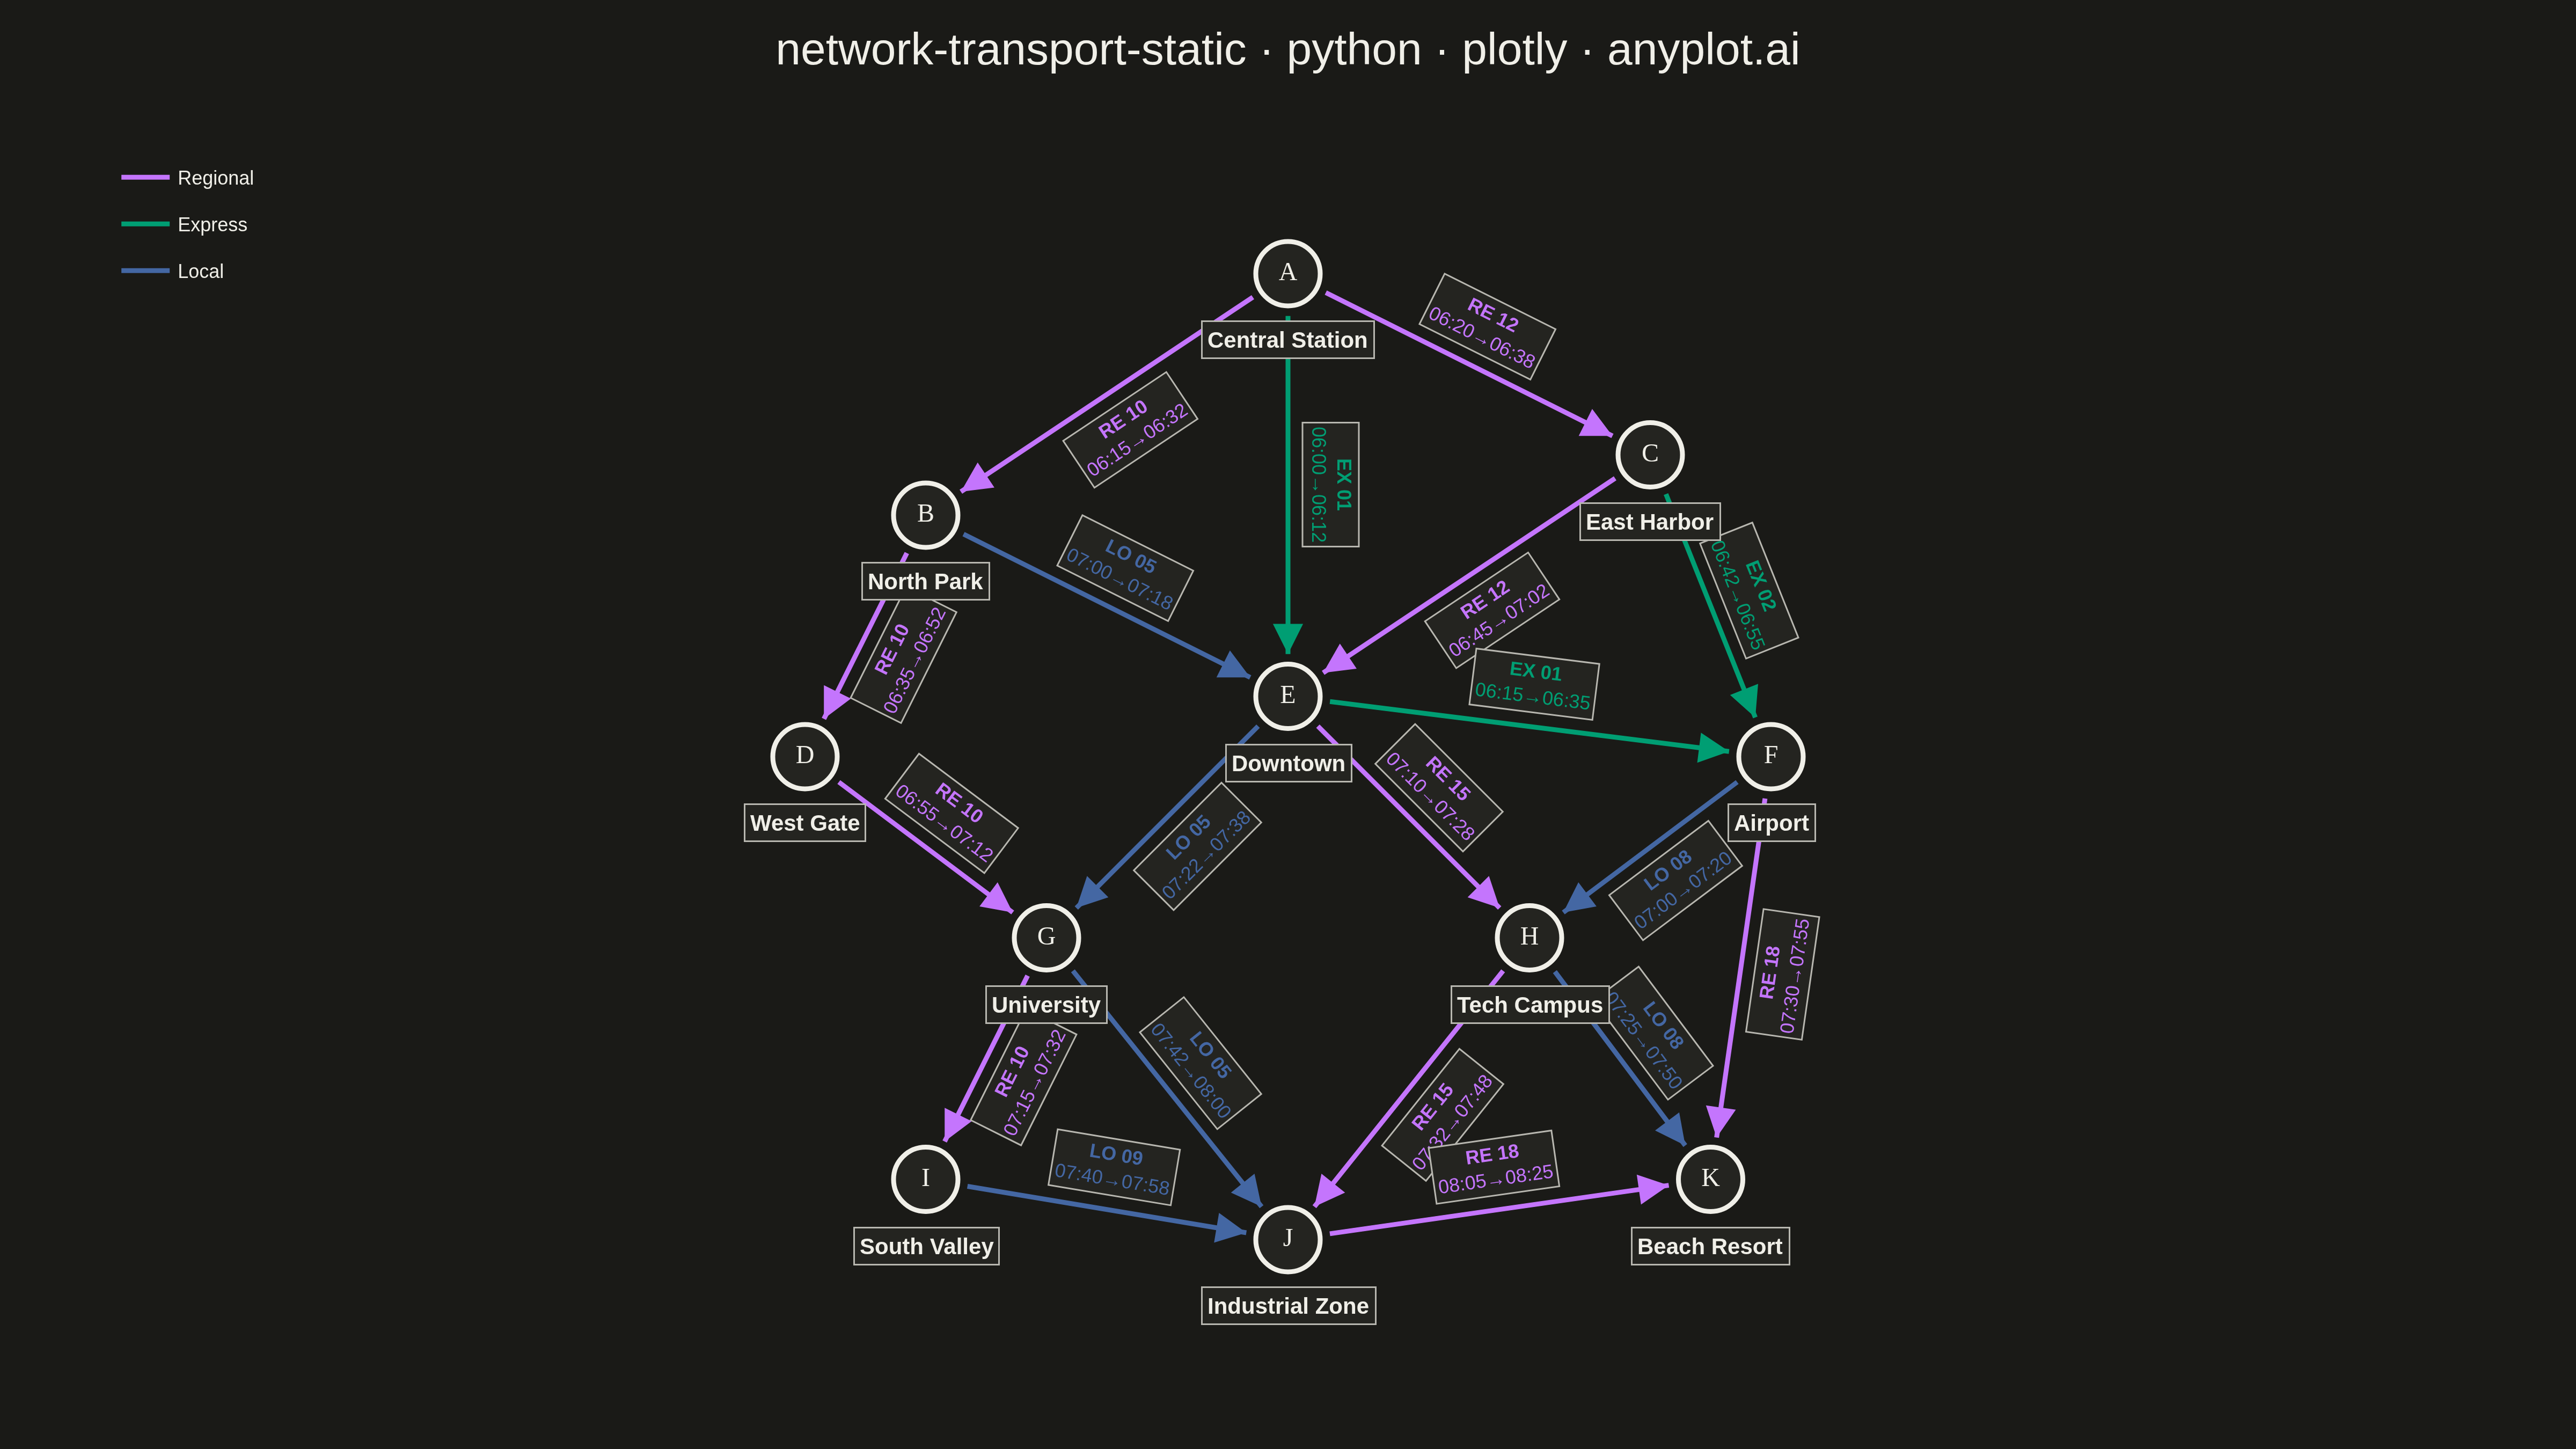
A directed network visualization for transportation systems where stations are displayed as labeled nodes and train/bus routes as directed edges. Edges display departure times, arrival times, and route identifiers. Designed for visualizing timetables, route maps, and connection patterns in rail, bus, or flight networks. This static version focuses on clear, readable presentation without interactive repositioning.
""" anyplot.ai
network-transport-static: Static Transport Network Diagram
Library: plotly 6.7.0 | Python 3.13.13
Quality: 88/100 | Updated: 2026-05-18
"""

import os

import numpy as np
import plotly.graph_objects as go


# Theme-adaptive tokens
THEME = os.getenv("ANYPLOT_THEME", "light")
PAGE_BG = "#FAF8F1" if THEME == "light" else "#1A1A17"
ELEVATED_BG = "#FFFDF6" if THEME == "light" else "#242420"
INK = "#1A1A17" if THEME == "light" else "#F0EFE8"
INK_SOFT = "#4A4A44" if THEME == "light" else "#B8B7B0"
RULE = "rgba(26,26,23,0.10)" if THEME == "light" else "rgba(240,239,232,0.10)"

# Okabe-Ito palette for route types
IMPRINT = {
    "express": "#009E73",  # Position 1 - brand green
    "regional": "#C475FD",  # Position 2 - vermillion
    "local": "#4467A3",  # Position 3 - blue
}

np.random.seed(42)

# Data: Regional rail network stations with coordinates
stations = [
    {"id": "A", "label": "Central Station", "x": 0.5, "y": 0.9},
    {"id": "B", "label": "North Park", "x": 0.2, "y": 0.7},
    {"id": "C", "label": "East Harbor", "x": 0.8, "y": 0.75},
    {"id": "D", "label": "West Gate", "x": 0.1, "y": 0.5},
    {"id": "E", "label": "Downtown", "x": 0.5, "y": 0.55},
    {"id": "F", "label": "Airport", "x": 0.9, "y": 0.5},
    {"id": "G", "label": "University", "x": 0.3, "y": 0.35},
    {"id": "H", "label": "Tech Campus", "x": 0.7, "y": 0.35},
    {"id": "I", "label": "South Valley", "x": 0.2, "y": 0.15},
    {"id": "J", "label": "Industrial Zone", "x": 0.5, "y": 0.1},
    {"id": "K", "label": "Beach Resort", "x": 0.85, "y": 0.15},
]

# Create station lookup
station_lookup = {s["id"]: s for s in stations}

# Routes: Train services with times (route_type for color coding)
routes = [
    {"source": "A", "target": "B", "route_id": "RE 10", "dep": "06:15", "arr": "06:32", "type": "regional"},
    {"source": "A", "target": "C", "route_id": "RE 12", "dep": "06:20", "arr": "06:38", "type": "regional"},
    {"source": "A", "target": "E", "route_id": "EX 01", "dep": "06:00", "arr": "06:12", "type": "express"},
    {"source": "B", "target": "D", "route_id": "RE 10", "dep": "06:35", "arr": "06:52", "type": "regional"},
    {"source": "B", "target": "E", "route_id": "LO 05", "dep": "07:00", "arr": "07:18", "type": "local"},
    {"source": "C", "target": "F", "route_id": "EX 02", "dep": "06:42", "arr": "06:55", "type": "express"},
    {"source": "C", "target": "E", "route_id": "RE 12", "dep": "06:45", "arr": "07:02", "type": "regional"},
    {"source": "D", "target": "G", "route_id": "RE 10", "dep": "06:55", "arr": "07:12", "type": "regional"},
    {"source": "E", "target": "G", "route_id": "LO 05", "dep": "07:22", "arr": "07:38", "type": "local"},
    {"source": "E", "target": "H", "route_id": "RE 15", "dep": "07:10", "arr": "07:28", "type": "regional"},
    {"source": "E", "target": "F", "route_id": "EX 01", "dep": "06:15", "arr": "06:35", "type": "express"},
    {"source": "F", "target": "H", "route_id": "LO 08", "dep": "07:00", "arr": "07:20", "type": "local"},
    {"source": "F", "target": "K", "route_id": "RE 18", "dep": "07:30", "arr": "07:55", "type": "regional"},
    {"source": "G", "target": "I", "route_id": "RE 10", "dep": "07:15", "arr": "07:32", "type": "regional"},
    {"source": "G", "target": "J", "route_id": "LO 05", "dep": "07:42", "arr": "08:00", "type": "local"},
    {"source": "H", "target": "J", "route_id": "RE 15", "dep": "07:32", "arr": "07:48", "type": "regional"},
    {"source": "H", "target": "K", "route_id": "LO 08", "dep": "07:25", "arr": "07:50", "type": "local"},
    {"source": "I", "target": "J", "route_id": "LO 09", "dep": "07:40", "arr": "07:58", "type": "local"},
    {"source": "J", "target": "K", "route_id": "RE 18", "dep": "08:05", "arr": "08:25", "type": "regional"},
]

# Create figure
fig = go.Figure()

# Track edge counts between station pairs for offset calculation
edge_counts = {}


def get_edge_offset(source, target, route_idx):
    key = tuple(sorted([source, target]))
    if key not in edge_counts:
        edge_counts[key] = 0
    offset_idx = edge_counts[key]
    edge_counts[key] += 1
    if offset_idx == 0:
        return 0
    sign = 1 if offset_idx % 2 == 1 else -1
    magnitude = ((offset_idx + 1) // 2) * 0.04
    return sign * magnitude


# Track which route types we've added to legend
legend_items = set()

# Draw edges (routes) with arrows
for i, route in enumerate(routes):
    src = station_lookup[route["source"]]
    tgt = station_lookup[route["target"]]

    x0, y0 = src["x"], src["y"]
    x1, y1 = tgt["x"], tgt["y"]

    offset = get_edge_offset(route["source"], route["target"], i)

    dx = x1 - x0
    dy = y1 - y0
    length = np.sqrt(dx**2 + dy**2)
    px, py = -dy / length, dx / length

    x0_off = x0 + px * offset
    y0_off = y0 + py * offset
    x1_off = x1 + px * offset
    y1_off = y1 + py * offset

    shrink = 0.035
    x0_draw = x0_off + shrink * dx / length
    y0_draw = y0_off + shrink * dy / length
    x1_draw = x1_off - shrink * dx / length
    y1_draw = y1_off - shrink * dy / length

    color = IMPRINT[route["type"]]
    show_in_legend = route["type"] not in legend_items
    legend_items.add(route["type"])

    # Draw edge line
    fig.add_trace(
        go.Scatter(
            x=[x0_draw, x1_draw],
            y=[y0_draw, y1_draw],
            mode="lines",
            line=dict(color=color, width=3),
            hoverinfo="text",
            hovertext=f"{route['route_id']}: {src['label']} → {tgt['label']}<br>{route['dep']} → {route['arr']}",
            showlegend=show_in_legend,
            name=route["type"].capitalize(),
            legendgroup=route["type"],
        )
    )

    # Add arrow annotation
    fig.add_annotation(
        x=x1_draw,
        y=y1_draw,
        ax=x0_draw,
        ay=y0_draw,
        xref="x",
        yref="y",
        axref="x",
        ayref="y",
        showarrow=True,
        arrowhead=2,
        arrowsize=1.5,
        arrowwidth=2.5,
        arrowcolor=color,
        standoff=0,
    )

    # Add route label at midpoint
    mx = (x0_draw + x1_draw) / 2
    my = (y0_draw + y1_draw) / 2

    # Increase label offset in central area to reduce overlap
    label_offset = 0.035
    mx_label = mx + px * label_offset
    my_label = my + py * label_offset

    angle = np.degrees(np.arctan2(dy, dx))
    if angle > 90:
        angle -= 180
    elif angle < -90:
        angle += 180

    fig.add_annotation(
        x=mx_label,
        y=my_label,
        text=f"<b>{route['route_id']}</b><br>{route['dep']}→{route['arr']}",
        showarrow=False,
        font=dict(size=12, color=color),
        bgcolor=ELEVATED_BG,
        bordercolor=INK_SOFT,
        borderwidth=1,
        borderpad=2,
        textangle=-angle,
    )

# Draw station nodes
node_x = [s["x"] for s in stations]
node_y = [s["y"] for s in stations]
node_labels = [s["label"] for s in stations]
node_ids = [s["id"] for s in stations]

fig.add_trace(
    go.Scatter(
        x=node_x,
        y=node_y,
        mode="markers+text",
        marker=dict(size=40, color=ELEVATED_BG, line=dict(color=INK, width=3)),
        text=node_ids,
        textfont=dict(size=16, color=INK, family="Arial Black"),
        textposition="middle center",
        hoverinfo="text",
        hovertext=[f"<b>{nid}</b>: {label}" for nid, label in zip(node_ids, node_labels)],
        showlegend=False,
    )
)

# Add station name labels below nodes
for station in stations:
    fig.add_annotation(
        x=station["x"],
        y=station["y"] - 0.055,
        text=f"<b>{station['label']}</b>",
        showarrow=False,
        font=dict(size=14, color=INK),
        bgcolor=ELEVATED_BG,
        bordercolor=INK_SOFT,
        borderwidth=1,
        borderpad=3,
    )


# Update layout
fig.update_layout(
    title=dict(
        text="network-transport-static · python · plotly · anyplot.ai",
        font=dict(size=28, color=INK),
        x=0.5,
        xanchor="center",
    ),
    xaxis=dict(showgrid=False, zeroline=False, showticklabels=False, range=[-0.05, 1.05]),
    yaxis=dict(
        showgrid=False, zeroline=False, showticklabels=False, range=[-0.02, 1.02], scaleanchor="x", scaleratio=1
    ),
    plot_bgcolor=PAGE_BG,
    paper_bgcolor=PAGE_BG,
    font=dict(color=INK),
    margin=dict(l=40, r=40, t=80, b=40),
    showlegend=True,
    legend=dict(x=0.02, y=0.98, bgcolor="rgba(0,0,0,0)", borderwidth=0),
)

# Save outputs
fig.write_image(f"plot-{THEME}.png", width=1600, height=900, scale=3)
fig.write_html(f"plot-{THEME}.html", include_plotlyjs="cdn")
Runnable source as JSON, for any HTTP client: https://api.anyplot.ai/specs/network-transport-static/plotly/code. Any spec id and library id listed in llms-full.txt fit the same URL shape; every URL below is complete and callable.
{
  "spec_id": "network-transport-static",
  "language": "python",
  "library": "plotly",
  "page": "https://anyplot.ai/network-transport-static/python/plotly",
  "hub": "https://anyplot.ai/network-transport-static",
  "code_json": "https://api.anyplot.ai/specs/network-transport-static/plotly/code",
  "spec_json": "https://api.anyplot.ai/specs/network-transport-static",
  "render_light_png": "https://storage.googleapis.com/anyplot-images/plots/network-transport-static/python/plotly/plot-light.png",
  "render_dark_png": "https://storage.googleapis.com/anyplot-images/plots/network-transport-static/python/plotly/plot-dark.png",
  "interactive_light_html": "https://storage.googleapis.com/anyplot-images/plots/network-transport-static/python/plotly/plot-light.html",
  "interactive_dark_html": "https://storage.googleapis.com/anyplot-images/plots/network-transport-static/python/plotly/plot-dark.html",
  "quality_score": 88.0,
  "license": "MIT",
  "guide": "https://anyplot.ai/llms.txt"
}
Part of Static Transport Network Diagram on anyplot.ai.