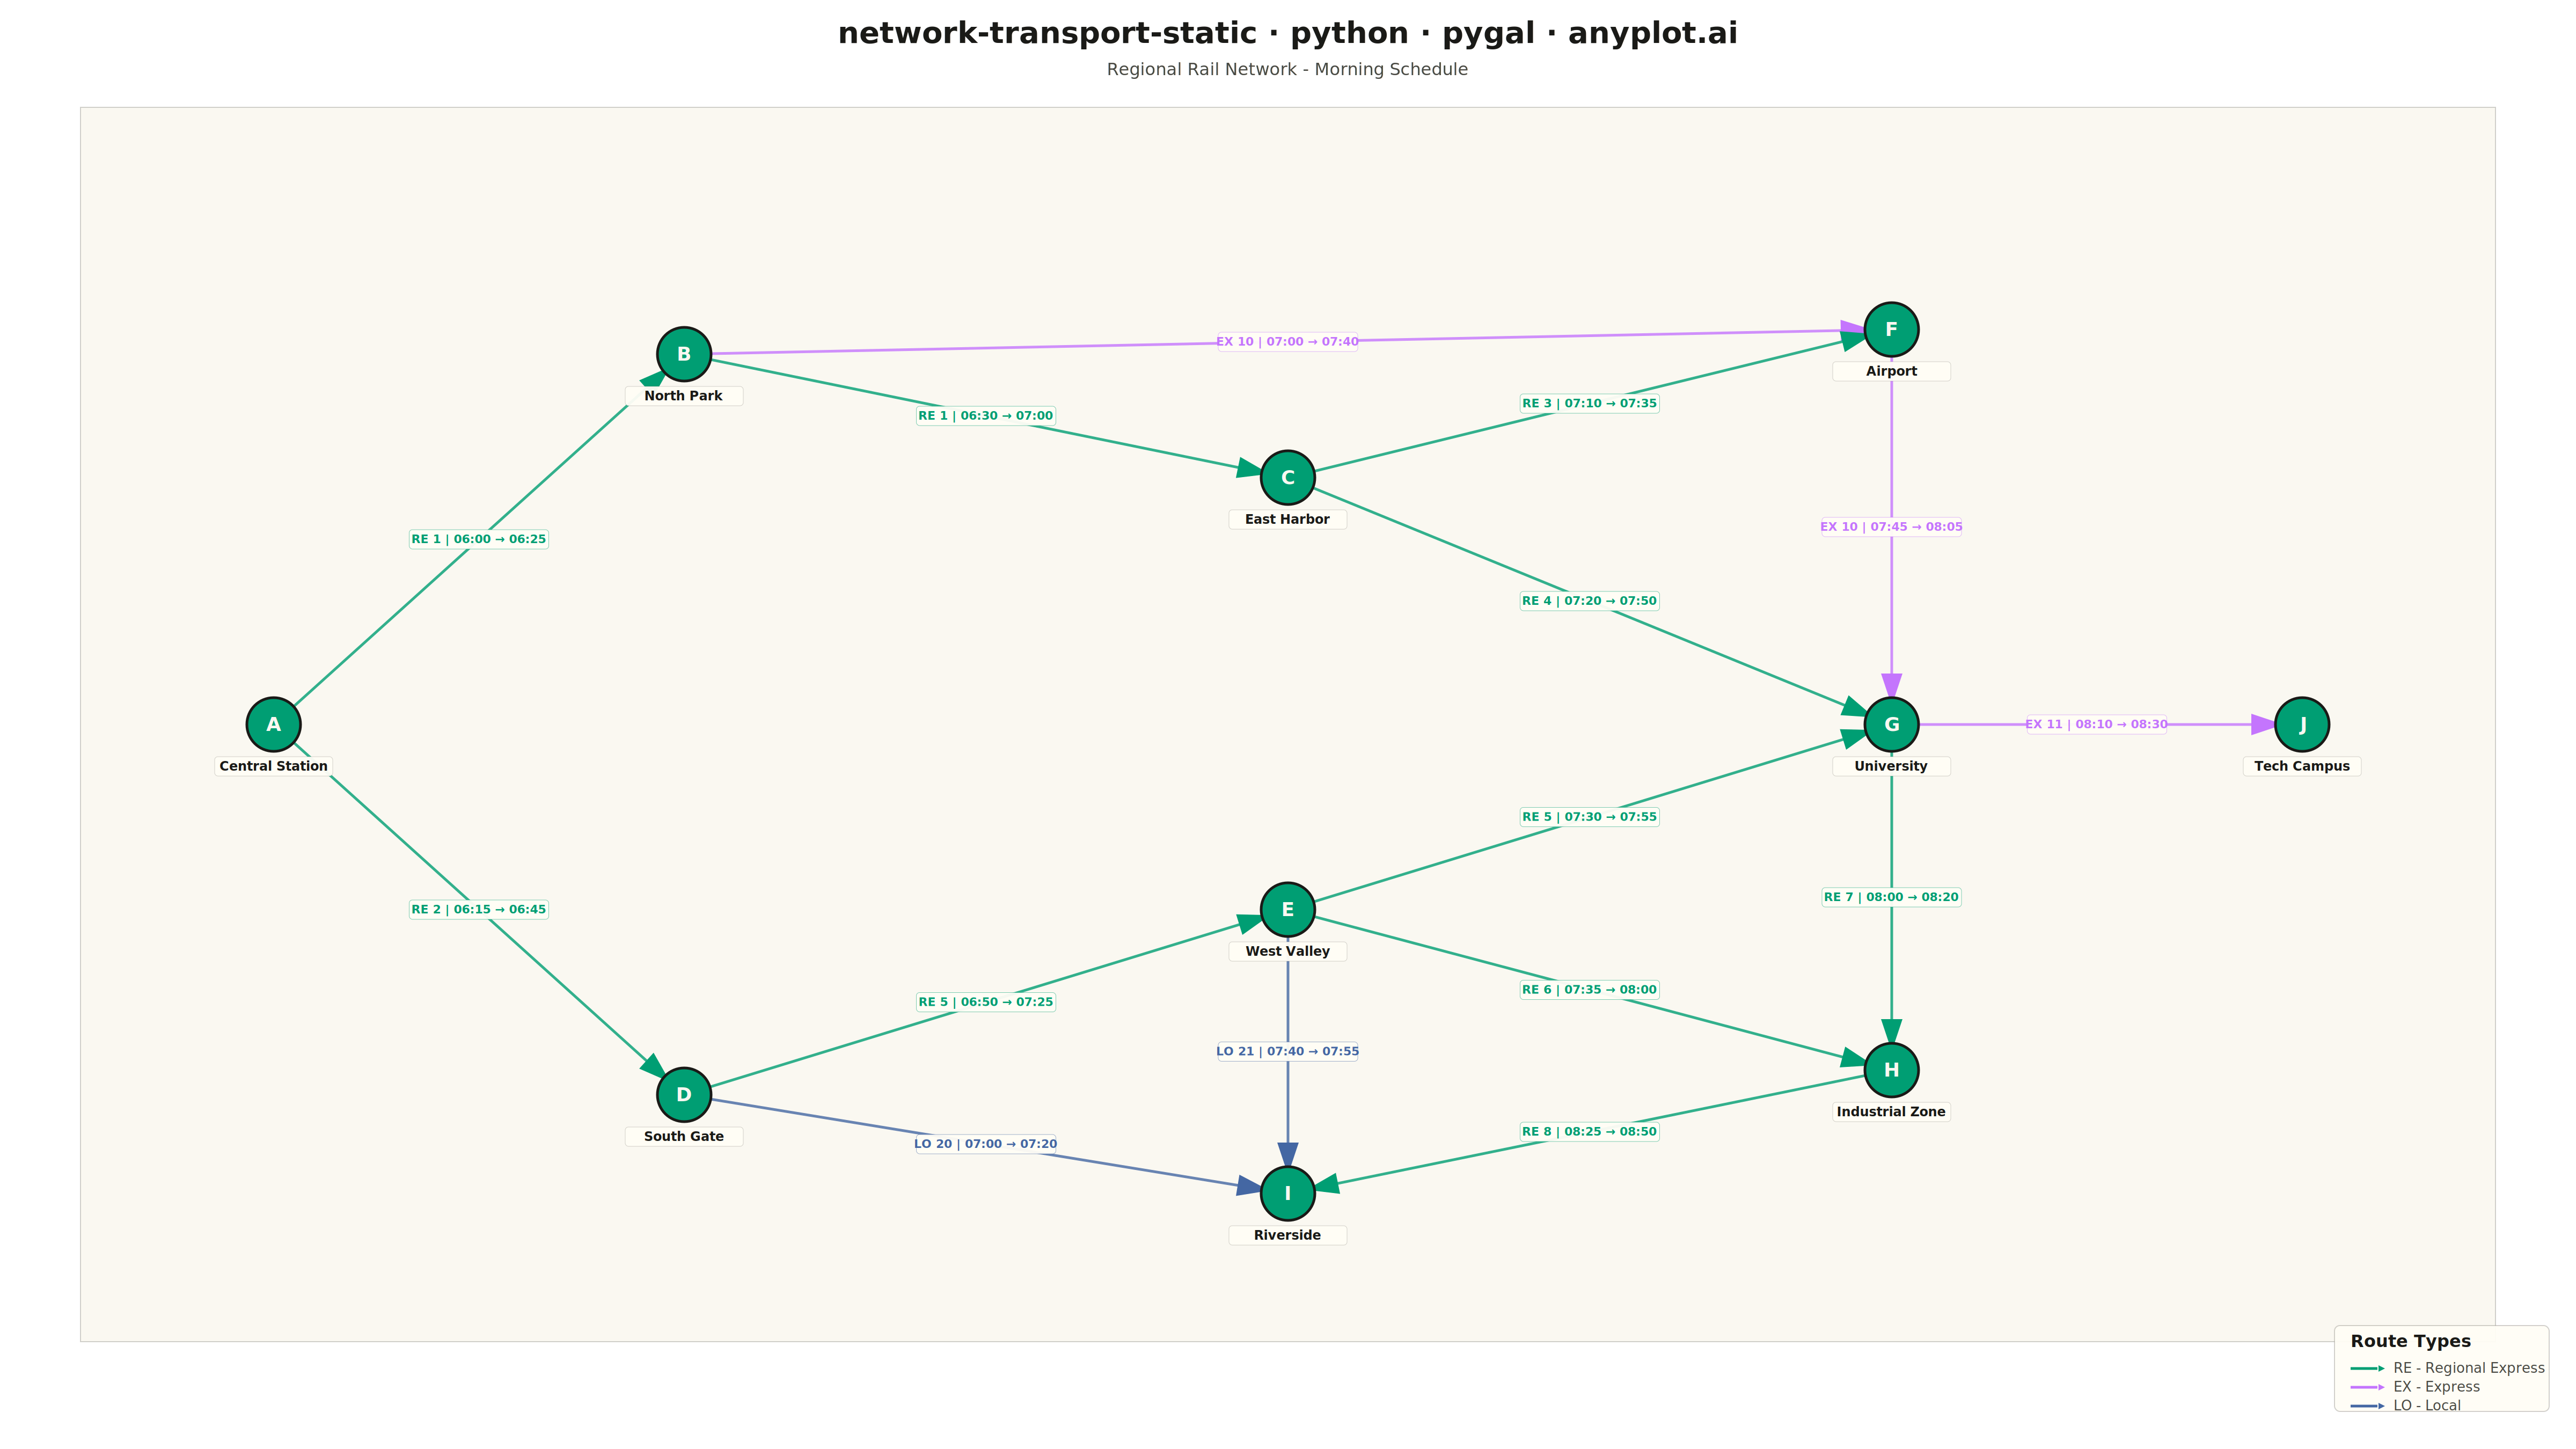
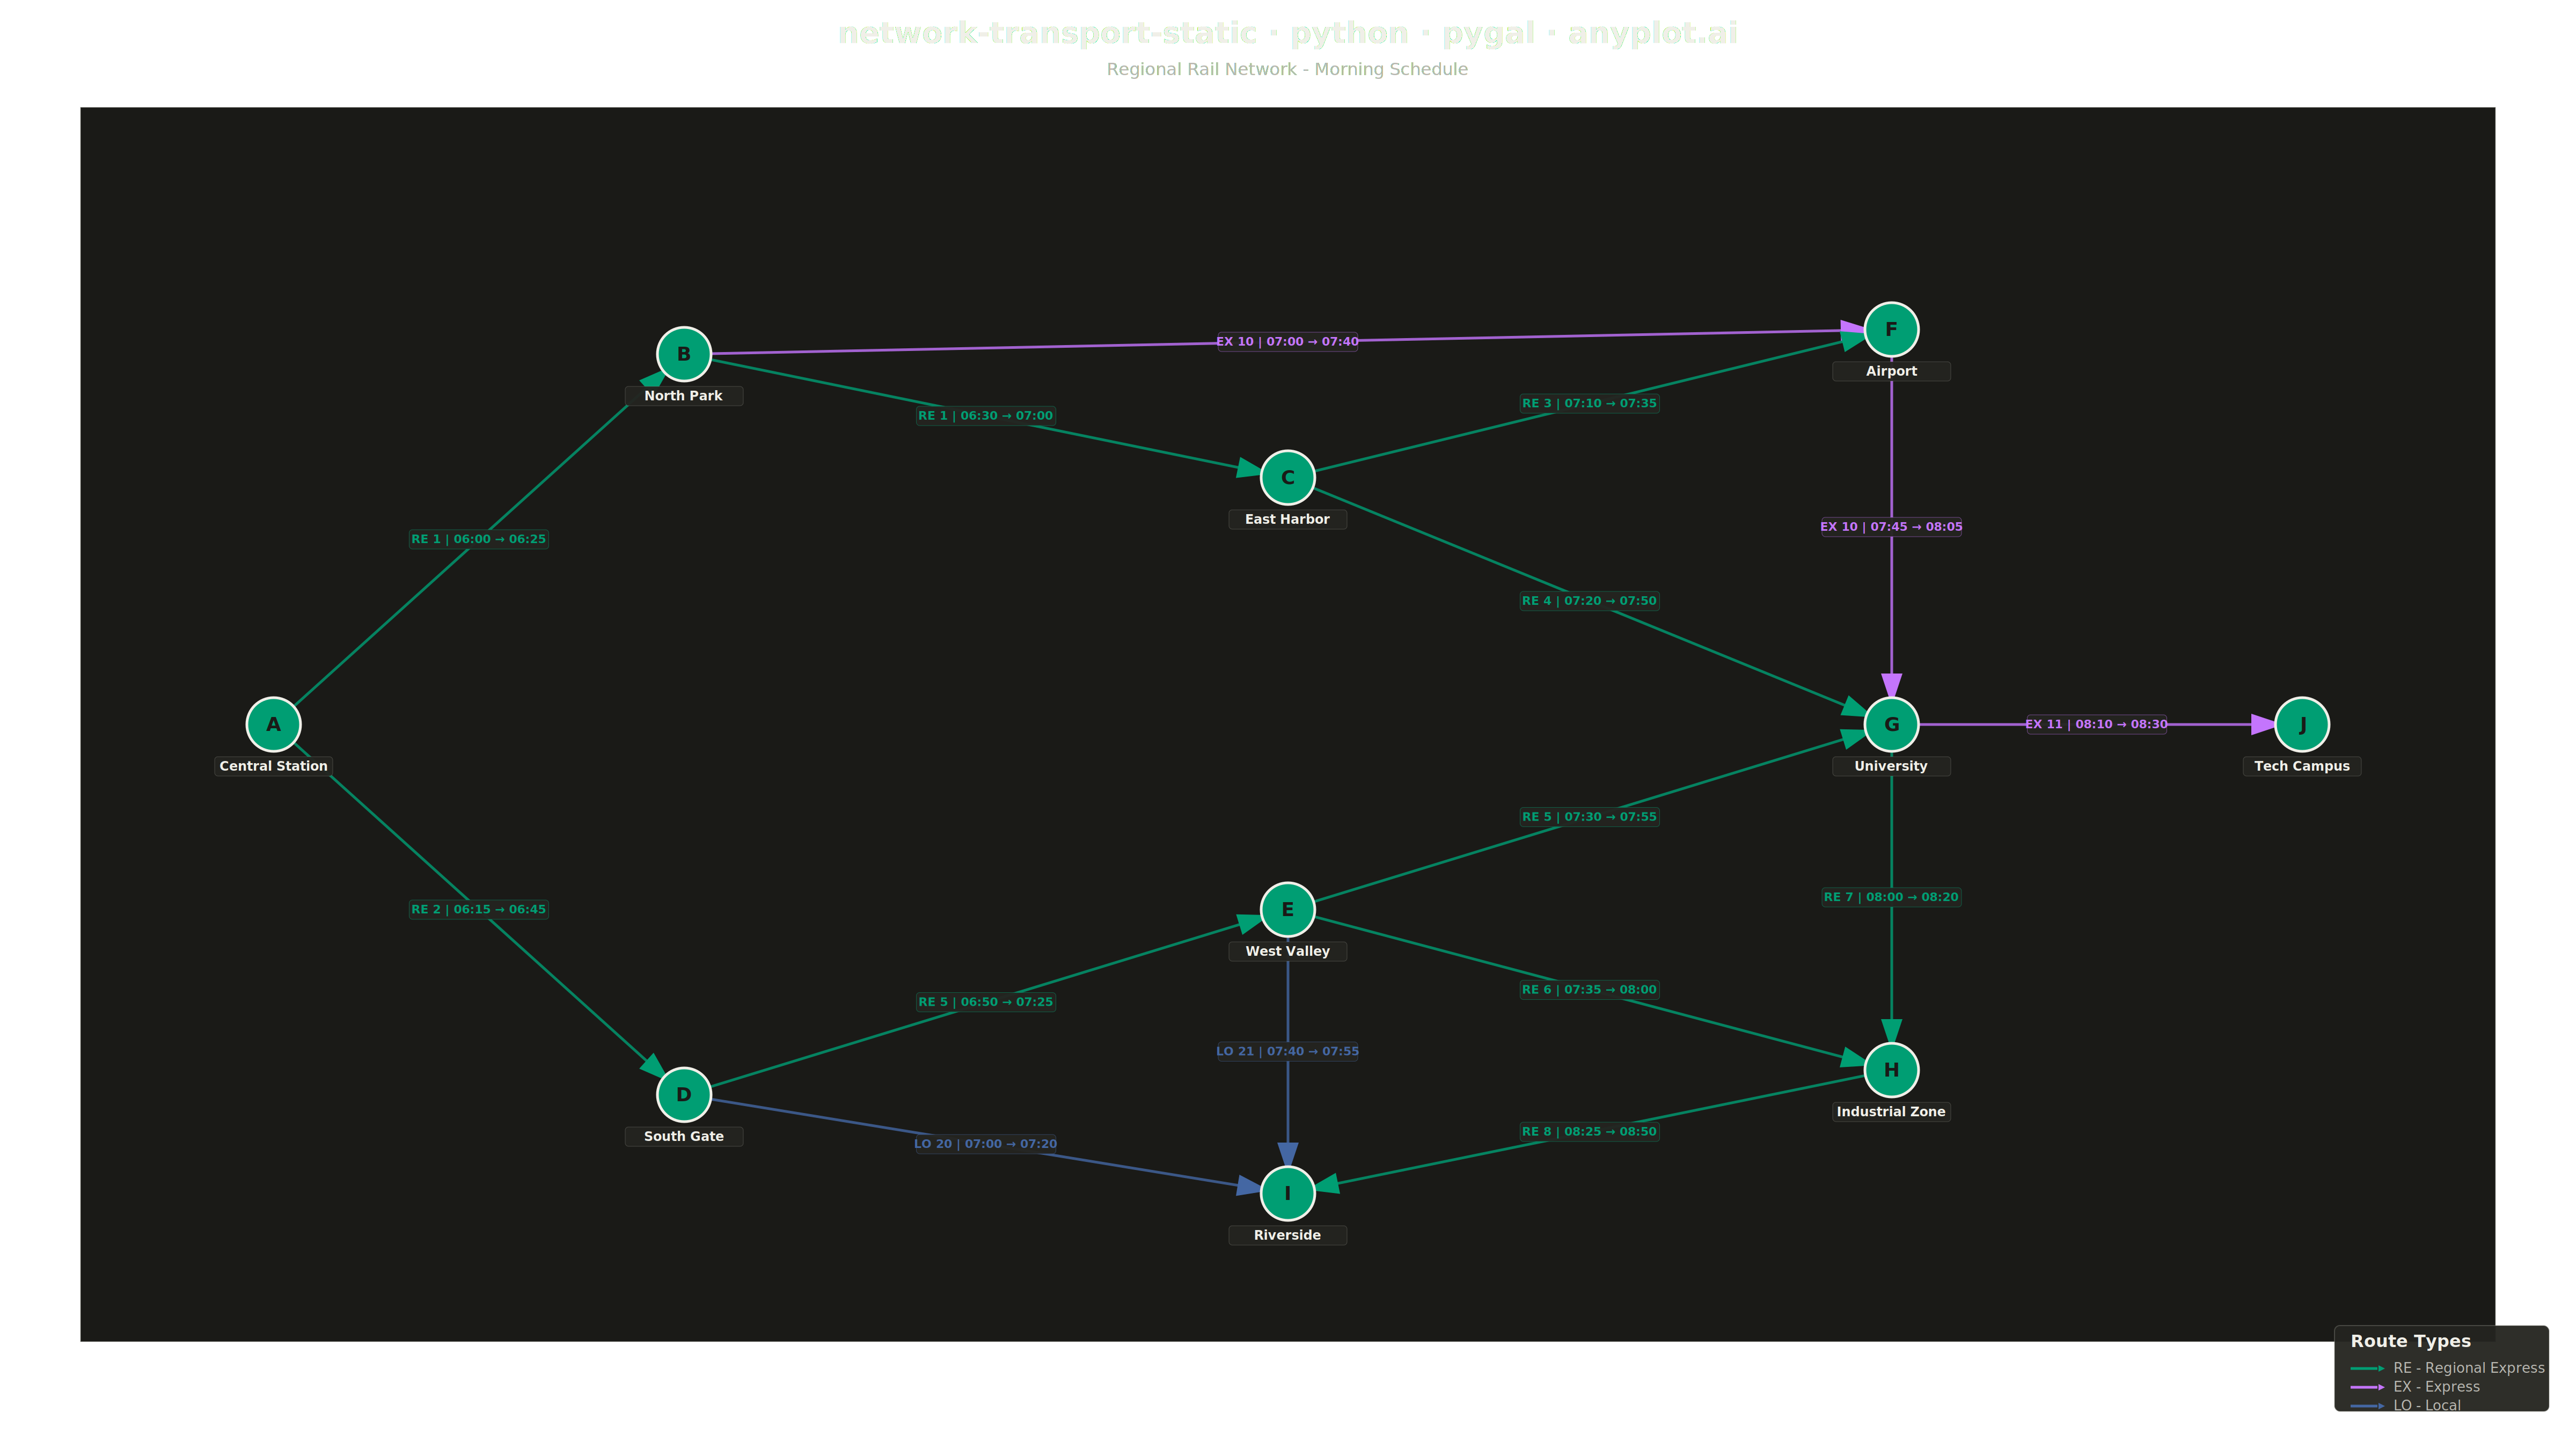
A directed network visualization for transportation systems where stations are displayed as labeled nodes and train/bus routes as directed edges. Edges display departure times, arrival times, and route identifiers. Designed for visualizing timetables, route maps, and connection patterns in rail, bus, or flight networks. This static version focuses on clear, readable presentation without interactive repositioning.
""" anyplot.ai
network-transport-static: Static Transport Network Diagram
Library: pygal 3.1.0 | Python 3.13.13
Quality: 87/100 | Updated: 2026-05-18
"""

import os
import sys
import xml.etree.ElementTree as ET


# Remove current directory from sys.path before importing to avoid circular import
_script_dir = os.path.dirname(os.path.abspath(__file__))
sys.path = [p for p in sys.path if os.path.abspath(p) != _script_dir]

import cairosvg


# Theme tokens
THEME = os.getenv("ANYPLOT_THEME", "light")
PAGE_BG = "#FAF8F1" if THEME == "light" else "#1A1A17"
INK = "#1A1A17" if THEME == "light" else "#F0EFE8"
INK_SOFT = "#4A4A44" if THEME == "light" else "#B8B7B0"
INK_MUTED = "#6B6A63" if THEME == "light" else "#A8A79F"
ELEVATED_BG = "#FFFDF6" if THEME == "light" else "#242420"

# Okabe-Ito palette (colorblind-safe)
BRAND = "#009E73"  # Position 1 - brand green
IMPRINT = ("#009E73", "#C475FD", "#4467A3", "#BD8233", "#AE3030", "#2ABCCD", "#954477")

# Route type colors (using Okabe-Ito positions)
route_colors = {
    "RE": IMPRINT[0],  # Regional Express - brand green
    "EX": IMPRINT[1],  # Express - vermillion
    "LO": IMPRINT[2],  # Local - blue
}

# Station data: regional rail network
stations = [
    {"id": "A", "label": "Central Station", "x": 0.08, "y": 0.50},
    {"id": "B", "label": "North Park", "x": 0.25, "y": 0.20},
    {"id": "C", "label": "East Harbor", "x": 0.50, "y": 0.30},
    {"id": "D", "label": "South Gate", "x": 0.25, "y": 0.80},
    {"id": "E", "label": "West Valley", "x": 0.50, "y": 0.65},
    {"id": "F", "label": "Airport", "x": 0.75, "y": 0.18},
    {"id": "G", "label": "University", "x": 0.75, "y": 0.50},
    {"id": "H", "label": "Industrial Zone", "x": 0.75, "y": 0.78},
    {"id": "I", "label": "Riverside", "x": 0.50, "y": 0.88},
    {"id": "J", "label": "Tech Campus", "x": 0.92, "y": 0.50},
]

# Routes: train services between stations
routes = [
    {"source": "A", "target": "B", "route_id": "RE 1", "dep": "06:00", "arr": "06:25"},
    {"source": "A", "target": "D", "route_id": "RE 2", "dep": "06:15", "arr": "06:45"},
    {"source": "B", "target": "C", "route_id": "RE 1", "dep": "06:30", "arr": "07:00"},
    {"source": "B", "target": "F", "route_id": "EX 10", "dep": "07:00", "arr": "07:40"},
    {"source": "C", "target": "F", "route_id": "RE 3", "dep": "07:10", "arr": "07:35"},
    {"source": "C", "target": "G", "route_id": "RE 4", "dep": "07:20", "arr": "07:50"},
    {"source": "D", "target": "E", "route_id": "RE 5", "dep": "06:50", "arr": "07:25"},
    {"source": "D", "target": "I", "route_id": "LO 20", "dep": "07:00", "arr": "07:20"},
    {"source": "E", "target": "G", "route_id": "RE 5", "dep": "07:30", "arr": "07:55"},
    {"source": "E", "target": "H", "route_id": "RE 6", "dep": "07:35", "arr": "08:00"},
    {"source": "E", "target": "I", "route_id": "LO 21", "dep": "07:40", "arr": "07:55"},
    {"source": "F", "target": "G", "route_id": "EX 10", "dep": "07:45", "arr": "08:05"},
    {"source": "G", "target": "J", "route_id": "EX 11", "dep": "08:10", "arr": "08:30"},
    {"source": "G", "target": "H", "route_id": "RE 7", "dep": "08:00", "arr": "08:20"},
    {"source": "H", "target": "I", "route_id": "RE 8", "dep": "08:25", "arr": "08:50"},
]

# Create station lookup
station_lookup = {s["id"]: s for s in stations}

# Chart dimensions (16:9 landscape)
WIDTH = 4800
HEIGHT = 2700

# Plotting area margins
margin_left = 150
margin_right = 150
margin_top = 200
margin_bottom = 200

plot_width = WIDTH - margin_left - margin_right
plot_height = HEIGHT - margin_top - margin_bottom


def normalize_to_svg(x_norm, y_norm):
    """Convert normalized (0-1) coordinates to SVG coordinates."""
    svg_x = margin_left + x_norm * plot_width
    svg_y = margin_top + y_norm * plot_height
    return svg_x, svg_y


# Build SVG using ElementTree
svg_ns = "http://www.w3.org/2000/svg"
ET.register_namespace("", svg_ns)

svg_root = ET.Element("svg", xmlns=svg_ns, width=str(WIDTH), height=str(HEIGHT), viewBox=f"0 0 {WIDTH} {HEIGHT}")
svg_root.set("style", f"background-color: {PAGE_BG};")

# Definitions for arrow markers
defs = ET.SubElement(svg_root, "defs")
for prefix, color in route_colors.items():
    marker = ET.SubElement(
        defs,
        "marker",
        id=f"arrow-{prefix}",
        markerWidth="12",
        markerHeight="12",
        refX="10",
        refY="4",
        orient="auto",
        markerUnits="strokeWidth",
    )
    path = ET.SubElement(marker, "path")
    path.set("d", "M0,0 L0,8 L12,4 z")
    path.set("fill", color)

# Add title
title_elem = ET.SubElement(svg_root, "text")
title_elem.set("x", str(WIDTH / 2))
title_elem.set("y", "80")
title_elem.set("text-anchor", "middle")
title_elem.set("fill", INK)
title_elem.set("font-size", "56")
title_elem.set("font-family", "sans-serif")
title_elem.set("font-weight", "bold")
title_elem.text = "network-transport-static · python · pygal · anyplot.ai"

# Subtitle
subtitle_elem = ET.SubElement(svg_root, "text")
subtitle_elem.set("x", str(WIDTH / 2))
subtitle_elem.set("y", "140")
subtitle_elem.set("text-anchor", "middle")
subtitle_elem.set("fill", INK_SOFT)
subtitle_elem.set("font-size", "32")
subtitle_elem.set("font-family", "sans-serif")
subtitle_elem.text = "Regional Rail Network - Morning Schedule"

# Plot background
plot_bg = ET.SubElement(svg_root, "rect")
plot_bg.set("x", str(margin_left))
plot_bg.set("y", str(margin_top))
plot_bg.set("width", str(plot_width))
plot_bg.set("height", str(plot_height))
plot_bg.set("fill", PAGE_BG)
plot_bg.set("stroke", INK_MUTED)
plot_bg.set("stroke-width", "2")
plot_bg.set("stroke-opacity", "0.3")

# Group for edges (routes)
edges_g = ET.SubElement(svg_root, "g")
edges_g.set("class", "routes")

# Track edge counts between station pairs for offset calculation
edge_counts = {}
for route in routes:
    key = tuple(sorted([route["source"], route["target"]]))
    edge_counts[key] = edge_counts.get(key, 0) + 1

edge_indices = {}

# Draw edges (routes)
for route in routes:
    src = station_lookup[route["source"]]
    tgt = station_lookup[route["target"]]

    x1, y1 = normalize_to_svg(src["x"], src["y"])
    x2, y2 = normalize_to_svg(tgt["x"], tgt["y"])

    # Get route color based on prefix
    route_prefix = route["route_id"].split()[0]
    color = route_colors.get(route_prefix, BRAND)

    # Calculate edge offset for multiple edges between same stations
    key = tuple(sorted([route["source"], route["target"]]))
    idx = edge_indices.get(key, 0)
    edge_indices[key] = idx + 1
    total = edge_counts[key]

    # Calculate perpendicular offset
    dx = x2 - x1
    dy = y2 - y1
    length = (dx**2 + dy**2) ** 0.5
    if length > 0 and total > 1:
        # Offset perpendicular to line
        offset_amount = (idx - (total - 1) / 2) * 35
        perp_x = -dy / length * offset_amount
        perp_y = dx / length * offset_amount
        x1 += perp_x
        y1 += perp_y
        x2 += perp_x
        y2 += perp_y

    # Shorten line to not overlap with node circles
    node_radius = 45
    if length > 0:
        # Shorten from start
        x1 += dx / length * node_radius
        y1 += dy / length * node_radius
        # Shorten from end
        x2 -= dx / length * node_radius
        y2 -= dy / length * node_radius

    # Draw edge line with arrow
    line = ET.SubElement(edges_g, "line")
    line.set("x1", f"{x1:.1f}")
    line.set("y1", f"{y1:.1f}")
    line.set("x2", f"{x2:.1f}")
    line.set("y2", f"{y2:.1f}")
    line.set("stroke", color)
    line.set("stroke-width", "5")
    line.set("stroke-opacity", "0.8")
    line.set("marker-end", f"url(#arrow-{route_prefix})")

    # Edge label at midpoint
    mid_x = (x1 + x2) / 2
    mid_y = (y1 + y2) / 2

    # Label background
    label_text = f"{route['route_id']} | {route['dep']} → {route['arr']}"
    label_bg = ET.SubElement(edges_g, "rect")
    label_bg.set("x", f"{mid_x - 130:.1f}")
    label_bg.set("y", f"{mid_y - 18:.1f}")
    label_bg.set("width", "260")
    label_bg.set("height", "36")
    label_bg.set("fill", ELEVATED_BG)
    label_bg.set("fill-opacity", "0.95")
    label_bg.set("rx", "6")
    label_bg.set("stroke", color)
    label_bg.set("stroke-width", "1")
    label_bg.set("stroke-opacity", "0.5")

    # Label text
    label_elem = ET.SubElement(edges_g, "text")
    label_elem.set("x", f"{mid_x:.1f}")
    label_elem.set("y", f"{mid_y + 7:.1f}")
    label_elem.set("text-anchor", "middle")
    label_elem.set("fill", color)
    label_elem.set("font-size", "22")
    label_elem.set("font-family", "sans-serif")
    label_elem.set("font-weight", "600")
    label_elem.text = label_text

    # Tooltip
    title = ET.SubElement(line, "title")
    title.text = f"{route['route_id']}: {route['dep']} → {route['arr']}"

# Group for nodes (stations)
nodes_g = ET.SubElement(svg_root, "g")
nodes_g.set("class", "stations")

# Draw nodes (stations) on top
for station in stations:
    x, y = normalize_to_svg(station["x"], station["y"])

    # Node outer circle (border)
    outer = ET.SubElement(nodes_g, "circle")
    outer.set("cx", f"{x:.1f}")
    outer.set("cy", f"{y:.1f}")
    outer.set("r", "50")
    outer.set("fill", BRAND)  # Okabe-Ito position 1
    outer.set("stroke", INK)
    outer.set("stroke-width", "5")

    # Station ID inside node
    id_elem = ET.SubElement(nodes_g, "text")
    id_elem.set("x", f"{x:.1f}")
    id_elem.set("y", f"{y + 12:.1f}")
    id_elem.set("text-anchor", "middle")
    id_elem.set("fill", PAGE_BG)
    id_elem.set("font-size", "36")
    id_elem.set("font-family", "sans-serif")
    id_elem.set("font-weight", "bold")
    id_elem.text = station["id"]

    # Station name label below node
    label_bg = ET.SubElement(nodes_g, "rect")
    label_bg.set("x", f"{x - 110:.1f}")
    label_bg.set("y", f"{y + 60:.1f}")
    label_bg.set("width", "220")
    label_bg.set("height", "36")
    label_bg.set("fill", ELEVATED_BG)
    label_bg.set("fill-opacity", "0.95")
    label_bg.set("rx", "6")
    label_bg.set("stroke", INK_MUTED)
    label_bg.set("stroke-width", "1")
    label_bg.set("stroke-opacity", "0.3")

    label_elem = ET.SubElement(nodes_g, "text")
    label_elem.set("x", f"{x:.1f}")
    label_elem.set("y", f"{y + 86:.1f}")
    label_elem.set("text-anchor", "middle")
    label_elem.set("fill", INK)
    label_elem.set("font-size", "24")
    label_elem.set("font-family", "sans-serif")
    label_elem.set("font-weight", "600")
    label_elem.text = station["label"]

    # Tooltip
    title = ET.SubElement(outer, "title")
    title.text = f"{station['id']}: {station['label']}"

# Legend
legend_g = ET.SubElement(svg_root, "g")
legend_g.set("class", "legend")
legend_x = WIDTH - 420
legend_y = HEIGHT - 180

# Legend background
legend_bg = ET.SubElement(legend_g, "rect")
legend_bg.set("x", str(legend_x - 30))
legend_bg.set("y", str(legend_y - 50))
legend_bg.set("width", "400")
legend_bg.set("height", "160")
legend_bg.set("fill", ELEVATED_BG)
legend_bg.set("fill-opacity", "0.95")
legend_bg.set("stroke", INK_MUTED)
legend_bg.set("stroke-width", "2")
legend_bg.set("stroke-opacity", "0.3")
legend_bg.set("rx", "10")

# Legend title
legend_title = ET.SubElement(legend_g, "text")
legend_title.set("x", str(legend_x))
legend_title.set("y", str(legend_y - 10))
legend_title.set("fill", INK)
legend_title.set("font-size", "32")
legend_title.set("font-family", "sans-serif")
legend_title.set("font-weight", "bold")
legend_title.text = "Route Types"

# Legend items
legend_items = [("RE - Regional Express", IMPRINT[0]), ("EX - Express", IMPRINT[1]), ("LO - Local", IMPRINT[2])]

for i, (label, color) in enumerate(legend_items):
    ly = legend_y + 30 + i * 35

    # Line symbol
    line_sym = ET.SubElement(legend_g, "line")
    line_sym.set("x1", str(legend_x))
    line_sym.set("y1", str(ly))
    line_sym.set("x2", str(legend_x + 50))
    line_sym.set("y2", str(ly))
    line_sym.set("stroke", color)
    line_sym.set("stroke-width", "5")

    # Arrow marker
    arrow = ET.SubElement(legend_g, "polygon")
    arrow.set("points", f"{legend_x + 52},{ly - 6} {legend_x + 52},{ly + 6} {legend_x + 64},{ly}")
    arrow.set("fill", color)

    # Label text
    label_elem = ET.SubElement(legend_g, "text")
    label_elem.set("x", str(legend_x + 80))
    label_elem.set("y", str(ly + 8))
    label_elem.set("fill", INK_SOFT)
    label_elem.set("font-size", "26")
    label_elem.set("font-family", "sans-serif")
    label_elem.text = label

# Convert SVG to string
svg_output = ET.tostring(svg_root, encoding="unicode")

# Write HTML file
html_content = f"""<!DOCTYPE html>
<html lang="en">
<head>
    <meta charset="UTF-8">
    <meta name="viewport" content="width=device-width, initial-scale=1.0">
    <title>network-transport-static - pygal - anyplot.ai</title>
    <style>
        body {{ margin: 0; padding: 20px; background: {PAGE_BG}; font-family: sans-serif; }}
        .container {{ max-width: 100%; overflow: auto; }}
        svg {{ display: block; margin: 0 auto; box-shadow: 0 4px 20px rgba(0,0,0,0.15); }}
    </style>
</head>
<body>
    <div class="container">
        {svg_output}
    </div>
</body>
</html>"""

with open(f"plot-{THEME}.html", "w", encoding="utf-8") as f:
    f.write(html_content)

# Render to PNG using cairosvg
cairosvg.svg2png(
    bytestring=svg_output.encode("utf-8"), write_to=f"plot-{THEME}.png", output_width=WIDTH, output_height=HEIGHT
)
Runnable source as JSON, for any HTTP client: https://api.anyplot.ai/specs/network-transport-static/pygal/code. Any spec id and library id listed in llms-full.txt fit the same URL shape; every URL below is complete and callable.
{
  "spec_id": "network-transport-static",
  "language": "python",
  "library": "pygal",
  "page": "https://anyplot.ai/network-transport-static/python/pygal",
  "hub": "https://anyplot.ai/network-transport-static",
  "code_json": "https://api.anyplot.ai/specs/network-transport-static/pygal/code",
  "spec_json": "https://api.anyplot.ai/specs/network-transport-static",
  "render_light_png": "https://storage.googleapis.com/anyplot-images/plots/network-transport-static/python/pygal/plot-light.png",
  "render_dark_png": "https://storage.googleapis.com/anyplot-images/plots/network-transport-static/python/pygal/plot-dark.png",
  "interactive_light_html": "https://storage.googleapis.com/anyplot-images/plots/network-transport-static/python/pygal/plot-light.html",
  "interactive_dark_html": "https://storage.googleapis.com/anyplot-images/plots/network-transport-static/python/pygal/plot-dark.html",
  "quality_score": 87.0,
  "license": "MIT",
  "guide": "https://anyplot.ai/llms.txt"
}
Part of Static Transport Network Diagram on anyplot.ai.