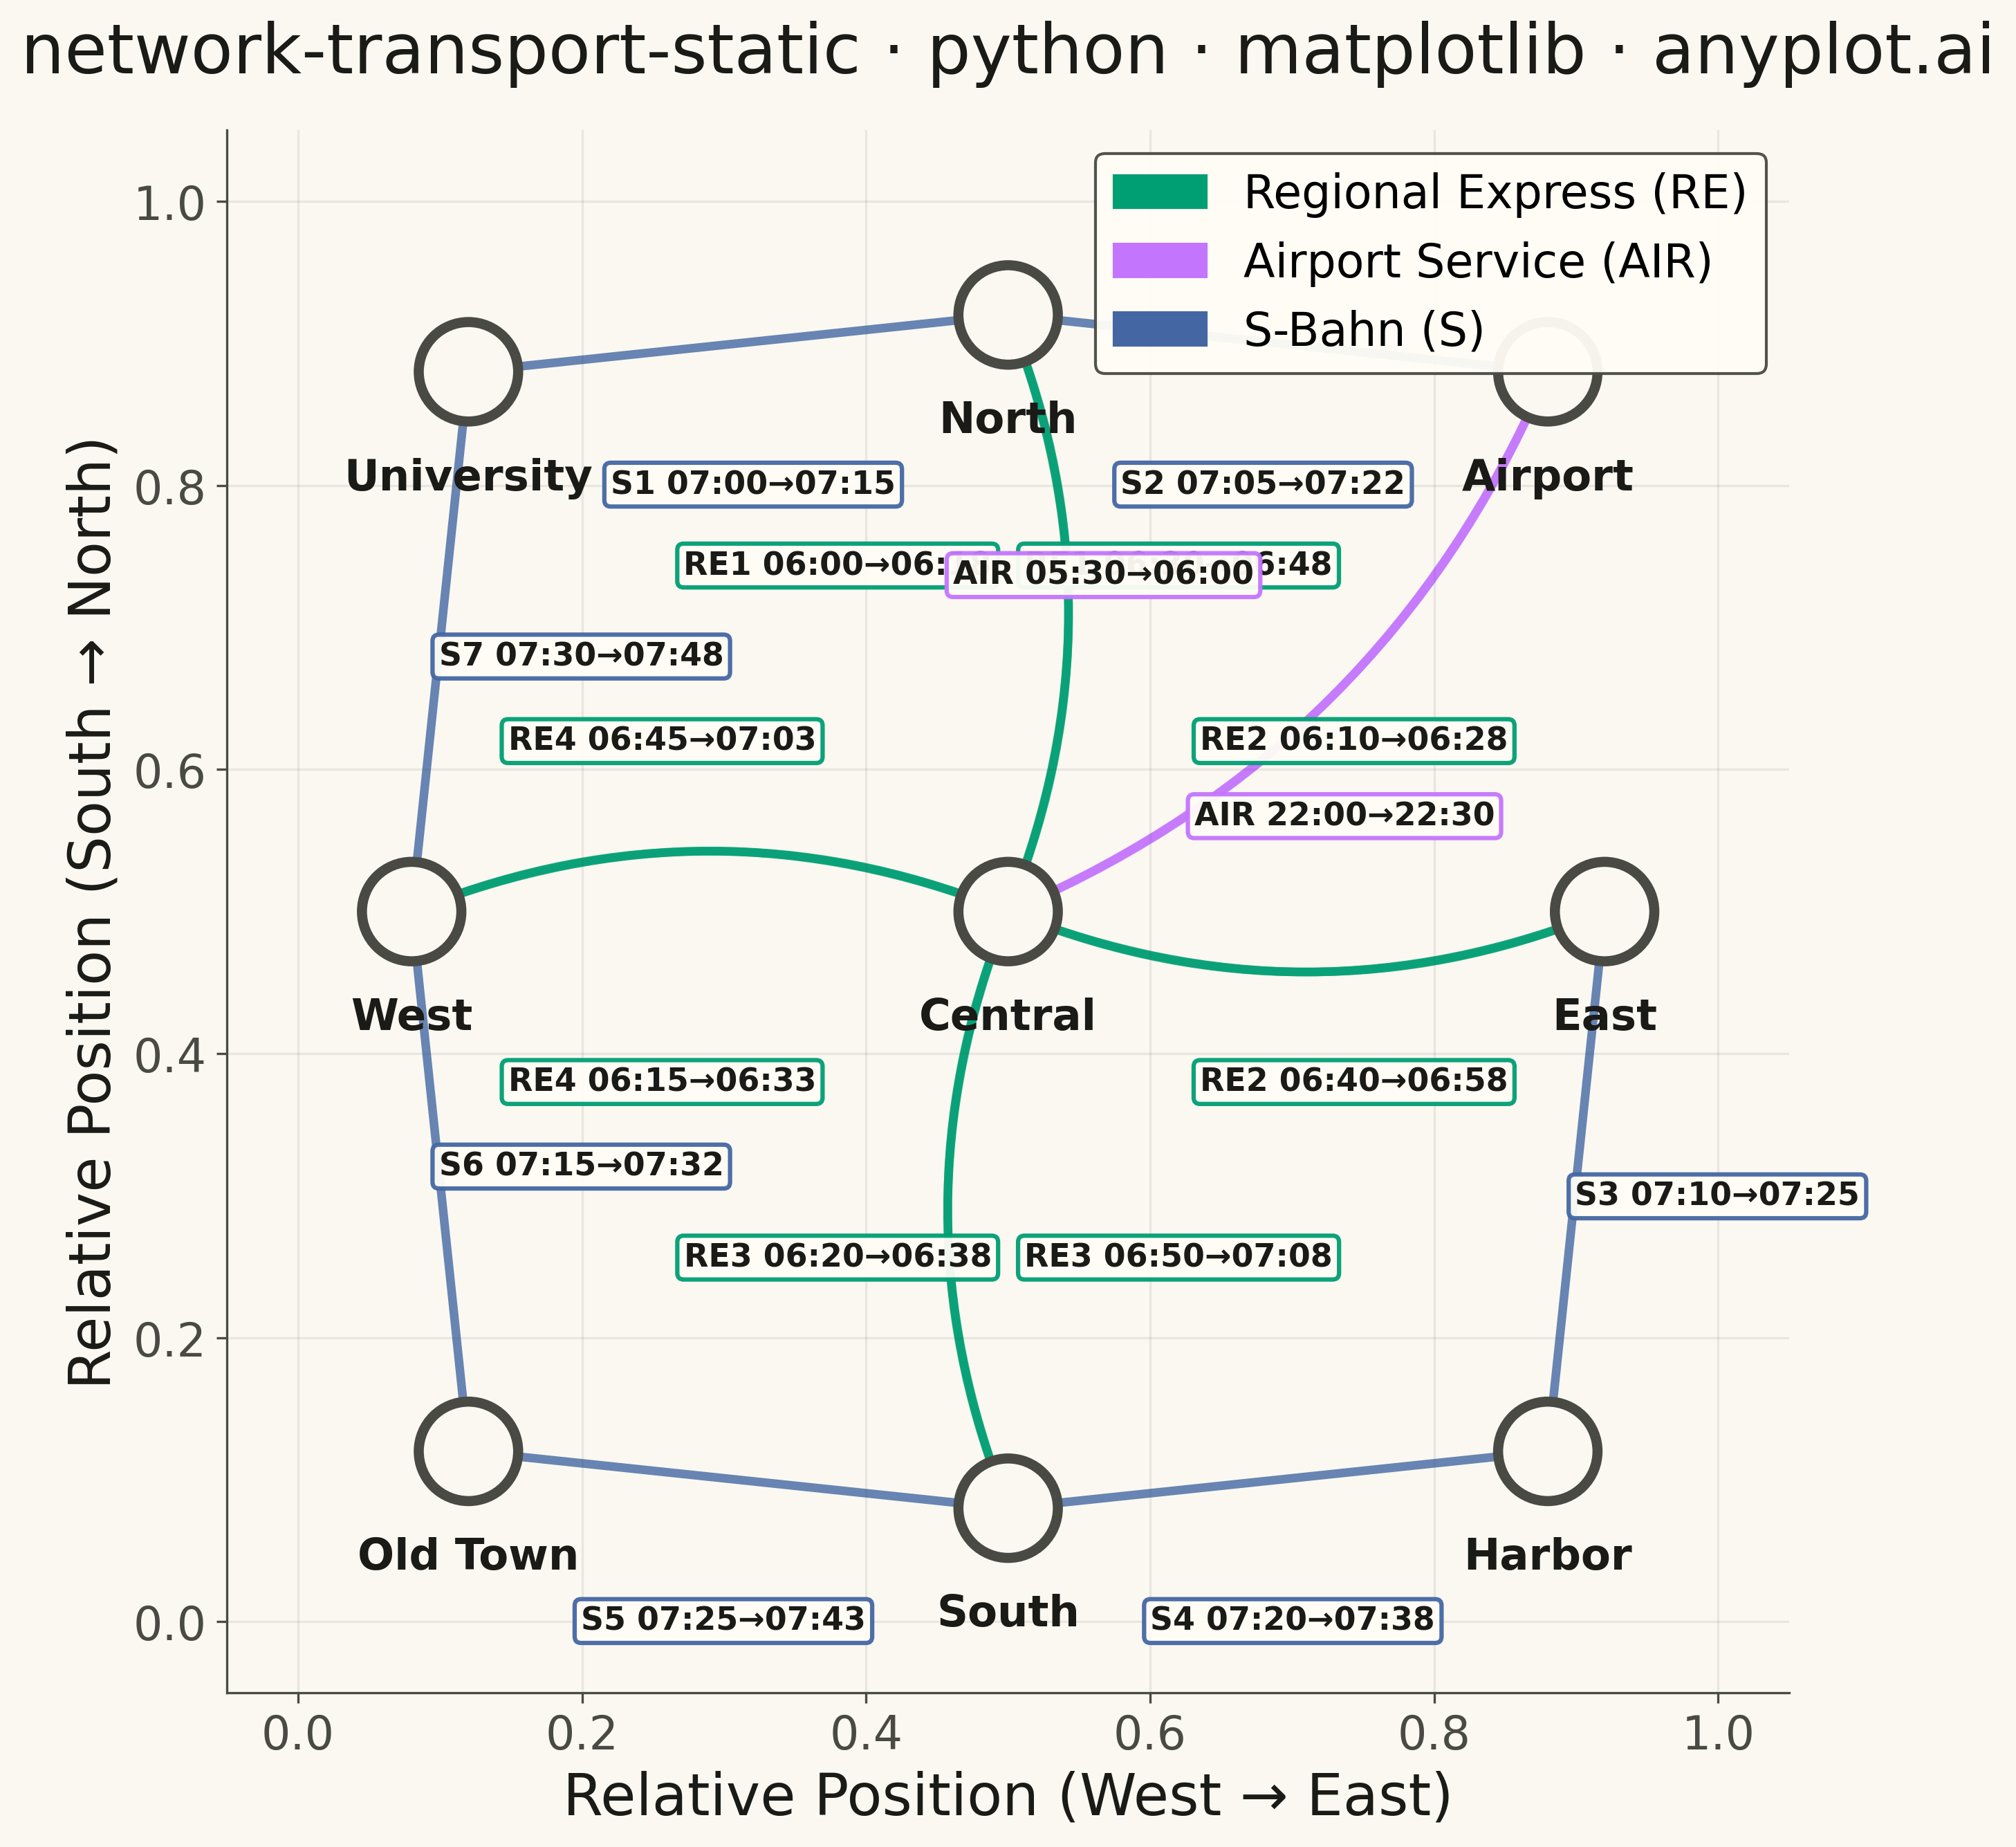
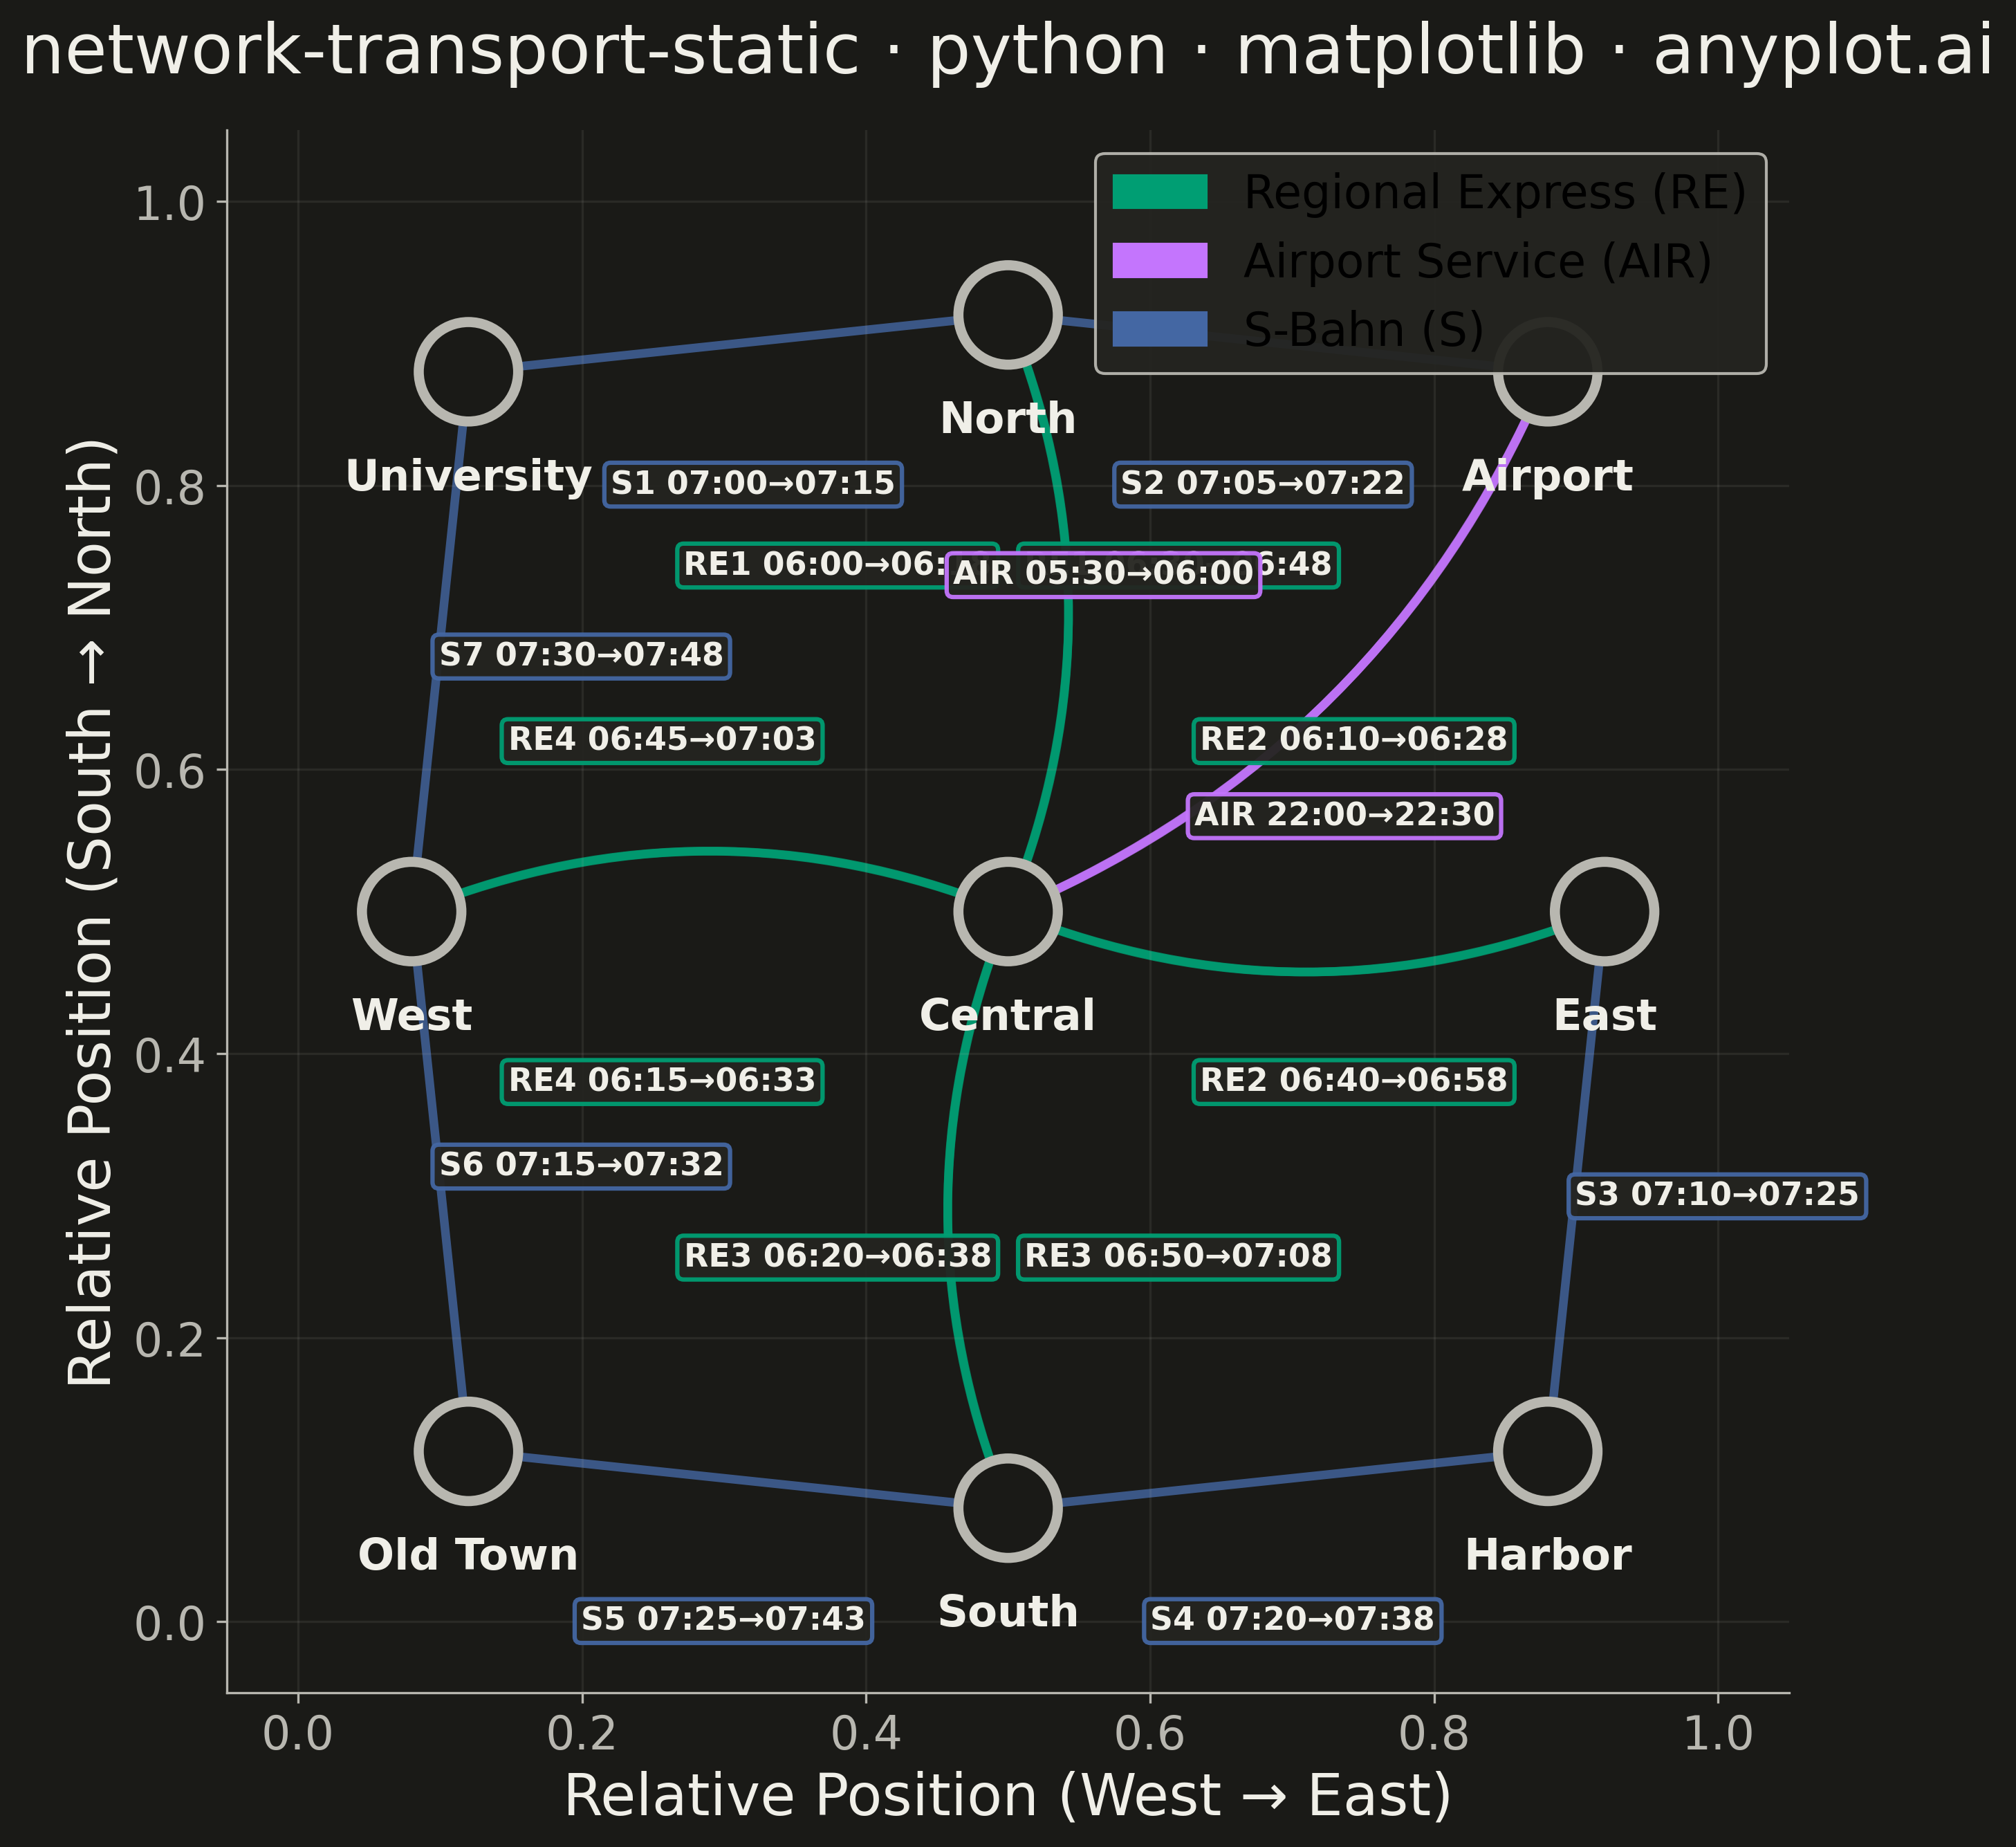
A directed network visualization for transportation systems where stations are displayed as labeled nodes and train/bus routes as directed edges. Edges display departure times, arrival times, and route identifiers. Designed for visualizing timetables, route maps, and connection patterns in rail, bus, or flight networks. This static version focuses on clear, readable presentation without interactive repositioning.
""" anyplot.ai
network-transport-static: Static Transport Network Diagram
Library: matplotlib 3.10.9 | Python 3.13.13
Quality: 92/100 | Updated: 2026-05-18
"""

import os

import matplotlib.patches as mpatches
import matplotlib.pyplot as plt
import numpy as np


# Theme tokens
THEME = os.getenv("ANYPLOT_THEME", "light")
PAGE_BG = "#FAF8F1" if THEME == "light" else "#1A1A17"
ELEVATED_BG = "#FFFDF6" if THEME == "light" else "#242420"
INK = "#1A1A17" if THEME == "light" else "#F0EFE8"
INK_SOFT = "#4A4A44" if THEME == "light" else "#B8B7B0"

# Okabe-Ito palette for route types
IMPRINT = ["#009E73", "#C475FD", "#4467A3", "#BD8233", "#AE3030", "#2ABCCD", "#954477"]

# Seed for reproducibility
np.random.seed(42)

# Station data - regional rail network with geographic-style positioning
stations = [
    {"id": 0, "label": "Central", "x": 0.5, "y": 0.5},
    {"id": 1, "label": "North", "x": 0.5, "y": 0.92},
    {"id": 2, "label": "East", "x": 0.92, "y": 0.5},
    {"id": 3, "label": "South", "x": 0.5, "y": 0.08},
    {"id": 4, "label": "West", "x": 0.08, "y": 0.5},
    {"id": 5, "label": "Airport", "x": 0.88, "y": 0.88},
    {"id": 6, "label": "University", "x": 0.12, "y": 0.88},
    {"id": 7, "label": "Harbor", "x": 0.88, "y": 0.12},
    {"id": 8, "label": "Old Town", "x": 0.12, "y": 0.12},
]

# Route data with manual label positioning for clarity
# t_pos: position along edge (0=source, 1=target)
# offset: perpendicular offset multiplier (positive = left of direction)
# type: route type (0=RE, 1=AIR, 2=S) for Okabe-Ito color mapping
routes = [
    # Main lines from Central (RE = Regional Express) - outbound
    {
        "source": 0,
        "target": 1,
        "route": "RE1",
        "dep": "06:00",
        "arr": "06:18",
        "t_pos": 0.58,
        "offset": 0.12,
        "type": 0,
    },
    {
        "source": 0,
        "target": 2,
        "route": "RE2",
        "dep": "06:10",
        "arr": "06:28",
        "t_pos": 0.58,
        "offset": 0.12,
        "type": 0,
    },
    {
        "source": 0,
        "target": 3,
        "route": "RE3",
        "dep": "06:20",
        "arr": "06:38",
        "t_pos": 0.58,
        "offset": -0.12,
        "type": 0,
    },
    {
        "source": 0,
        "target": 4,
        "route": "RE4",
        "dep": "06:15",
        "arr": "06:33",
        "t_pos": 0.58,
        "offset": 0.12,
        "type": 0,
    },
    # Main lines - return to Central
    {
        "source": 1,
        "target": 0,
        "route": "RE1",
        "dep": "06:30",
        "arr": "06:48",
        "t_pos": 0.42,
        "offset": 0.12,
        "type": 0,
    },
    {
        "source": 2,
        "target": 0,
        "route": "RE2",
        "dep": "06:40",
        "arr": "06:58",
        "t_pos": 0.42,
        "offset": 0.12,
        "type": 0,
    },
    {
        "source": 3,
        "target": 0,
        "route": "RE3",
        "dep": "06:50",
        "arr": "07:08",
        "t_pos": 0.42,
        "offset": -0.12,
        "type": 0,
    },
    {
        "source": 4,
        "target": 0,
        "route": "RE4",
        "dep": "06:45",
        "arr": "07:03",
        "t_pos": 0.42,
        "offset": 0.12,
        "type": 0,
    },
    # Airport express (AIR)
    {
        "source": 0,
        "target": 5,
        "route": "AIR",
        "dep": "05:30",
        "arr": "06:00",
        "t_pos": 0.40,
        "offset": 0.12,
        "type": 1,
    },
    {
        "source": 5,
        "target": 0,
        "route": "AIR",
        "dep": "22:00",
        "arr": "22:30",
        "t_pos": 0.60,
        "offset": 0.12,
        "type": 1,
    },
    # Suburban lines (S-Bahn) - single direction only
    {"source": 1, "target": 6, "route": "S1", "dep": "07:00", "arr": "07:15", "t_pos": 0.5, "offset": 0.10, "type": 2},
    {"source": 1, "target": 5, "route": "S2", "dep": "07:05", "arr": "07:22", "t_pos": 0.5, "offset": -0.10, "type": 2},
    {"source": 2, "target": 7, "route": "S3", "dep": "07:10", "arr": "07:25", "t_pos": 0.5, "offset": 0.10, "type": 2},
    {"source": 3, "target": 7, "route": "S4", "dep": "07:20", "arr": "07:38", "t_pos": 0.5, "offset": -0.10, "type": 2},
    {"source": 3, "target": 8, "route": "S5", "dep": "07:25", "arr": "07:43", "t_pos": 0.5, "offset": 0.10, "type": 2},
    {"source": 4, "target": 8, "route": "S6", "dep": "07:15", "arr": "07:32", "t_pos": 0.5, "offset": 0.10, "type": 2},
    {"source": 4, "target": 6, "route": "S7", "dep": "07:30", "arr": "07:48", "t_pos": 0.5, "offset": -0.10, "type": 2},
]

# Create figure
fig, ax = plt.subplots(figsize=(16, 9), facecolor=PAGE_BG)
ax.set_facecolor(PAGE_BG)

# Set axis limits with padding
ax.set_xlim(-0.05, 1.05)
ax.set_ylim(-0.05, 1.05)

# Track route pairs for curve calculation
route_pairs = {}
for route in routes:
    pair = (min(route["source"], route["target"]), max(route["source"], route["target"]))
    if pair not in route_pairs:
        route_pairs[pair] = []
    route_pairs[pair].append(route)

# Draw routes as curved arrows with labels
for route in routes:
    src = stations[route["source"]]
    tgt = stations[route["target"]]

    # Get curve parameters based on multiple routes between same stations
    pair = (min(route["source"], route["target"]), max(route["source"], route["target"]))
    same_pair = route_pairs[pair]
    n_routes = len(same_pair)

    # Calculate curve direction and strength for bidirectional routes
    if n_routes == 1:
        curve = 0.0
    else:
        # Outbound from lower-id station gets positive curve
        if route["source"] < route["target"]:
            curve = 0.2
        else:
            curve = -0.2

    # Get route color from Okabe-Ito palette based on type
    color = IMPRINT[route["type"]]

    # Draw arrow
    arrow = mpatches.FancyArrowPatch(
        (src["x"], src["y"]),
        (tgt["x"], tgt["y"]),
        connectionstyle=f"arc3,rad={curve}",
        arrowstyle="->,head_length=10,head_width=6",
        color=color,
        linewidth=3,
        alpha=0.8,
        zorder=1,
    )
    ax.add_patch(arrow)

    # Get label position from route data
    t = route["t_pos"]
    base_offset = route["offset"]

    # Linear position along edge
    base_x = src["x"] + t * (tgt["x"] - src["x"])
    base_y = src["y"] + t * (tgt["y"] - src["y"])

    # Calculate perpendicular direction
    dx = tgt["x"] - src["x"]
    dy = tgt["y"] - src["y"]
    length = np.sqrt(dx**2 + dy**2)

    if length > 0:
        perp_x = -dy / length
        perp_y = dx / length
    else:
        perp_x, perp_y = 0, 0

    label_x = base_x + perp_x * base_offset
    label_y = base_y + perp_y * base_offset

    # Route label with times
    label_text = f"{route['route']} {route['dep']}→{route['arr']}"
    ax.annotate(
        label_text,
        (label_x, label_y),
        fontsize=11,
        ha="center",
        va="center",
        color=INK,
        fontweight="bold",
        bbox={
            "boxstyle": "round,pad=0.2",
            "facecolor": ELEVATED_BG,
            "edgecolor": color,
            "linewidth": 1.5,
            "alpha": 0.95,
        },
        zorder=3,
    )

# Draw station nodes
node_radius = 0.035
for station in stations:
    # Node circle with fill
    circle = plt.Circle(
        (station["x"], station["y"]), node_radius, facecolor=PAGE_BG, edgecolor=INK_SOFT, linewidth=3.5, zorder=4
    )
    ax.add_patch(circle)

    # Station label below node
    ax.annotate(
        station["label"],
        (station["x"], station["y"] - node_radius - 0.025),
        fontsize=15,
        ha="center",
        va="top",
        fontweight="bold",
        color=INK,
        zorder=5,
    )

# Create legend
legend_elements = [
    mpatches.Patch(facecolor=IMPRINT[0], edgecolor=IMPRINT[0], label="Regional Express (RE)"),
    mpatches.Patch(facecolor=IMPRINT[1], edgecolor=IMPRINT[1], label="Airport Service (AIR)"),
    mpatches.Patch(facecolor=IMPRINT[2], edgecolor=IMPRINT[2], label="S-Bahn (S)"),
]
leg = ax.legend(handles=legend_elements, loc="upper right", fontsize=16, framealpha=0.95)
if leg:
    leg.get_frame().set_facecolor(ELEVATED_BG)
    leg.get_frame().set_edgecolor(INK_SOFT)
    leg.get_frame().set_linewidth(1)

# Styling
ax.set_title(
    "network-transport-static · python · matplotlib · anyplot.ai", fontsize=24, fontweight="medium", color=INK, pad=20
)
ax.set_xlabel("Relative Position (West → East)", fontsize=20, color=INK)
ax.set_ylabel("Relative Position (South → North)", fontsize=20, color=INK)
ax.tick_params(axis="both", labelsize=16, colors=INK_SOFT)
ax.set_aspect("equal")

# Subtle grid
ax.grid(True, alpha=0.10, linewidth=0.8, color=INK_SOFT)

# Remove spines
ax.spines["top"].set_visible(False)
ax.spines["right"].set_visible(False)
for spine in ["left", "bottom"]:
    ax.spines[spine].set_color(INK_SOFT)

plt.tight_layout()
plt.savefig(f"plot-{THEME}.png", dpi=300, bbox_inches="tight", facecolor=PAGE_BG)
Runnable source as JSON, for any HTTP client: https://api.anyplot.ai/specs/network-transport-static/matplotlib/code. Any spec id and library id listed in llms-full.txt fit the same URL shape; every URL below is complete and callable.
{
  "spec_id": "network-transport-static",
  "language": "python",
  "library": "matplotlib",
  "page": "https://anyplot.ai/network-transport-static/python/matplotlib",
  "hub": "https://anyplot.ai/network-transport-static",
  "code_json": "https://api.anyplot.ai/specs/network-transport-static/matplotlib/code",
  "spec_json": "https://api.anyplot.ai/specs/network-transport-static",
  "render_light_png": "https://storage.googleapis.com/anyplot-images/plots/network-transport-static/python/matplotlib/plot-light.png",
  "render_dark_png": "https://storage.googleapis.com/anyplot-images/plots/network-transport-static/python/matplotlib/plot-dark.png",
  "quality_score": 92.0,
  "license": "MIT",
  "guide": "https://anyplot.ai/llms.txt"
}
Part of Static Transport Network Diagram on anyplot.ai.